Statistical discrepancies (SDs) in the measurement of gross domestic product (GDP) is an empirical challenge worldwide. In India’s GDP data, SDs have been both large and volatile but with the rebasing of national accounts to 2011-12, along with improved coverage and refinements in methodology, measurement errors have reduced. Currently SDs in India’s GDP compare well with other developed and emerging market economies. Examining this experience, this article recommends that the Central Statistics Office (CSO) may consider using supply-use tables for reconciliation of SDs going forward. I. Introduction Real gross domestic product (GDP) is the most important measure of economic activity and is widely used by policy makers, analysts and academicians (Chakravarty, 2016; Keohane, 2016; Zhong, 2016). GDP can be measured by production, expenditure and income approaches. In the production approach, gross value added (GVA) at basic prices is added with net product taxes to arrive at GDP at market prices. In the income approach, gross domestic income (GDI) is a sum of compensation to employees, gross operating surplus/mixed income, consumption of fixed capital, and net production and product taxes. In the expenditure approach, GDP at market prices is arrived at by adding consumption expenditure (both private and government), investment and net exports (exports minus imports). Technically, GDP estimated by using these three approaches should be the same; however, in practice, this is rarely so. Differences in GDP aggregates arrived at through different methods are known as SDs which are recognised in the United Nation’s System of National Accounts 2008 (henceforth SNA 2008). The SNA 2008 suggests two approaches to overcome this problem: (i) publish SD by attaching it with a less accurate variant of GDP; and (ii) remove SD by making the best judgement possible as to where the errors have likely arisen and modifying it accordingly. In India’s National Accounts Statistics (NAS), the production approach for estimation of GDP is considered to be more accurate and SDs are explicitly provided on the expenditure side (CSO, 2012). Hence, the Indian system is akin to the first recommendation of the SNA 2008. SDs pose serious problems to analysts, researchers and policy makers in explaining GDP growth in terms of its components. For instance, during 2012-13, 2013-14 and 2015-16, the contribution of SDs to GDP growth was (+) 14.9 per cent, (-) 12.7 per cent and (+) 24.2 per cent, respectively. Globally, several efforts have been made to analyse the sources, size and trends of SDs in GDP (Bajada, 2001; Bloem et al., 1997; Chang and Li, 2015; Ellis, 2014). Notwithstanding the animated debate on the subject, especially with the availability of the new series of national accounts with 2011-12 as the base year, a detailed investigation is a gap in the Indian context, which this article attempts to fill. The remainder of the article is organised as follows: Section II focuses on the concept, trend and composition of SD in the Indian GDP data; Section III presents a brief cross-country experience; and Section IV offers some pragmatic conclusions. II. The Stylised Facts on SDs in India’s National Accounts In the Indian context, SDs are a combination of discrepancies in (i) national disposable income and its appropriation account, (ii) the capital finance account, and (iii) the external transactions account.1 The consolidated discrepancy is reported in GDP on the expenditure account2. Disposable income and its appropriation account is derived from final consumption expenditure (both private and government) and saving as well as from the production account, i.e., net value added at basic prices plus net factor flows from the rest of the world plus net indirect taxes plus other current transfers from the rest of the world. SDs are the overall difference between the production approach and the disposable income derived from consumption and saving. The capital finance account provides information on gross capital formation (GCF) and gross savings. GCF is estimated using two approaches: (i) through the flow of funds approach, derived as gross savings plus net capital inflow from abroad; and (ii) through the commodity flow approach, derived by the type of assets. By convention, GCF estimated through the flow of funds approach is treated as firmer, and the difference between the two approaches is taken as ‘errors and omissions’. In an external transactions account, SDs relate to the difference in two sources of data— the Reserve Bank of India (RBI) and Directorate General of Commercial Intelligence and Statistics (DGCIS)—on merchandise exports and imports. The difference between the two approaches is taken as ‘net adjustments’. The consolidated SDs are shown in GDP using the expenditure approach3. Therefore, SDs give a measure of the overall difference between production and expenditure approaches. As a matter of convention, GDP from the production approach, which is considered to be firmer, is treated as the final GDP (CSO, 2012). For the sake of analytical convenience, the period under study (1950–51 to 2016–17) is divided into four phases4 (Chart 1). Each phase has a distinct characteristic. 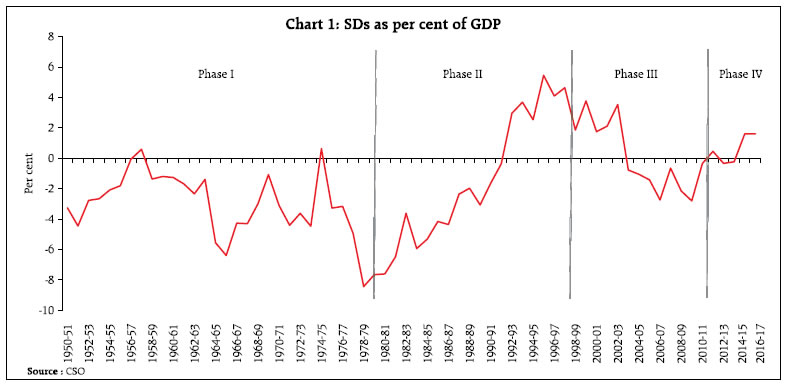 In Phase I, the share of SDs in GDP was mostly negative and it fluctuated without any specific trend. In Phase II, however, it followed an increasing trend with relatively damped fluctuations. This reversed in Phase III with SDs, moving towards zero, indicating the sustained endeavour of CSO to improve data quality. In terms of magnitude, average SDs have remained small, ranging from (-) 3.0 per cent of GDP to (+) 0.5 per cent across the four phases (Table 1). However, the coefficient of variation of the share of SDs in GDP indicates that they are the most volatile component relative to other components of GDP. Interesting stylised facts relating to SD that emanate from empirical analysis are set out below: i. Chart 2a and annex tables show the wide range in which SDs have moved, resultingin contributions5 to real GDP growth, the number has varied between extremes of (-) 426 per cent (in 1957–58) to 1514 per cent (in 1965–66) and in seven6 years, the contribution of SD to real GDP growth has been more than (+/-) 100 per cent (Chart 2b). | Table 1: Descriptive Statistics of Expenditure Side of GDP | | | Private Consumption | Government Consumption | Fixed Investment | Exports | Imports | Statistical Discrepancies | | Mean (Share in GDP) | | Phase I | 78.8 | 8.0 | 16.9 | 5.1 | 6.8 | -3.0 (3.0) | | Phase II | 69.2 | 11.9 | 21.7 | 7.3 | 9.2 | -2.0 (4.1) | | Phase III | 60.3 | 11.5 | 28.6 | 17.3 | 21.3 | 0.5 (1.8) | | Phase IV | 56.2 | 10.3 | 32.3 | 23.3 | 26.4 | 0.5 (0.8) | | Volatility (Standard Deviation) | | Phase I | 4.9 | 2.0 | 2.6 | 1.2 | 1.6 | 2.0 | | Phase II | 4.1 | 0.7 | 1.1 | 1.4 | 2.1 | 4.2 | | Phase III | 1.8 | 0.9 | 4.2 | 4.8 | 6.1 | 2.6 | | Phase IV | 0.3 | 0.5 | 1.7 | 2.1 | 4.3 | 0.9 | | Volatility (Coefficient of Variation) | | Phase I | 6.2 | 25.0 | 15.4 | 23.5 | 23.5 | -66.7 | | Phase II | 5.9 | 5.9 | 5.1 | 19.2 | 22.8 | -210.1 | | Phase III | 2.9 | 7.8 | 14.8 | 27.9 | 28.6 | 555.4 | | Phase IV | 0.6 | 4.4 | 5.2 | 9.1 | 16.2 | 203.8 | Note: Calculations are based on share in GDP; share will not add up to 100 per cent as some components of GDP are not reported here.
Figures in parentheses are absolute average share.
Source: CSO and staff calculations. | ii. At nominal prices, the share of SDs in GDP (Chart 2c) has mostly remained in the negative zone, moving into positive territory only in the most recent years and contributions have declined over time (Chart 2d) – symptomatic of non-availability of suitable price indices for deflating nominal GDP. iii. In terms of quarterly data, SDs are larger and more volatile in real terms than in nominal terms, both as shares to GDP and contributions to growth (Chart 37 and Table 2). iv. Similarly, share in GDP and contribution to growth are more volatile for quarterly data than annual data.
The CSO has started publishing information on SDs in advance estimates from 2007–08. A comparison with SDs in final revised estimates from 2007–08 onwards shows that SDs in the latter are higher in absolute mean terms (Chart 4). | Table 2: Descriptive Statistics for SD in Quarterly GDP | | | Real Prices | Nominal Prices | | Parameters | Share | Contribution to growth | Share | Contribution to growth | | Mean | -0.5 | 3.0 | 0.5 | -0.7 | | Mean absolute | 2.2 | 47.1 | 1.8 | 18.2 | | Standard deviation | 2.6 | 124.7 | 2.1 | 23.5 | | Source: CSO and staff calculations. |
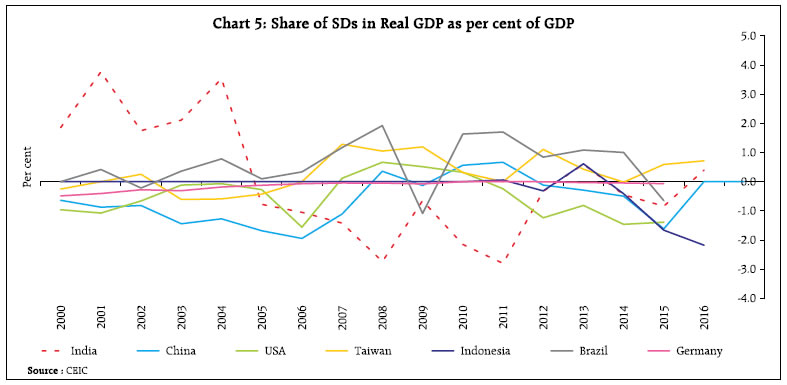
III. Cross-Country Experience SDs are not unique to Indian national accounts. A cross-country survey indicates similar experiences in many advanced and emerging market economies. In the United Kingdom (UK), SDs are shown in quarterly data, but are reconciled by the time the annual numbers arrive (Table 3). A similar practice is followed in Australia and Germany. These countries have issued detailed methodological notes on statistical reconciliation8. On the other hand, the United States of America (USA), Canada and China do not reconcile SDs. While the USA incorporates SDs in its income account, Canada uses the average of GDP from both sides as final GDP and allocates SDs in both estimates. In Singapore, reconciliation of GDP accounts occurs once every five years. A survey of country practices indicates that ‘supply-use tables’ are the most important avenue for reconciling SDs. A historical comparison across countries indicates that SDs have been relatively large in India. In the recent period, however, SDs in India have declined, and moved closer to peer levels (Chart 5). | Table 3: Treatment of SDs in National Accounts: Select Country Practices | | Country | Practice relating to SD | | USA | Difference between GDP (expenditure) and Gross Domestic Income (GDI) is treated as SD, which is accounted for in the GDI account. It is distinctly reported in national accounts data. However, efforts are being made to minimise the size of SD through improving quality of data, balancing and benchmarking. | | UK | Annual supply-use balancing eliminates discrepancy prior to balancing, GDP is based on output approach; discrepancies are shown in GDP estimated from income approach and expenditure approach. | | Canada | GDP is the average of income and expenditure methods. SD is shown on both sides of GDP. Annual fully balanced supply-use tables are used for reconciliation, but it isn’t fully benchmarked to eliminate SD. | | Australia | For eliminating SD annual supply-use tables are used. Quarterly real GDP is the average of three approaches. | | Singapore | Differences between GDP compiled from the production approach and the expenditure approach are allocated to a SD item in the expenditure-based estimates. The reconciliation of the separate measures of GDP (production, expenditure and income) is conducted once every five years. |
 IV. Conclusion GDP is commonly used as the metric for evaluating the state of economic activity, since it approximates aggregate demand conditions and is amenable to cross-country comparison. In India, however, there is an overwhelming preference of statisticians, the academia and policy makers for the use of gross value added (GVA) in view of the latter’s superior sectoral coverage and tractability in terms of explaining primary, secondary and tertiary areas of activity that together constitute aggregate supply. GVA is also a better reflection of the productivity of producers as it excludes indirect taxes which could distort an analytical view of the production process. As a result, high frequency indicators of activity have developed around the constituents of GVA and less robustly around GDP. In the same vein, however, it can be argued that GDP is distorted by the presence of subsidies. Moreover, the compulsion of international comparison is increasingly becoming binding for India as it integrates rapidly into the global economy and contributes increasingly to global growth. From a practitioner’s perspective, an important factor hindering the use of GDP in India is the size of SDs embedded in it, relative to advanced economies and peer emerging economies as well, as this article points out. Until recently too, SDs in Indian national accounts have also proved to be volatile - and more so in terms of constant prices – which disfigures an accurate assessment of the underlying macroeconomic situation. In fact, GDP excluding SDs compares favorably with GVA in terms of means and volatility. What is heartening from the point of view of this article though, is the noteworthy progress made in more recent years in improving coverage and data collection process as well as in refining methodologies of enumeration/estimation. As a result, measurement errors have been reduced. Carrying this improvement forward to the logical end of adopting GDP as the formal headline measure of activity has gained renewed interest. In the UK, supply-use tables are employed for making adjustments to data on output, expenditure and income aggregates. India has started publishing supply-use tables, with data for 2011-12 and 2012-13 available in the public domain. Going forward, the CSO may consider using these tables for reconciliation of final GDP estimates and for eliminating SDs or minimising their size and volatility to peer country levels. References Bajada, Christopher (2001). “An Examination of the Statistical Discrepancy and Private Investment expenditure”, Journal of Applied Economics, Vol. IV, No 1. Bloem, Adriaan M., Robert Dippelsman, Fenella Maitland-Smith, and Paul Armknecht (1997). “Discrepancies between Quarterly GDP Estimates”, IMF WP/97/123. Central Statistics Office (CSO) (2012). National Accounts Statistics: Sources and Methods. Chakravarty, M. (2016), “‘Discrepancies’ Drive GDP Growth”, Retrieved 14 March 2017, from The Livemint: http://www.livemint.com/Opinion/kvvDHfbryOQjvu2l16UcEI/Discrepancies-drive-GDP-growth.html Chang, Andrew C. and Phillip Li (2015). “Measurement Error in Macroeconomic Data and Economic Research: Data Revisions, Gross Domestic Product, and Gross Domestic Income”, Finance and Economics Discussion Series 2015-102. Washington: Board of Governors of the Federal Reserve System, http://dx.doi.org/10.17016/FEDS.2015.102. Daniel, Ellis (2014). “An Introduction to Reconciled Estimates of GDP”, National Accounts Coordination Division, ONS, 28 March 2014. Keohane, D. (2016). Alphaville. Retrieved 14 March 2017 from The Financial Times: https://ftalphaville.ft.com/2016/06/01/2164140/discrepancies-and-indiangdp-data/. Zhong, R. (2016). http://blogs.wsj.com. Retrieved 7 March 2017, from The Wall Street Journal: http://blogs.wsj.com/indiarealtime/2016/06/02/indias-topstatistician-defends-economic-growth-numbers-wartsand-all/.
Annexure | A1: Statistical Discrepancy in Annual GDP at current prices (contd.) | | Year | GDP at market prices
(₹ billion) | Discrepancies
(₹ billion) | Growth rate (%) | Share of SDs in GDP (%) | Contribution to GDP Growth* | | 1 | 2 | 3 | 4 | 5 | 6 | | 1950-51 | 104.0 | -7.6 | | -7.3 | | | 1951-52 | 110.5 | -9.2 | 6.3 | -8.3 | -24.2 | | 1952-53 | 108.5 | -11.2 | -1.8 | -10.3 | 100.5 | | 1953-54 | 118.1 | -9.7 | 8.8 | -8.2 | 15.8 | | 1954-55 | 111.7 | -10.8 | -5.4 | -9.6 | 16.6 | | 1955-56 | 113.7 | -11.8 | 1.8 | -10.4 | -51.7 | | 1956-57 | 135.5 | -12.0 | 19.1 | -8.8 | -0.8 | | 1957-58 | 139.5 | -10.6 | 3.0 | -7.6 | 34.9 | | 1958-59 | 155.5 | -10.7 | 11.5 | -6.9 | -1.1 | | 1959-60 | 163.8 | -14.4 | 5.4 | -8.8 | -43.9 | | 1960-61 | 179.4 | -13.9 | 9.5 | -7.7 | 3.3 | | 1961-62 | 190.1 | -15.1 | 6.0 | -7.9 | -11.0 | | 1962-63 | 204.3 | -15.7 | 7.5 | -7.7 | -4.3 | | 1963-64 | 234.6 | -13.9 | 14.8 | -5.9 | 5.9 | | 1964-65 | 273.7 | -16.3 | 16.6 | -5.9 | -6.1 | | 1965-66 | 288.6 | -21.5 | 5.4 | -7.4 | -34.9 | | 1966-67 | 326.7 | -29.4 | 13.2 | -9.0 | -20.8 | | 1967-68 | 382.6 | -36.2 | 17.1 | -9.5 | -12.2 | | 1968-69 | 405.1 | -20.0 | 5.9 | -4.9 | 72.2 | | 1969-70 | 446.1 | -22.8 | 10.1 | -5.1 | -6.8 | | 1970-71 | 476.4 | -25.7 | 6.8 | -5.4 | -9.7 | | 1971-72 | 510.0 | -40.6 | 7.1 | -8.0 | -44.4 | | 1972-73 | 562.1 | -41.0 | 10.2 | -7.3 | -0.8 | | 1973-74 | 684.2 | -37.3 | 21.7 | -5.4 | 3.1 | | 1974-75 | 807.7 | -74.3 | 18.1 | -9.2 | -30.0 | | 1975-76 | 867.1 | -54.2 | 7.4 | -6.2 | 33.9 | | 1976-77 | 934.2 | -46.7 | 7.7 | -5.0 | 11.2 | | 1977-78 | 1058.5 | -55.3 | 13.3 | -5.2 | -6.9 | | 1978-79 | 1146.5 | -83.1 | 8.3 | -7.2 | -31.5 | | 1979-80 | 1257.3 | -85.4 | 9.7 | -6.8 | -2.1 |
| A1: Statistical Discrepancy in Annual GDP at current prices (concld.) | | Year | GDP at market prices
(₹ billion) | Discrepancies
(₹ billion) | Growth rate (%) | Share of SDs in GDP (%) | Contribution to GDP Growth* | | 1 | 2 | 3 | 4 | 5 | 6 | | 1980-81 | 1496.4 | -60.4 | 19.0 | -4.0 | 10.4 | | 1981-82 | 1758.1 | -115.1 | 17.5 | -6.5 | -20.9 | | 1982-83 | 1966.4 | -133.3 | 11.9 | -6.8 | -8.8 | | 1983-84 | 2290.2 | -118.8 | 16.5 | -5.2 | 4.5 | | 1984-85 | 2566.1 | -169.8 | 12.0 | -6.6 | -18.5 | | 1985-86 | 2895.2 | -190.4 | 12.8 | -6.6 | -6.2 | | 1986-87 | 3239.5 | -257.7 | 11.9 | -8.0 | -19.6 | | 1987-88 | 3682.1 | -228.4 | 13.7 | -6.2 | 6.6 | | 1988-89 | 4368.9 | -249.5 | 18.7 | -5.7 | -3.1 | | 1989-90 | 5019.3 | -202.8 | 14.9 | -4.0 | 7.2 | | 1990-91 | 5862.1 | -198.0 | 16.8 | -3.4 | 0.6 | | 1991-92 | 6738.8 | -138.9 | 15.0 | -2.1 | 6.7 | | 1992-93 | 7745.5 | -125.0 | 14.9 | -1.6 | 1.4 | | 1993-94 | 8913.6 | 71.0 | 15.1 | 0.8 | 16.8 | | 1994-95 | 10455.9 | 43.5 | 17.3 | 0.4 | -1.8 | | 1995-96 | 12267.3 | -65.6 | 17.3 | -0.5 | -6.0 | | 1996-97 | 14192.8 | 396.7 | 15.7 | 2.8 | 24.0 | | 1997-98 | 15723.9 | 52.8 | 10.8 | 0.3 | -22.5 | | 1998-99 | 18033.8 | 167.8 | 14.7 | 0.9 | 5.0 | | 1999-00 | 20122.0 | -638.8 | 11.6 | -3.2 | -38.6 | | 2000-01 | 21686.5 | -170.9 | 7.8 | -0.8 | 29.9 | | 2001-02 | 23483.3 | -566.9 | 8.3 | -2.4 | -22.0 | | 2002-03 | 25306.6 | -0.6 | 7.8 | 0.0 | 31.1 | | 2003-04 | 28379.0 | 185.5 | 12.1 | 0.7 | 6.1 | | 2004-05 | 32422.1 | -251.5 | 14.2 | -0.8 | -10.8 | | 2005-06 | 36933.7 | -256.5 | 13.9 | -0.7 | -0.1 | | 2006-07 | 42947.1 | -303.6 | 16.3 | -0.7 | -0.8 | | 2007-08 | 49870.9 | -632.6 | 16.1 | -1.3 | -4.8 | | 2008-09 | 56300.6 | 506.2 | 12.9 | 0.9 | 17.7 | | 2009-10 | 64778.3 | -37.9 | 15.1 | -0.1 | -6.4 | | 2010-11 | 77841.2 | 302.3 | 20.2 | 0.4 | 2.6 | | 2011-12 | 87363.3 | -296.2 | 12.2 | -0.3 | -6.3 | | 2012-13 | 99440.1 | 1225.7 | 13.8 | 1.2 | 12.6 | | 2013-14 | 112335.2 | 1143.9 | 13.0 | 1.0 | -0.6 | | 2014-15 | 124679.6 | 186.9 | 11.0 | 0.1 | -7.8 | | 2015-16 | 137640.4 | 1853.2 | 10.4 | 1.3 | 12.9 | | 2016-17 | 152537.1 | 2181.4 | 10.8 | 1.4 | 2.2 | *: Contribution to GDP growth= ((SDt - SDt-1)/(Yt - Yt-1))*100
Note: Data from 2011-12 onwards are on 2011-12 base year prices, while earlier are on 2004-05 prices.
Source: CSO. |
| A2: Statistical Discrepancy in Annual GDP at constant prices (contd.) | | Year | GDP at market prices
(₹ billion) | Discrepancies
(₹ billion) | Growth rate (%) | Share of SDs in GDP (%) | Contribution to GDP Growth* | | 1 | 2 | 3 | 4 | 5 | 6 | | 1950-51 | 2939.4 | -112.1 | | -3.8 | | | 1951-52 | 3026.0 | -98.7 | 2.9 | -3.3 | 15.5 | | 1952-53 | 3105.4 | -138.3 | 2.6 | -4.5 | -49.9 | | 1953-54 | 3296.4 | -91.3 | 6.2 | -2.8 | 24.6 | | 1954-55 | 3455.0 | -92.0 | 4.8 | -2.7 | -0.5 | | 1955-56 | 3566.8 | -74.3 | 3.2 | -2.1 | 15.9 | | 1956-57 | 3765.8 | -68.1 | 5.6 | -1.8 | 3.1 | | 1957-58 | 3750.3 | -2.2 | -0.4 | -0.1 | -425.7 | | 1958-59 | 4027.5 | 23.7 | 7.4 | 0.6 | 9.3 | | 1959-60 | 4133.2 | -56.4 | 2.6 | -1.4 | -75.8 | | 1960-61 | 4360.4 | -52.2 | 5.5 | -1.2 | 1.8 | | 1961-62 | 4522.7 | -57.2 | 3.7 | -1.3 | -3.1 | | 1962-63 | 4655.3 | -78.4 | 2.9 | -1.7 | -16.0 | | 1963-64 | 4934.3 | -115.4 | 6.0 | -2.3 | -13.3 | | 1964-65 | 5302.1 | -73.6 | 7.5 | -1.4 | 11.4 | | 1965-66 | 5162.3 | -286.5 | -2.6 | -5.6 | 152.4 | | 1966-67 | 5159.5 | -329.8 | -0.1 | -6.4 | 1514.0 | | 1967-68 | 5563.2 | -237.2 | 7.8 | -4.3 | 22.9 | | 1968-69 | 5751.7 | -247.3 | 3.4 | -4.3 | -5.3 | | 1969-70 | 6127.9 | -183.8 | 6.5 | -3.0 | 16.9 | | 1970-71 | 6443.9 | -69.2 | 5.2 | -1.1 | 36.3 | | 1971-72 | 6549.8 | -203.4 | 1.6 | -3.1 | -126.7 | | 1972-73 | 6513.5 | -286.9 | -0.6 | -4.4 | 230.6 | | 1973-74 | 6728.2 | -243.7 | 3.3 | -3.6 | 20.2 | | 1974-75 | 6807.9 | -303.6 | 1.2 | -4.5 | -75.2 | | 1975-76 | 7430.8 | 46.5 | 9.1 | 0.6 | 56.2 | | 1976-77 | 7554.4 | -247.6 | 1.7 | -3.3 | -238.0 | | 1977-78 | 8102.5 | -256.0 | 7.3 | -3.2 | -1.5 | | 1978-79 | 8565.3 | -424.2 | 5.7 | -5.0 | -36.3 | | 1979-80 | 8116.7 | -684.5 | -5.2 | -8.4 | 58.0 |
| A2: Statistical Discrepancy in Annual GDP at constant prices (concld.) | | Year | GDP at market prices
(₹ billion) | Discrepancies
(₹ billion) | Growth rate (%) | Share of SDs in GDP (%) | Contribution to GDP Growth* | | 1 | 2 | 3 | 4 | 5 | 6 | | 1980-81 | 8663.4 | -662.7 | 6.7 | -7.6 | 4.0 | | 1981-82 | 9183.7 | -698.0 | 6.0 | -7.6 | -6.8 | | 1982-83 | 9502.9 | -615.3 | 3.5 | -6.5 | 25.9 | | 1983-84 | 10195.6 | -368.8 | 7.3 | -3.6 | 35.6 | | 1984-85 | 10585.2 | -627.8 | 3.8 | -5.9 | -66.5 | | 1985-86 | 11141.3 | -592.8 | 5.3 | -5.3 | 6.3 | | 1986-87 | 11673.5 | -485.2 | 4.8 | -4.2 | 20.2 | | 1987-88 | 12136.4 | -528.6 | 4.0 | -4.4 | -9.4 | | 1988-89 | 13304.9 | -314.1 | 9.6 | -2.4 | 18.4 | | 1989-90 | 14096.1 | -277.5 | 5.9 | -2.0 | 4.6 | | 1990-91 | 14876.1 | -455.6 | 5.5 | -3.1 | -22.8 | | 1991-92 | 15033.4 | -246.3 | 1.1 | -1.6 | 133.1 | | 1992-93 | 15857.6 | -56.8 | 5.5 | -0.4 | 23.0 | | 1993-94 | 16610.9 | 491.5 | 4.8 | 3.0 | 72.8 | | 1994-95 | 17717.0 | 652.5 | 6.7 | 3.7 | 14.6 | | 1995-96 | 19059.0 | 482.4 | 7.6 | 2.5 | -12.7 | | 1996-97 | 20497.9 | 1116.7 | 7.5 | 5.4 | 44.1 | | 1997-98 | 21328.0 | 872.8 | 4.0 | 4.1 | -29.4 | | 1998-99 | 22647.0 | 1049.9 | 6.2 | 4.6 | 13.4 | | 1999-00 | 24650.3 | 457.4 | 8.8 | 1.9 | -29.6 | | 2000-01 | 25597.1 | 964.2 | 3.8 | 3.8 | 53.5 | | 2001-02 | 26831.9 | 470.0 | 4.8 | 1.8 | -40.0 | | 2002-03 | 27852.6 | 588.5 | 3.8 | 2.1 | 11.6 | | 2003-04 | 30041.9 | 1060.9 | 7.9 | 3.5 | 21.6 | | 2004-05 | 32422.1 | -251.5 | 7.9 | -0.8 | -55.1 | | 2005-06 | 35432.4 | -372.9 | 9.3 | -1.1 | -4.0 | | 2006-07 | 38714.9 | -550.0 | 9.3 | -1.4 | -5.4 | | 2007-08 | 42509.5 | -1164.7 | 9.8 | -2.7 | -16.2 | | 2008-09 | 44163.5 | -287.8 | 3.9 | -0.7 | 53.0 | | 2009-10 | 47908.5 | -1030.6 | 8.5 | -2.2 | -19.8 | | 2010-11 | 52823.9 | -1480.4 | 10.3 | -2.8 | -9.2 | | 2011-12 | 87363.3 | -296.2 | 6.6 | -0.3 | 8.0 | | 2012-13 | 92130.2 | 416.4 | 5.5 | 0.5 | 14.9 | | 2013-14 | 98013.7 | -330.6 | 6.4 | -0.3 | -12.7 | | 2014-15 | 105276.8 | -244.9 | 7.4 | -0.2 | 1.2 | | 2015-16 | 113861.5 | 1828.4 | 8.2 | 1.6 | 24.2 | | 2016-17 | 121960.1 | 1962.3 | 7.1 | 1.6 | 1.7 | *: Contribution to GDP growth= ((SDt - SDt-1)/(Yt - Yt- 1))*100
Note: Data from 2011-12 onwards are on 2011-12 base year prices, while earlier are on 2004-05 prices.
Source: CSO. |
| A3: Statistical Discrepancy in Quarterly GDP at current prices (contd.) | | Year | Quarter | GDP at market prices
(₹ billion) | Discrepancies
(₹ billion) | GDP Growth (%) | Share of SDs in GDP (%) | Contribution to GDP Growth* | | 1 | 2 | 3 | 4 | 5 | 6 | 7 | | 1997-98 | Q1 | 3530.2 | 97.5 | 11.3 | 2.8 | -9.0 | | | Q2 | 3326.6 | 91.8 | 10.6 | 2.8 | -9.8 | | | Q3 | 4129.3 | 114.0 | 9.6 | 2.8 | -11.0 | | | Q4 | 4285.6 | 118.3 | 11.6 | 2.8 | -8.6 | | 1998-99 | Q1 | 3991.8 | 108.2 | 13.1 | 2.7 | 2.3 | | | Q2 | 3900.9 | 105.7 | 17.3 | 2.7 | 2.4 | | | Q3 | 4801.9 | 130.1 | 16.3 | 2.7 | 2.4 | | | Q4 | 4817.5 | 130.5 | 12.4 | 2.7 | 2.3 | | 1999-00 | Q1 | 4523.2 | -57.3 | 13.3 | -1.3 | -31.1 | | | Q2 | 4361.8 | -143.4 | 11.8 | -3.3 | -54.0 | | | Q3 | 5239.4 | -62.2 | 9.1 | -1.2 | -44.0 | | | Q4 | 5396.0 | 4.3 | 12.0 | 0.1 | -21.8 | | 2000-01 | Q1 | 4935.0 | 124.0 | 9.1 | 2.5 | 44.0 | | | Q2 | 4794.6 | 52.7 | 9.9 | 1.1 | 45.3 | | | Q3 | 5633.5 | 38.6 | 7.5 | 0.7 | 25.6 | | | Q4 | 5660.0 | -121.9 | 4.9 | -2.2 | -47.8 | | 2001-02 | Q1 | 5309.1 | 89.4 | 7.6 | 1.7 | -9.2 | | | Q2 | 5197.5 | 109.6 | 8.4 | 2.1 | 14.1 | | | Q3 | 6154.6 | -47.2 | 9.2 | -0.8 | -16.5 | | | Q4 | 6128.3 | -159.6 | 8.3 | -2.6 | -8.0 | | 2002-03 | Q1 | 5744.5 | 199.9 | 8.2 | 3.5 | 25.4 | | | Q2 | 5683.8 | 115.0 | 9.4 | 2.0 | 1.1 | | | Q3 | 6505.9 | -88.5 | 5.7 | -1.4 | -11.7 | | | Q4 | 6611.4 | -48.0 | 7.9 | -0.7 | 23.1 | | 2003-04 | Q1 | 6287.0 | 179.0 | 9.4 | 2.8 | -3.9 | | | Q2 | 6315.4 | -55.1 | 11.1 | -0.9 | -26.9 | | | Q3 | 7481.1 | 135.0 | 15.0 | 1.8 | 22.9 | | | Q4 | 7462.8 | 1.9 | 12.9 | 0.0 | 5.9 |
| A3: Statistical Discrepancy in Quarterly GDP at current prices (contd.) | | Year | Quarter | GDP at market prices
(₹ billion) | Discrepancies
(₹ billion) | GDP Growth (%) | Share of SDs in GDP (%) | Contribution to GDP Growth* | | 1 | 2 | 3 | 4 | 5 | 6 | 7 | | 2004-05 | Q1 | 7353.6 | -117.4 | 17.0 | -1.6 | -28.2 | | | Q2 | 7599.4 | 72.9 | 20.3 | 1.0 | 20.9 | | | Q3 | 8575.6 | 99.4 | 14.6 | 1.2 | 13.9 | | | Q4 | 8893.5 | -306.4 | 19.2 | -3.4 | -4.5 | | 2005-06 | Q1 | 8369.9 | 150.3 | 13.8 | 1.8 | 26.3 | | | Q2 | 8553.4 | -101.7 | 12.6 | -1.2 | -18.3 | | | Q3 | 9762.3 | -169.3 | 13.8 | -1.7 | -22.6 | | | Q4 | 10248.2 | -135.7 | 15.2 | -1.3 | 12.6 | | 2006-07 | Q1 | 9522.6 | -268.9 | 13.8 | -2.8 | -36.4 | | | Q2 | 10041.6 | 56.1 | 17.4 | 0.6 | 10.6 | | | Q3 | 11393.1 | 28.0 | 16.7 | 0.2 | 12.1 | | | Q4 | 11989.8 | -118.8 | 17.0 | -1.0 | 1.0 | | 2007-08 | Q1 | 11264.8 | -319.7 | 18.3 | -2.8 | -2.9 | | | Q2 | 11508.0 | -377.9 | 14.6 | -3.3 | -29.6 | | | Q3 | 13216.5 | -61.0 | 16.0 | -0.5 | -4.9 | | | Q4 | 13881.6 | 126.1 | 15.8 | 0.9 | 12.9 | | 2008-09 | Q1 | 13334.6 | 130.9 | 18.4 | 1.0 | 21.8 | | | Q2 | 13661.8 | 571.8 | 18.7 | 4.2 | 44.1 | | | Q3 | 14652.9 | -296.9 | 10.9 | -2.0 | -16.4 | | | Q4 | 14651.3 | 100.4 | 5.5 | 0.7 | -3.3 | | 2009-10 | Q1 | 14326.5 | -280.4 | 7.4 | -2.0 | -41.5 | | | Q2 | 14976.5 | -449.1 | 9.6 | -3.0 | -77.7 | | | Q3 | 17004.9 | -216.1 | 16.1 | -1.3 | 3.4 | | | Q4 | 18470.5 | 907.6 | 26.1 | 4.9 | 21.1 | | 2010-11 | Q1 | 17441.8 | 185.9 | 21.7 | 1.1 | 15.0 | | | Q2 | 17869.8 | -323.8 | 19.3 | -1.8 | 4.3 | | | Q3 | 20451.6 | -243.1 | 20.3 | -1.2 | -0.8 | | | Q4 | 22078.0 | 683.4 | 19.5 | 3.1 | -6.2 |
| A3: Statistical Discrepancy in Quarterly GDP at current prices (concld.) | | Year | Quarter | GDP at market prices
(₹ billion) | Discrepancies
(₹ billion) | GDP Growth (%) | Share of SDs in GDP (%) | Contribution to GDP Growth* | | 1 | 2 | 3 | 4 | 5 | 6 | 7 | | 2011-12 | Q1 | 20435.0 | -43.8 | 18.6 | -0.2 | -4.8 | | | Q2 | 20294.7 | -495.3 | 16.7 | -2.4 | 1.4 | | | Q3 | 22448.5 | 335.5 | 15.2 | 1.5 | 17.5 | | | Q4 | 24185.1 | -92.6 | 13.2 | -0.4 | 21.2 | | 2012-13 | Q1 | 22977.4 | 135.3 | 12.4 | 0.6 | 7.0 | | | Q2 | 24201.9 | -353.6 | 19.3 | -1.5 | 3.6 | | | Q3 | 25207.2 | 986.7 | 12.3 | 3.9 | 23.6 | | | Q4 | 27053.6 | 457.3 | 11.9 | 1.7 | 19.2 | | 2013-14 | Q1 | 25495.2 | -80.0 | 11.0 | -0.3 | -8.6 | | | Q2 | 27542.1 | 551.6 | 13.8 | 2.0 | 27.1 | | | Q3 | 28893.2 | 100.7 | 14.6 | 0.3 | -24.0 | | | Q4 | 30404.8 | 571.6 | 12.4 | 1.9 | 3.4 | | 2014-15 | Q1 | 29135.9 | -1092.0 | 14.3 | -3.7 | -27.8 | | | Q2 | 30565.8 | -463.7 | 11.0 | -1.5 | -33.6 | | | Q3 | 31753.3 | 795.1 | 9.9 | 2.5 | 24.3 | | | Q4 | 32996.3 | 602.3 | 8.5 | 1.8 | 1.2 | | 2015-16 | Q1 | 32202.8 | 281.7 | 10.5 | 0.9 | 44.8 | | | Q2 | 33264.7 | 381.4 | 8.8 | 1.1 | 31.3 | | | Q3 | 34444.8 | 115.2 | 8.5 | 0.3 | -25.3 | | | Q4 | 36908.0 | 747.2 | 11.9 | 2.0 | 3.7 | | 2016-17 | Q1 | 35549.4 | -175.1 | 10.4 | -0.5 | -13.6 | | | Q2 | 36757.9 | -44.1 | 10.5 | -0.1 | -12.2 | | | Q3 | 38020.4 | -554.2 | 10.4 | -1.5 | -18.7 | | | Q4 | 41509.5 | 1742.2 | 12.5 | 4.2 | 21.6 | | 2017-18 | Q1 | 38837.8 | 286.7 | 9.3 | 0.7 | 14.0 | | | Q2 | 40223.4 | 548.7 | 9.4 | 1.4 | 17.1 | *: Contribution to GDP growth= ((SDt - SDt-1)/(Yt - Yt-1))*100
Note: Data from 1997-98 to 2003-04 are on 1999-00 base year, 2004-05 to 2010-11 are on 2004-05 base year and 2011-12 onwards are on 2001-12 base year.
Source: CSO. |
| A4: Statistical Discrepancy in Quarterly GDP at constant prices (contd.) | | Year | Quarter | GDP at market prices
(₹ billion) | Discrepancies
(₹ billion) | GDP Growth (%) | Share of SDs in GDP (%) | Contribution to GDP Growth* | | 1 | 2 | 3 | 4 | 5 | 6 | 7 | | 1997-98 | Q1 | 4011.3 | 99.4 | 3.3 | 2.5 | -18.5 | | | Q2 | 3755.2 | 93.1 | 4.8 | 2.5 | -11.7 | | | Q3 | 4616.5 | 114.4 | 3.5 | 2.5 | -16.9 | | | Q4 | 4734.4 | 117.3 | 4.6 | 2.5 | -12.3 | | 1998-99 | Q1 | 4265.4 | 141.5 | 6.3 | 3.3 | 16.6 | | | Q2 | 4048.4 | 134.3 | 7.8 | 3.3 | 14.1 | | | Q3 | 4870.5 | 161.6 | 5.5 | 3.3 | 18.6 | | | Q4 | 4993.2 | 165.7 | 5.5 | 3.3 | 18.7 | | 1999-00 | Q1 | 4596.6 | -186.1 | 7.8 | -4.0 | -98.9 | | | Q2 | 4368.0 | -83.9 | 7.9 | -1.9 | -68.3 | | | Q3 | 5200.3 | 1.5 | 6.8 | 0.0 | -48.6 | | | Q4 | 5355.5 | 9.8 | 7.3 | 0.2 | -43.0 | | 2000-01 | Q1 | 4837.5 | -15.8 | 5.2 | -0.3 | 70.7 | | | Q2 | 4657.8 | 132.6 | 6.6 | 2.8 | 74.7 | | | Q3 | 5397.8 | 64.5 | 3.8 | 1.2 | 31.9 | | | Q4 | 5414.0 | -156.4 | 1.1 | -2.9 | -284.1 | | 2001-02 | Q1 | 5023.1 | -98.3 | 3.8 | -2.0 | -44.4 | | | Q2 | 4860.7 | 204.1 | 4.4 | 4.2 | 35.2 | | | Q3 | 5737.4 | 37.2 | 6.3 | 0.6 | -8.0 | | | Q4 | 5745.3 | -97.8 | 6.1 | -1.7 | 17.7 | | 2002-03 | Q1 | 5277.8 | -91.2 | 5.1 | -1.7 | 2.8 | | | Q2 | 5120.5 | 106.3 | 5.3 | 2.1 | -37.6 | | | Q3 | 5850.6 | -140.3 | 2.0 | -2.4 | -156.8 | | | Q4 | 5922.6 | -177.0 | 3.1 | -3.0 | -44.7 | | 2003-04 | Q1 | 5536.5 | -68.9 | 4.9 | -1.2 | 8.6 | | | Q2 | 5535.2 | 28.6 | 8.1 | 0.5 | -18.7 | | | Q3 | 6506.7 | 100.8 | 11.2 | 1.5 | 36.7 | | | Q4 | 6448.8 | -76.9 | 8.9 | -1.2 | 19.0 |
| A4: Statistical Discrepancy in Quarterly GDP at constant prices (contd.) | | Year | Quarter | GDP at market prices
(₹ billion) | Discrepancies
(₹ billion) | GDP Growth (%) | Share of SDs in GDP (%) | Contribution to GDP Growth* | | 1 | 2 | 3 | 4 | 5 | 6 | 7 | | 2004-05 | Q1 | 7500.4 | -129.3 | 8.3 | -1.7 | -81.0 | | | Q2 | 7580.8 | 57.4 | 8.8 | 0.8 | 3.2 | | | Q3 | 8503.9 | 87.0 | 5.9 | 1.0 | -17.8 | | | Q4 | 8837.0 | -266.7 | 10.3 | -3.0 | -20.8 | | 2005-06 | Q1 | 8192.3 | 105.1 | 9.2 | 1.3 | 33.9 | | | Q2 | 8220.9 | -147.2 | 8.4 | -1.8 | -32.0 | | | Q3 | 9267.0 | -197.6 | 9.0 | -2.1 | -37.3 | | | Q4 | 9752.3 | -133.2 | 10.4 | -1.4 | 14.6 | | 2006-07 | Q1 | 8799.0 | -313.7 | 7.4 | -3.6 | -69.0 | | | Q2 | 9062.7 | -30.2 | 10.2 | -0.3 | 13.9 | | | Q3 | 10145.2 | -49.0 | 9.5 | -0.5 | 16.9 | | | Q4 | 10708.0 | -157.1 | 9.8 | -1.5 | -2.5 | | 2007-08 | Q1 | 9750.1 | -465.1 | 10.8 | -4.8 | -15.9 | | | Q2 | 9891.0 | -410.1 | 9.1 | -4.1 | -45.9 | | | Q3 | 11215.3 | -210.9 | 10.5 | -1.9 | -15.1 | | | Q4 | 11653.1 | -78.7 | 8.8 | -0.7 | 8.3 | | 2008-09 | Q1 | 10538.3 | -308.2 | 8.1 | -2.9 | 19.9 | | | Q2 | 10557.2 | 171.0 | 6.7 | 1.6 | 87.2 | | | Q3 | 11387.4 | -351.9 | 1.5 | -3.1 | -81.9 | | | Q4 | 11680.6 | 201.3 | 0.2 | 1.7 | 1018.4 | | 2009-10 | Q1 | 11064.6 | -447.1 | 5.0 | -4.0 | -26.4 | | | Q2 | 11291.8 | -534.3 | 7.0 | -4.7 | -96.0 | | | Q3 | 12322.4 | -423.5 | 8.2 | -3.4 | -7.7 | | | Q4 | 13229.6 | 374.2 | 13.3 | 2.8 | 11.2 | | 2010-11 | Q1 | 12203.5 | -126.7 | 10.3 | -1.0 | 28.1 | | | Q2 | 12384.8 | -444.5 | 9.7 | -3.6 | 8.2 | | | Q3 | 13639.8 | -810.9 | 10.7 | -5.9 | -29.4 | | | Q4 | 14595.7 | -98.3 | 10.3 | -0.7 | -34.6 |
| A4: Statistical Discrepancy in Quarterly GDP at constant prices (concld.) | | Year | Quarter | GDP at market prices
(₹ billion) | Discrepancies
(₹ billion) | GDP Growth (%) | Share of SDs in GDP (%) | Contribution to GDP Growth* | | 1 | 2 | 3 | 4 | 5 | 6 | 7 | | 2011-12 | Q1 | 21028.6 | -103.6 | 8.3 | -3.6 | -34.8 | | | Q2 | 20428.7 | -504.4 | 6.7 | -3.8 | -7.5 | | | Q3 | 22251.4 | 383.4 | 6.2 | -3.4 | 38.2 | | | Q4 | 23654.6 | -71.6 | 5.6 | 1.8 | 45.4 | | 2012-13 | Q1 | 22052.2 | 168.0 | 4.9 | 0.8 | 26.5 | | | Q2 | 21959.5 | -1156.7 | 7.5 | -5.3 | -42.6 | | | Q3 | 23447.7 | 1128.8 | 5.4 | 4.8 | 62.3 | | | Q4 | 24670.8 | 276.2 | 4.3 | 1.1 | 34.2 | | 2013-14 | Q1 | 23474.0 | 91.3 | 6.4 | 0.4 | -5.4 | | | Q2 | 23570.8 | -391.4 | 7.3 | -1.7 | 47.5 | | | Q3 | 24980.0 | -5.5 | 6.5 | 0.0 | -74.0 | | | Q4 | 25989.0 | -25.1 | 5.3 | -0.1 | -22.9 | | 2014-15 | Q1 | 25337.9 | -548.2 | 7.9 | -2.2 | -34.3 | | | Q2 | 25647.5 | -381.0 | 8.8 | -1.5 | 0.5 | | | Q3 | 26506.7 | 338.4 | 6.1 | 1.3 | 22.5 | | | Q4 | 27877.7 | 145.3 | 7.3 | 0.5 | 9.0 | | 2015-16 | Q1 | 27258.7 | 693.6 | 7.6 | 2.5 | 64.6 | | | Q2 | 27701.0 | 532.1 | 8.0 | 1.9 | 44.5 | | | Q3 | 28427.4 | 151.6 | 7.2 | 0.5 | -9.7 | | | Q4 | 30422.9 | 300.8 | 9.1 | 1.0 | 6.1 | | 2016-17 | Q1 | 29418.5 | 376.0 | 7.9 | 1.3 | -14.7 | | | Q2 | 29788.2 | 365.8 | 7.5 | 1.2 | -8.0 | | | Q3 | 30407.6 | -409.8 | 7.0 | -1.3 | -28.3 | | | Q4 | 32284.3 | 506.9 | 6.1 | 1.6 | 11.1 | | 2017-18 | Q1 | 31101.5 | 330.5 | 5.7 | 1.1 | -2.7 | | | Q2 | 31656.6 | 592.7 | 6.3 | 1.9 | 12.1 | *: Contribution to GDP growth= ((SDt - SDt-1)/(Yt - Yt-1))*100
Note: Data from 1997-98 to 2003-04 are on 1999-00 base year, 2004-05 to 2010-11 are on 2004-05 base year and 2011-12 onwards are on 2001-12 base year.
Source: CSO. |
|