This article analyses the results of four quarterly rounds of the inflation expectations survey of households that were conducted during 2017-18. The analysis suggests that households’ inflation expectations are largely adaptive, but use of information on inflation expectations for forecasting inflation can improve efficiency in terms of narrowing the confidence band. The study of dispersion in individual survey responses also provides additional information on the expected build-up of inflationary pressure. Introduction Inflation expectations are views of economic agents on future price developments. Accordingly, gauges of how people expect inflation to evolve provide important inputs for the conduct of monetary policy, especially in an inflation targeting framework. The Reserve Bank of India (RBI) has been conducting its Inflation Expectations Survey of Households (IESH) since September 2005, widening its coverage and bringing in methodological improvements, including in sampling design1, over the ensuing years (Annex 1). The survey elicits qualitative and quantitative responses from households regarding their expectations on changes in price levels and inflation three months ahead as well as a year ahead2. At the time when this article went to print, the survey is being conducted in 18 cities and covers a sample of about 5,500 households in each round3. So, how did households anticipate that prices and inflation would form in 2017-18? This article accumulates and analyses the results of four quarterly rounds of the survey that were conducted during the year in Section II. Households’ inflations expectations are benchmarked against movements in the Consumer Price Index-Urban (CPI-U) in order to evaluate lead tracking performance by hindsight in Section III. As individual responses tend to be heterogeneous, an attempt to measure the level of disagreement in qualitative and quantitative expectations is presented in Section IV. Section V summarizes the article and offers some policy perspectives. II. Drilling Down into Households’ Minds Inflation expectations of households remained elevated in 2017-18 in relation to a year ago. The proportion of respondents expecting general prices to rise three months ahead and a year ahead picked up in Q2:2017-18 and ruled above the preceding year’s level through Q4:2017-18. More than 80 per cent of households expected prices to rise on a year-on-year basis in each round, with an inflexion point located in Q2 as stated earlier in terms of higher percentage of respondents expecting prices to increase at more than the current rate (Chart 1 and 2). Qualitative responses on product group price expectations revealed that after a sharp correction in Q3:2016-17, households firmed up their expectations gradually through 2017-18. Although there was some moderation in respect of prices of food items, household durables, housing and services in Q4:2017-18, the proportion of respondents expecting prices to rise at more than the current rate was higher in Q4:2017-18 than a year ago. In terms of quantitative responses, households’ median inflation expectations ranged between 7.2 per cent and 7.8 per cent for the three months ahead period, and between 8.0 per cent and 8.6 per cent, for the one year ahead period. Median inflation expectations polled a record low in the survey’s history in Q2:2017- 18, barring the global financial crisis period. Compared with the corresponding period of 2016-17, median inflation expectations fell by 230 and 340 basis points for the three months ahead and one year ahead, respectively, in Q2:2017-18. Thereafter, inflation expectations inched up as households’ perceptions on current inflation hardened (Chart 3). 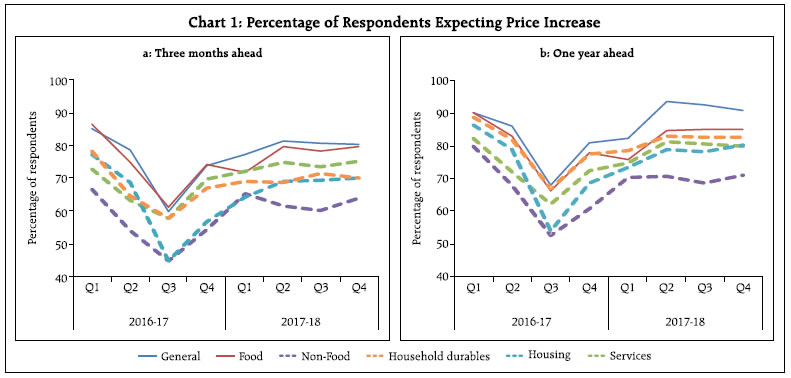 Among the cities covered in the survey, respondents in Bengaluru were relatively optimistic in their inflation expectations, whereas respondents in Bhubaneshwar, Chennai, Guwahati and Kolkata were the most pessimistic, polling double-digit inflation expectations for the one year horizon throughout 2017-18. Daily workers, retired persons, homemakers and other employees polled higher median inflation expectations than financial sector employees. The bootstrap confidence intervals (99 per cent) for mean inflation expectations4 were reasonably small with a width of 0.30. This indicates that estimates from the survey are quite robust with respect to the choice of sample (Annex 2 - Table 8).
III. Do Urban Households Anticipate or Adapt? IESH collects opinions of respondents on changes in prices and also on their rates of change. It is observed that there is reasonably strong correlation (0.6) between respondents’ expectations on the price levels and movements in changes in price index (CPI-U). This correlation weakens (0.2), however, when inflation expectations of households are tracked against changes in the actual CPI-U inflation. More generally, the larger the change in CPI-U, the higher is the proportion of respondents expecting prices to increase in the future. Diving down into specific aspects of co-movement between near-term expectations on the price level and actual outcomes in terms of change in the CPI-U, it is noteworthy that three months ahead expectations on changes in the general price level tracked quarter-on-quarter (Q-o-Q) change in the CPI-U up to Q2:2017-18 reasonably well. Thereafter, the unusual plunge in the Q-o-Q change in CPI-U in the second half of 2017-18 was not fully reflected in households’ expectations. Similarly, one year ahead expectations on changes in price levels tracked year-on-year (Y-o-Y) changes in the CPI-U index, except in Q1:2017-18 (Chart 4a and 5a). The correlation between households’ expectations on the rate of price change and change in (urban) retail inflation was however weaker. As inflation shot up sharply from Q1:2017-18 to Q2:2017-18, the proportion of respondents expecting prices to rise at a faster rate in the next three months also rose from 39.1 per cent to 47.5 per cent (Chart 4b). As the pace of rise in inflation moderated in the next two quarters, that proportion fell in tandem. Similar co-movement was observed in the yearly change in urban inflation and the proportion of respondents expecting prices to rise at a faster rate in the next one year. This suggests that households’ inflation expectations are largely adaptive in nature. In view of the foregoing, it is useful to investigate whether the incorporation of households’ mean inflation expectations can improve inflation projections in a Bayesian framework thereby attesting their forward looking behavior. It has been shown that modelling households’ inflation expectations as a function of past inflation, the inflation target and a measure of probability that the target will be achieved – the credibility of monetary policy – can help to evaluate if households’ expectations are efficient or rational and, therefore, useful inputs into forecasting frameworks (Batchelor in Sinclair’s edited, 2010). This framework can be exploited to derive the posterior distribution of inflation, and the mean value from the posterior distribution can be used as a forecast of inflation. 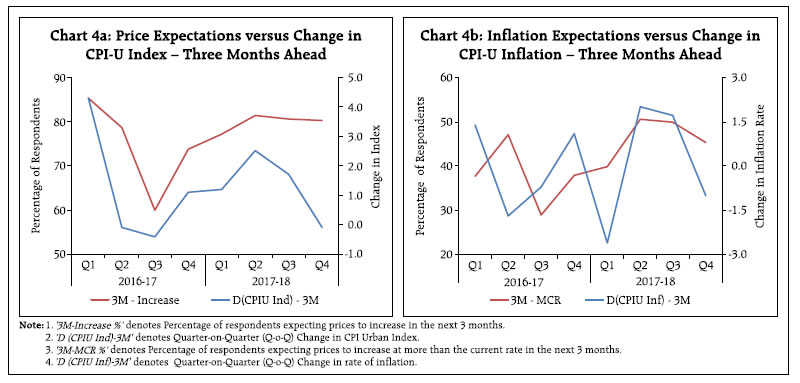 A comparison with forecasts based on a simple univariate time-series model [ARIMA (1, 1, 2)] reveals that although gains in terms of forecast accuracy are limited, the 95 per cent confidence bands around the Bayesian forecasts are narrower (67 basis points) than for the ARIMA forecasts (286 basis points), indicative of efficiency gains (Chart 6 and 7).
IV. Measuring Disagreement While the results of the household surveys on inflation expectations are usually reported through an average (mean or median), there is a growing literature which suggests that the dispersion in individual responses also have considerable information content. Inflation expectations among households differ due to differences in the consumption baskets and income levels as well as dissimilarities in the information that households refer to at the time of expectations formation (Mokinski et al., 2015; Drager and Lamla, 2015). In an attempt to measure the extent of disagreement among the respondents of the IESH in the recent period, disagreement in quantitative responses are measured through the coefficient of variation (CV) while for the qualitative responses, disagreement is measured through an index of qualitative variation (IQV) (details are in Annex 3). An IQV closer to zero indicates greater consensus in respondents’ views on future price movements and its value rises as the views become more divergent. 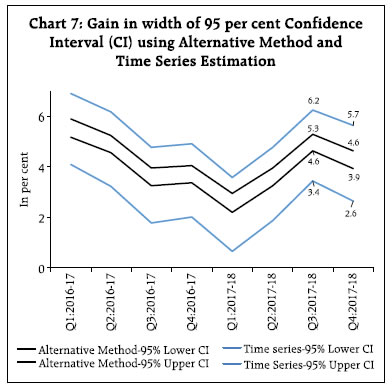 In general, disagreement levels are lower for the three months ahead period than for the one year ahead horizon (Charts 8 and 9), implying greater consensus in the formation of nearer term expectations. Further, when CPI-U inflation prints are at an elevated level, qualitative disagreement in expectations are low and stable. In contrast, when inflation are on a declining trajectory, respondents expressed more divergent views. This could be due to the fact that all households are sensitive to a rise in inflation, whereas some households tend to discount declines as a temporary phenomenon. A similar pattern is observed in respect of quantitative disagreement, but the extent of variation was relatively less. V. Summary Households’ inflation expectations, both in qualitative and quantitative terms, remained elevated in 2017-18 and were largely adaptive. Occasional lack of co-movement between inflation expectations of households and CPI-U inflation largely reflected the volatility in food inflation – particularly sharp decline in food inflation in some months during 2017-18 – which did not pull inflation expectations down as households might have perceived them as temporary. Quantitative responses from the IESH may not help much in projecting the headline CPI-Urban inflation number but they could reduce the forecast band. Besides average level of inflation expectations, there is some merit in looking at the extent of disagreement among the respondents of the IESH as it may foretell building up of an inflationary pressure.
References: 1. Dräger, L. and Lamla, M.J. (2015), “Disagreement à la Taylor: Evidence from Survey Microdata”, KOF Working Paper. 2. Mokinski, F., Sheng, X. and Yang, J. (2015), “Measuring disagreement in qualitative expectations”, Journal of Forecasting, 34: 405–426. 3. Batchelor, R. “How robust are quantified survey data?” in Sinclair, P.J.N, “Inflation Expectations”, Ed. (2010), 8-33, Routledge, Taylor & Francis.
Annex 1 Inflation Expectations Survey of Households - Sample Coverage and Survey Schedule The quarterly rounds of the survey were conducted in 18 cities covering a sample size of 5500 households in each round, with 500 households each from four metropolitan cities, viz., Delhi, Kolkata, Mumbai and Chennai, and 250 households each from fourteen major cities viz., Ahmedabad, Bengaluru, Bhopal, Bhubaneswar, Chandigarh, Guwahati, Hyderabad, Jaipur, Lucknow, Nagpur, Patna, Raipur, Ranchi, and Thiruvananthapuram5. Inconsistent responses are excluded from the analysis. The survey schedule of IESH is organised into four blocks. Block 1 collects information on respondent’s profile like name, gender, age, category of respondent, etc. Blocks 2 and 3 capture qualitative responses on price expectations for general and various product groups, for three months and one year ahead, respectively, wherein, the respondent’s price expectations are captured using five options, viz., (i) price increase more than current rate, (ii) price increase similar to current rate, (iii) price increase less than current rate, (iv) no change in prices, and (v) decline in prices. Block 4 collects quantitative response on current and expected inflation rates for three months ahead and one year ahead periods, wherein, the inflation rate ranges from ‘less than 1 per cent’ to ‘16 per cent and above’, with intermediate class intervals of size 100 basis points.
Annex 2 – Tables | Table 1: Cross-tabulation of General Price Expectations for Three-month Ahead and One-Year Ahead Q1: 2017-18 | | One Year Ahead | Three-month Ahead | | | Price increase more than current rate | Price increase similar to current rate | Price increase less than current rate | No change in prices | Decline in prices | Total | | Price increase more than current rate | 33.6 | 4.9 | 1.0 | 3.9 | 0.6 | 44.1 | | Price increase similar to current rate | 3.5 | 18.2 | 2.2 | 3.8 | 0.5 | 28.2 | | Price increase less than current rate | 0.5 | 1.4 | 6.3 | 1.5 | 0.4 | 10.1 | | No change in prices | 1.4 | 1.6 | 0.8 | 6.2 | 1.2 | 11.2 | | Decline in prices | 0.8 | 0.5 | 0.4 | 1.3 | 3.3 | 6.4 | | Total | 39.9 | 26.6 | 10.7 | 16.8 | 6.0 | 100.0 | General price expectations for one year ahead dependent on general price expectations for three months ahead at 5 per cent level of significance, across the study period (Table 1-4) | Table 2: Cross-tabulation of General Price Expectations for Three-month Ahead and One-year Ahead Q2: 2017-18 | | One Year Ahead | Three-month Ahead | | | Price increase more than current rate | Price increase similar to current rate | Price increase less than current rate | No change in prices | Decline in prices | Total | | Price increase more than current rate | 46.0 | 6.8 | 1.0 | 6.7 | 0.6 | 61.2 | | Price increase similar to current rate | 3.5 | 16.8 | 1.5 | 5.2 | 0.3 | 27.3 | | Price increase less than current rate | 0.5 | 0.7 | 2.5 | 1.1 | 0.2 | 5.0 | | No change in prices | 0.3 | 0.8 | 0.2 | 2.3 | 0.4 | 4.1 | | Decline in prices | 0.2 | 0.3 | 0.2 | 0.5 | 1.3 | 2.5 | | Total | 50.5 | 25.4 | 5.4 | 15.8 | 2.9 | 100.0 |
| Table 3: Cross-tabulation of General Price Expectations for Three-month Ahead and One-year Ahead Q3: 2017-18 | | One Year Ahead | Three-month Ahead | | | Price increase more than current rate | Price increase similar to current rate | Price increase less than current rate | No change in prices | Decline in prices | Total | | Price increase more than current rate | 45.8 | 7.6 | 1.6 | 7.6 | 0.4 | 63.0 | | Price increase similar to current rate | 2.9 | 14.8 | 1.2 | 4.8 | 0.2 | 23.9 | | Price increase less than current rate | 0.5 | 0.8 | 3.1 | 1.3 | 0.2 | 5.8 | | No change in prices | 0.5 | 1.0 | 0.2 | 3.2 | 0.3 | 5.3 | | Decline in prices | 0.2 | 0.3 | 0.2 | 0.6 | 0.8 | 2.0 | | Total | 49.8 | 24.6 | 6.1 | 17.4 | 2.0 | 100.0 |
| Table 4: Cross-tabulation of General Price Expectations for Three-month Ahead and One-year Ahead Q4: 2017-18 | | One Year Ahead | Three-month Ahead | | | Price increase more than current rate | Price increase similar to current rate | Price increase less than current rate | No change in prices | Decline in prices | Total | | Price increase more than current rate | 40.6 | 7.4 | 1.4 | 7.0 | 0.3 | 56.7 | | Price increase similar to current rate | 3.1 | 17.6 | 1.8 | 5.1 | 0.2 | 28.0 | | Price increase less than current rate | 0.3 | 0.9 | 3.8 | 1.1 | 0.1 | 6.2 | | No change in prices | 1.2 | 1.1 | 0.3 | 3.9 | 0.5 | 7.0 | | Decline in prices | 0.2 | 0.2 | 0.2 | 0.5 | 1.1 | 2.2 | | Total | 45.4 | 27.2 | 7.5 | 17.8 | 2.1 | 100.0 |
| Table 5: Distribution of Inflation Rate – Perceptions and Expectations (2017-18) | | (in per cent) | | Inflation Rate | Current | Three Months ahead | One Year ahead | | Q1 | Q2 | Q3 | Q4 | Q1 | Q2 | Q3 | Q4 | Q1 | Q2 | Q3 | Q4 | | <1 | 1.7 | 0.6 | 0.9 | 0.7 | 1.5 | 1.5 | 2.0 | 1.7 | 1.3 | 6.4 | 7.8 | 9.5 | | 1-2 | 2.0 | 1.1 | 1.4 | 0.8 | 1.9 | 0.9 | 1.3 | 0.9 | 1.3 | 0.3 | 0.5 | 0.6 | | 2-3 | 5.2 | 4.6 | 5.3 | 4.2 | 4.7 | 3.5 | 3.7 | 3.5 | 3.4 | 2.2 | 2.0 | 1.8 | | 3-4 | 7.3 | 5.0 | 7.5 | 4.8 | 5.9 | 4.6 | 6.2 | 3.9 | 4.4 | 2.6 | 3.5 | 2.5 | | 4-5 | 8.2 | 8.4 | 9.1 | 6.1 | 5.6 | 6.7 | 8.3 | 6.0 | 5.1 | 4.6 | 6.4 | 4.0 | | 5-6 | 21.4 | 27.6 | 19.5 | 21.8 | 12.4 | 16.3 | 13.8 | 16 | 9.5 | 12.1 | 10.2 | 10.9 | | 6-7 | 11.1 | 11.0 | 8.5 | 9.7 | 11.0 | 13.6 | 9.5 | 9.1 | 7.7 | 9.5 | 7.2 | 6.8 | | 7-8 | 8.6 | 9.1 | 8.8 | 9.8 | 13.7 | 13.0 | 10.9 | 11.1 | 10.7 | 12.5 | 8.6 | 9.1 | | 8-9 | 7.2 | 6.6 | 6.4 | 7.1 | 9.9 | 8.0 | 7.8 | 8.3 | 10.5 | 10.3 | 8.1 | 7.7 | | 9-10 | 3.2 | 2.5 | 3.7 | 4.3 | 5.6 | 4.0 | 4.7 | 5.5 | 6.9 | 5.5 | 6.0 | 5.8 | | 10-11 | 11.8 | 9.1 | 12.6 | 14.3 | 8.9 | 9.1 | 9.5 | 11.7 | 13.1 | 9.7 | 11.6 | 13.7 | | 11-12 | 1.6 | 1.3 | 1.0 | 1.6 | 2.5 | 1.7 | 2.2 | 2.3 | 3.5 | 2.0 | 2.5 | 3.2 | | 12-13 | 1.2 | 0.7 | 0.9 | 1.6 | 4.2 | 2.7 | 3.3 | 3.5 | 4.5 | 3.3 | 3.8 | 4.2 | | 13-14 | 0.4 | 0.4 | 0.3 | 0.4 | 1.1 | 1.0 | 1.2 | 1.4 | 1.7 | 1.2 | 1.1 | 1.2 | | 14-15 | 0.3 | 0.8 | 0.5 | 0.6 | 0.6 | 0.7 | 0.6 | 0.9 | 1.4 | 1.4 | 1.3 | 1.2 | | 15-16 | 2.6 | 2.0 | 2.8 | 2.8 | 3.6 | 2.9 | 3.8 | 4.1 | 5.5 | 4.1 | 4.9 | 5.1 | | >=16 | 6.2 | 9.2 | 10.8 | 9.4 | 6.7 | 9.6 | 11.1 | 10 | 9.4 | 12.2 | 14.5 | 12.8 | | Total | 100.0 | 100.0 | 100.0 | 100.0 | 100.0 | 100.0 | 100.0 | 100.0 | 100.0 | 100.0 | 100.0 | 100.0 |
| Table 6: Inflation Rate – Mean, Median and Std. Dev. | | Quarter | Current | Expectation | | Three Months Ahead | One Year Ahead | | Mean | Median | SD | Mean | Median | SD | Mean | Median | SD | | Q1:2016-17 | 8.8 | 8.0 | 4.4 | 9.7 | 9.2 | 4.4 | 10.0 | 9.6 | 4.7 | | Q2:2016-17 | 9.2 | 8.7 | 4.0 | 9.7 | 9.5 | 4.4 | 11.6 | 11.4 | 3.9 | | Q3:2016-17 | 7.4 | 6.5 | 3.9 | 7.9 | 7.3 | 4.1 | 8.7 | 8.3 | 4.3 | | Q4:2016-17 | 7.8 | 6.8 | 4.0 | 8.2 | 7.5 | 4.1 | 9.3 | 8.8 | 4.2 | | Q1:2017-18 | 7.3 | 6.4 | 3.8 | 8.1 | 7.5 | 3.9 | 9.1 | 8.6 | 4.1 | | Q2:2017-18 | 7.6 | 6.3 | 3.9 | 8.2 | 7.2 | 4.0 | 8.7 | 8.0 | 4.5 | | Q3:2017-18 | 7.9 | 6.7 | 4.2 | 8.4 | 7.5 | 4.3 | 8.9 | 8.5 | 4.8 | | Q4:2017-18 | 8.2 | 7.2 | 4.0 | 8.6 | 7.8 | 4.1 | 8.9 | 8.6 | 4.7 |
| Table 7: City-wise Median Inflation Perceptions and Expectations | | City | Current | Three Months ahead | One Year ahead | | Q1 | Q2 | Q3 | Q4 | Q1 | Q2 | Q3 | Q4 | Q1 | Q2 | Q3 | Q4 | | Ahmadabad | 7.6 | 7.4 | 10.1 | 8.9 | 8.3 | 9.2 | 10.4 | 10.1 | 8.7 | 9.4 | 10.8 | 10.5 | | Bengaluru | 4.8 | 4.3 | 3.0 | 5.5 | 5.4 | 4.7 | 3.8 | 5.8 | 5.8 | 5.1 | 4.5 | 4.8 | | Bhopal | 5.5 | 6.5 | 6.9 | 5.8 | 7.9 | 7.5 | 7.4 | 5.9 | 9.7 | 6.9 | 7.8 | 5.7 | | Bhubaneswar | 6.0 | 10.1 | 6.3 | 7.7 | 8.7 | 10.8 | 8.6 | 9.1 | 10.6 | 12.5 | 10.9 | 10.8 | | Chennai | 5.9 | 8.1 | 10.3 | 7.6 | 7.5 | 10.3 | 10.9 | 9.1 | 10.6 | 12.5 | 15.0 | 11.1 | | Delhi | 5.7 | 6.1 | 6.3 | 8.1 | 6.6 | 6.5 | 6.6 | 8.0 | 7.1 | 6.5 | 6.6 | 8.4 | | Guwahati | 10.6 | 16.0 | 14.1 | 11.4 | 10.1 | 12.4 | 7.1 | 10.2 | 10.1 | 15.3 | 8.1 | 10.3 | | Hyderabad | 6.3 | 5.7 | 7.8 | 6.8 | 6.9 | 6.7 | 8.5 | 7.6 | 7.8 | 7.9 | 9.7 | 8.8 | | Jaipur | 7.9 | 5.9 | 7.4 | 7.5 | 9.0 | 6.0 | 7.6 | 6.9 | 10.7 | 6.5 | 8.4 | 7.2 | | Kolkata | 8.3 | 8.3 | 10.2 | 9.5 | 9.6 | 9.3 | 10.6 | 10.1 | 10.9 | 10.4 | 11.3 | 10.4 | | Lucknow | 5.8 | 5.8 | 6.2 | 6.3 | 7.2 | 6.7 | 6.8 | 7.0 | 7.8 | 8.1 | 7.2 | 7.5 | | Mumbai | 8.5 | 6.6 | 7.6 | 8.0 | 8.6 | 7.4 | 8.3 | 8.1 | 9.5 | 7.8 | 9.0 | 8.7 | | Nagpur | 5.0 | 6.0 | 5.9 | 5.7 | 5.7 | 6.8 | 7.2 | 7.0 | 6.7 | 7.6 | 8.0 | 7.5 | | Patna | 6.2 | 6.2 | 5.7 | 6.9 | 7.0 | 6.8 | 5.9 | 7.3 | 8.2 | 7.4 | 6.3 | 8.1 | | Trivandrum | 8.3 | 6.6 | 6.7 | 7.8 | 9.8 | 7.8 | 7.9 | 10.0 | 12.3 | 8.5 | 9.1 | 10.1 | | Chandigarh | 7.2 | 5.5 | 4.7 | 6.2 | 7.9 | 5.9 | 5.9 | 7.0 | 8.1 | 6.5 | 7.6 | 7.6 | | Ranchi | 3.4 | 5.4 | 5.3 | 6.4 | 4.0 | 5.6 | 6.3 | 7.1 | 5.5 | 6.0 | 6.3 | 7.4 | | Raipur | 5.7 | 5.5 | 5.2 | 5.4 | 7.1 | 6.1 | 5.5 | 5.7 | 7.8 | 7.1 | 6.3 | 6.8 |
| Table 8: Bootstrap Confidence Intervals (BCI) based on 10,000 Resamples - 99 Percent | | Survey Quarter | Current | Three Months ahead | One Year ahead | | BCI for Mean | Interval Width | BCI for Mean | Interval Width | BCI for Mean | Interval Width | | Q1:2017-18 | (7.21,7.48) | 0.27 | (7.94,8.23) | 0.29 | (8.90,9.21) | 0.31 | | Q2:2017-18 | (7.46,7.74) | 0.28 | (8.02,8.30) | 0.28 | (8.52,8.85) | 0.33 | | Q3:2017-18 | (7.75,8.04) | 0.29 | (8.21,8.51) | 0.3 | (8.73,9.07) | 0.34 | | Q4:2017-18 | (8.01,8.29) | 0.28 | (8.44,8.74) | 0.3 | (8.69,9.04) | 0.35 |
Annex 3 – Methodology A. Measuring Disagreement Households’ disagreement in qualitative and quantitative expectations are measured to study how well measures of disagreement in qualitative expectations reflect corresponding disagreement in quantitative expectations (Mokinski et al., 2015, Drager and Lamla, 2015). To measure the disagreement in qualitative expectations, the following three measures are used. The index of qualitative variation (IQV) is defined as: where K is the number of categories (increase, no change, decrease) and si is the percentage of responses in category i = 1 to 3. The measure is in the range (0, 1), where a value of 0 implies all the respondents chose the same option and reaches maximum when the responses of qualitative questions are distributed evenly across the three options. B. Inflation Projection 1. Information – 1: Let yit be the specific estimate of inflation of ith household/ group of respondents, for quarter ‘t’, made in the previous quarter i.e., t – 3. Let yt be the target variable, i.e., inflation at quarter ‘t’. The household-specific estimate is modelled by Batchelor in Sinclair’s edited (2010) as:
The data for this information is taken as city-wise mean of three months ahead inflation expectations, from Q1:2016-17 to Q4:2017-18. 2. Information – 2: The second information available to the households is yht, the time series prediction of target variable for quarter t. The third information is ygt, the Government policy target. Batchelor in Sinclair’s edited (2010) models the target variable as: uht being the error in prediction of target variable for quarter t. πit is the probability that the Government target will be enforced, defined as an index of the policy credibility. The probability πit differs among households/ group of respondents due to differences in individual political affiliations. The yht’s are the inflation forecasts for the period Q1:2016-17 to Q4:2017-18 based on univariate timeseries model ARIMA (1, 1, 2)6 using CPI data from January 2011 onwards. The model for ARIMA (1, 1, 2) is: where ∈t are the error terms. Since quantitative inflation expectations are collected in the form of ranges, consider, 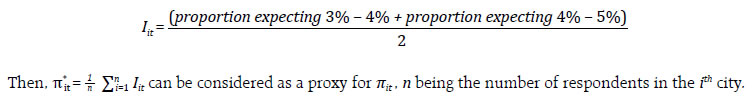
3. Information – 3: The inflation target, i.e., ygt taken as four per cent. 4. Posterior Distribution
|