This article presents the major findings of the industrial outlook survey (IOS) of the manufacturing sector conducted during 2017-18. The survey revealed a steady improvement in demand conditions with a stable outlook. The sentiments on input costs, especially of raw materials, remained a concern; leading to limited pass-through as reflected by upturn in respect of selling prices. Dynamic factor indices derived from the survey data were found to be useful in tracking the movements of the gross value added (GVA) growth and wholesale price index (WPI) inflation of the manufacturing sector. Introduction Industrial / business outlook surveys are extensively employed, particularly by central banks, to capture snapshots of sentiment on current activity conditions in a forward-looking manner so as to follow and analyse economic developments on a more frequent basis with information that has the advantage of being instantaneously accessible, never being subjected to revision (Hansson and Jansson, 2003; Kevin and Rosewall, 2015; Amstad and Etter, 2000). The Reserve Bank of India (RBI) has been an early mover among emerging market economies (EMEs) in this genre of surveys. Its flagship industrial outlook survey (IOS) goes back to 1998 and the continuum of survey rounds conducted since then yields a rich information set of 81 data conglomerations of quarterly frequency over 20 years. Aggregating the responses received, the IOS produces a business assessment index (BAI), which encapsulates current conditions and a business expectations index (BEI), which summarises the outlook for the quarter ahead. Empirically, it has been shown that the BEI has statistically significant explanatory power in explaining the behaviour of manufacturing activity in India (Lekshmi and Mall, 2015; RBI June 2017). Against this backdrop, the motivation driving this article is two-pronged. First, it seeks to consolidate and distil the key messages emanating from sentiments in the manufacturing sector in 2017-18 that were polled in four rounds of the survey conducted during the year. The focus of interest is to assess by hindsight how closely the survey reflected underlying activity in a year, marked by inflexions in the evolution of GVA in manufacturing and gross fixed capital formation alongside an acceleration in corporate sales growth and a pick-up in capacity utilisation. Second, the article attempts to bring greater precision in predicting the near-term outlook by addressing limitations of the BEI such as time-invariant weighting. Drawing on these efforts, it proposes a dynamic factor index (DFI) which improves forecasting performance in respect of the BEI, at least in nowcasting manufacturing GVA growth and manufacturing WPI inflation. The rest of the article is structured in five sections. Section 2 examines the cross-country experience in business tendency / industrial outlook surveys with a view to place the RBI’s IOS against the perspectives of international practices. Section 3 presents an overview of the stylised facts on key parameters of manufacturing conditions that were surveyed in the IOS during 2017-18. Section 4 sets out an alternative approach to forecast/ nowcast manufacturing GVA growth, with efficiency and stability gains, outperforming the BEI in predictive power. Section 5 concludes with some policy perspectives. 2. Cross-Country Practices Business tendency / sentiments / outlook / expectations surveys are regularly conducted in developed economies, including, the USA, the UK, Japan and other member countries of the Organisation for Economic Cooperation and Development (OECD), transition economies of Central / Eastern Europe and in the countries of the Asia-Pacific region. In many countries, multiple surveys to gauge the assessment of underlying macroeconomic and financial conditions by businesses themselves are prevalent (Table 1). International agencies, such as, the OECD, the European Union, the Asian Development Bank (ADB) and the United Nations Economic and Social Council for Asia and Pacific (ESCAP), have been working towards harmonisation of these surveys in order to facilitate co-ordination and cross-country comparison. Indicators available from such surveys are found to be useful in the construction of lead indicators for business cycle analysis (Hansson and Jansson, 2003) and for developing summary gauges of the short-term outlook. | Table 1: Cross Country Experience of Industrial Outlook Surveys | | Business Tendency Survey Parameters | Australia | Brazil | Canada | France | Germany | India | Indonesia | Japan | New Zealand | South Africa | United Kingdom | United States | | Conducted since year | 1966 | 1995 | 1998 | 1959 | 1961 | 1998 | 2002 | 1957 | 1961 | 1986 | 1977 | 1968 | | Composite Indicator (BEI) | ✓ | ✓ | ✓ | | | ✓ | ✓ | ✓ | ✓ | ✓ | ✓ | ✓ | | Capacity Utilisation | ✓ | ✓ | | ✓ | ✓ | ✓ | ✓ | ✓ | ✓ | ✓ | ✓ | ✓ | | Employment | ✓ | ✓ | ✓ | | | ✓ | ✓ | ✓ | ✓ | ✓ | | ✓ | | Inventory Finished Goods | ✓ | ✓ | | | | ✓ | ✓ | ✓ | ✓ | ✓ | | | | Order books | ✓ | ✓ | | ✓ | ✓ | ✓ | ✓ | | ✓ | ✓ | ✓ | | | Production | ✓ | ✓ | | | | ✓ | ✓ | | ✓ | ✓ | | | | Selling price | ✓ | | ✓ | | | ✓ | | ✓ | ✓ | ✓ | | | | Source: OECD statistics | Most inflation targeting countries1 have maximum coverage of demand and price parameters in their surveys which are considered worthy of national representation. The iconic manufacturing business outlook survey conducted by the Philadelphia Federal Reserve Bank is intended to capture manufacturing conditions in the north eastern USA, but it is widely regarded as reflecting a country-wide assessment2. Apart from central banks, the national statistical offices also conduct business tendency surveys. In Brazil, the Survey of Manufacturing Industry has several similarities with the Indian experience. It is a qualitative survey conducted monthly. Its results are used to identify a lead indicator about the state of the economy with respect to the business outlook. In Canada, a similar survey is conducted with the same frequency by the regional offices of the Bank of Canada. They target the senior management of select firms based on their contribution in gross domestic product. The balance of opinion is estimated in a range between -100 and +100, again resonating with the RBI’s IOS. Indonesia conducts a business tendency survey which is widely intended for its sheer breadth of coverage, on quarterly basis to obtain information related to a wide array of business conditions, such as business revenue, production capacity utilisation, employment, average working hours, domestic and overseas demand. The survey covers a sample of 2500 companies which are considered on the basis of their proportional contributions to manufacturing GDP. 3. Stylised Facts Turning back to the RBI’s IOS, the survey schedule is canvassed among a fixed panel of 2500 manufacturing companies, with paid-up capital above ₹5 million. The panel is updated periodically (with addition of new companies or deletion of closed/ merged companies). The response rate is around 45-50 per cent. The survey schedule consists of qualitative questions and the target respondents are senior management personnel or finance heads of the companies. It has five blocks: block 1 is the identification block; block 2 solicits product details; block 3 seeks size class details of the company in terms of paid-up capital, annual production and capacity utilisation; block 4 collects responses on production constraints faced by the company; and block 5 assesses qualitative questions on 19 core parameters.3 The options provided for stock variables, viz., production capacity, pending orders, level of capacity utilisation, employment and inventories, seek a comparison with the normal situation, whereas for flow variables, viz., production, order books, exports, imports, availability of finance, sequential responses are sought, i.e., changes over the corresponding quarter. The survey covers two time periods - assessment of the current quarter as compared with the previous period and expectation for the ensuing quarter as compared with the current quarter. Responses are collected on a 3-point scale. The fieldwork of the survey is carried out through private market research agencies and both mail and telephonic means are adopted to gather the required information. 3.1 Methodology The survey results are summarised through a single quantitative measure called the Net Response (NR), which is, in general, the difference between the proportions of optimistic and pessimistic responses. The zero value is assigned to neutral responses, interpreted as ‘no change/status quo (NC)’.4 Therefore, the NR can take values ranging from –100 to +100. Positive values of NR indicate growth/ optimism while a value below zero indicates contraction/ pessimism. However, in this article, the NRs of all the parameters have been calculated as the difference in proportions of ‘increase’ and ‘decrease’ responses in order to have a direct comparison with the underlying / targeted macro variables. Hence, the positive values of NRs would indicate pessimism for cost parameters. In the rest of this article, NR is used to analyse the survey results and to track the movements of various parameters. Information about the proportion of respondents indicating “no change”, i.e., NC has also been included in conjunction with the NRs for comprehensive presentation.5 The assessment of demand conditions, the financial situation, the price situation, and overall business conditions presented in this section focuses on 2017-18, i.e., rounds 78-81 (January-March 2018) of the survey. To provide some perspective, time series movements from round 62 (April-June 2013) are presented as a backdrop. 3.2 Demand Conditions Perceptions of Indian manufacturers on aggregate demand conditions in the economy are drawn on the basis of their assessment of key parameters such as production (PR), order books (OB), capacity utilisation (CU), inventory (INV), exports (EXP), imports (IMP) and employment (EMP) read in conjunction. Sentiment on production measured by net responses (NRA-PR)6 gradually improved during the year reaching a recent high during Q1:2017-18. While moving in tandem, expectations on production (NRE-PR) remained higher than NRA-PR although some moderation set in from Q4 and extended into Q1:2018-19. The survey responses on production in terms of NRA-PR and NRE-PR are largely able to track the underlying manufacturing activity as reflected in the index of industrial production (IIP) (Chart 1a). Notably, the proportion of no change responses on production (NCA-PR as well as NCE-PR)7 remained approximately at 50 per cent during the entire period. 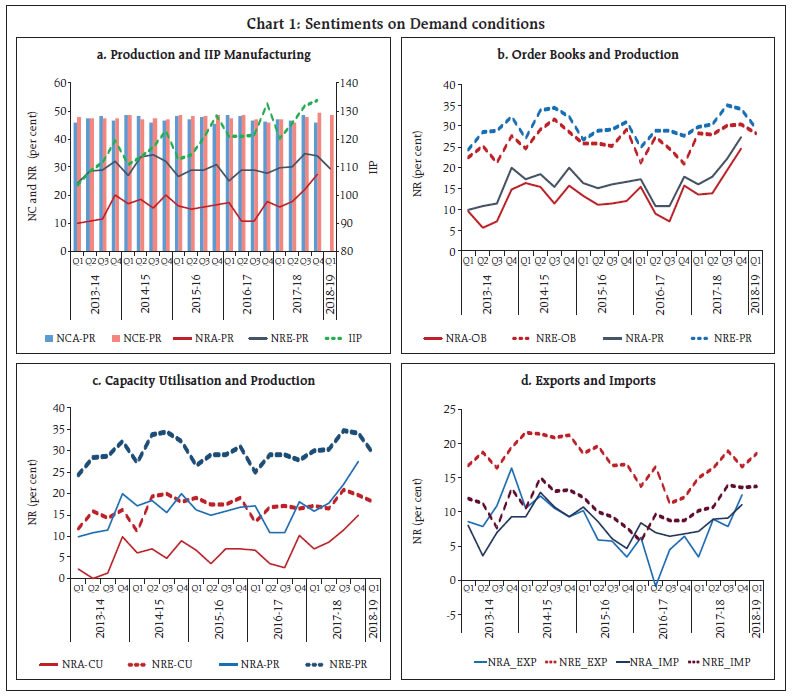 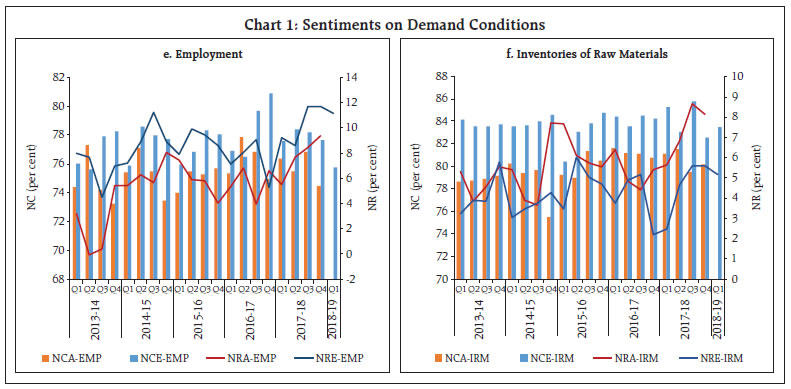 Manufacturers’ assessment and expectations on order books (OB) broadly tracked those on production, reflecting a sense of gradually improving underlying demand, while the outlook remained stable (Chart 1b). Another indicator of demand, i.e., capacity utilisation (CU) was assessed to be evolving in line with production, the extent to which an enterprise actually uses its installed capacity and the outlook on CU was seen as moderating in sync with the latter in the second half of 2017-18 and into the first quarter of 2018-19 (Chart 1c). Respondents’ assessment and expectations on exports and imports turned up during the year with those on exports outstripping imports in the second half of the year as demand conditions strengthened (Chart 1d). The employment parameter includes part-time and full-time employees and casual labourers. Typically, it is a slow moving variable and the proportion of NC tends to dominate responses (usually 70-80 per cent). A tenuous recovery in the employment situation from the slump in 2015-16 took hold in 2016-17, barring Q3:2016-17 the period of demonetisation, and gathered further strength in 2017-18 (Chart 1e). As companies target a fixed level of inventories of raw materials (IRM) except when large changes are anticipated in demand or prices, the response to this parameter is dominated by NC (at around 80 per cent), although slight upturn in NR during 2017-18 indicate slowly improving demand conditions (Chart 1f). 3.3 Financial Situation As business responses to changes in underlying demand in the economy can be boosted or constrained by financial conditions, net responses on the overall financial situation as well as the cost and availability of external finance provide useful insight into the ability of manufacturers to strategise their business plans. Respondents have expressed positive sentiment on the overall financial situation (OFS) in the last few years. Sentiment improved further from Q4:2016-17, reflecting surplus liquidity in the system. The outlook for 2017-18 remained broadly stable (Chart 2a). NRs on cost of external finance (CEF) started rising gradually from Q3:2017-18 and the outlook for Q4:2017-18 and Q1:2018-19 expected to increase further (Chart 2b). The availability of finance (AOF) remained stable during 2017-18 (Chart 2c). 3.4 Price Situation The price related questions sought response on increase, decrease or no change in the cost of raw material and in selling prices. In this analysis, manufacturer’s price to market (ex-factory unit prices) and profit margins assume significance. In this context, respondents’ sentiments on prices and costs are notable as they need to gauge demand and financial conditions against prevailing market developments to evaluate their abilities to translate input costs incurred in production activity into selling prices and profits. The cost of raw material (CRM) remained an abiding concern for manufacturers through 2017- 18, with around 50 per cent of net responses reflecting perception of increased CRM, especially in Q4:2017-18, with close co-movement with WPI inflation (Chart 3a). In line with these underlying movements, NRs on selling prices (SP) picked up from Q3:2017-18 and the outlook improved further into Q4:2017-18, although in comparison to the outlook on CRM, they were relatively moderate indicating that pricing power was improving but at a slow pace (Chart 3b). Reflecting these expectations, net responses on profit margins (PM) (gross profits as percentage of net sales) did not change appreciably. In fact, the assessment of current conditions remained marginally negative, pointing to a decline in profit margins. From Q2:2017-18, the assessment on profit margins showed tentative signs of recovery. The outlook improved slightly in Q1:2018-19 after a sharp decline in Q4:2017-18 (Chart 3c). 3.5 Overall Business Conditions Overall business conditions in the manufacturing sector is captured through a direct question in the survey schedule and composite business indices are constructed on the basis of responses on the parameters discussed in preceding sub-sections. About half of the respondents polled no change in their assessment and outlook on the overall business situation (OBS) and NR remained positive throughout the reference period. However, net responses improved from a year ago and the outlook appeared more upbeat than before. The level of NRE increased steadily from Q3:2013-14 to Q3:2014-15 but moderated thereafter till Q4:2016-17. OBS of the manufacturing sector improved in 2017-18 (Chart 4a). Juxtaposing net responses received, it is possible to obtain snapshot of the outlook for manufacturing sector in the form of business assessment index (BAI) and business expectations index (BEI)8. These are computed as weighted average of responses from different industries on nine performance parameters, current and expected. The index ranges from 0 to 200 and the 100 mark separates growth from contraction. The index based on expectations is usually higher. Since Q2:2017-18, sentiment improved significantly indicating expansion of manufacturing activity. The BEI declined marginally from 115.8 in Q4:2017-18 to 114.6 in Q1:2018-19 although it remained in the expansionary zone (Chart 4b). 4. Outlook for Manufacturing: An Alternative Approach In this section, a dynamic factor model (DFM) is used on NRs generated by the IOS by combining cross-section of information through principal component analysis (PCA) within a time varying model that accounts for leads and lags. The embodied filtering technique removes series specific “noise” and retains those parts of the data that are common to the series under consideration. As demonstrated in the literature, it summarises all valuable information from a large survey dataset into a single common factor index (Hansson, Jansson, and Lof, 2003; Kabundi, 2006; Bec and Mogliani, 2015). In the Indian context, dynamic factor models have been employed to develop an Indicator of Global Spillovers (IGS) to examine the impact of unconventional monetary policies on transmission of monetary policy in India (Patra, et al, 2016). Net responses (expectations) or NREs of different parameters surveyed in the IOS are used to construct dynamic factor indices (DFIs) as Dfactor for demand conditions9 and Pfactor for price / cost conditions over the period from Q1:2001-02 to Q1:2018-19. The DFIs for demand and prices co-move closely with manufacturing GVA growth (y-o-y) (smoothened series10) and manufacturing WPI inflation, respectively (Chart 5a and 5b). While the BEI is constructed by using fixed (equal) weights for each parameter, the parameter weights of the DFIs are dynamically assigned. First parameters are derived through PCA in DFIs instead of the large set of parameters used in the BEI. This dimension reduction helps to minimise the parameter-specific noise. The Dfactor tracks manufacturing GVA growth better than the BEI in cross-correlation analysis. Regression diagnostics (Table A1 in the Appendix) are also better for Dfactor than BEI. The cross correlations of Pfactor, as leading indicator for manufacturing WPI inflation, are significantly high, attesting to its superior predictive power in respect of the latter (Table 2). 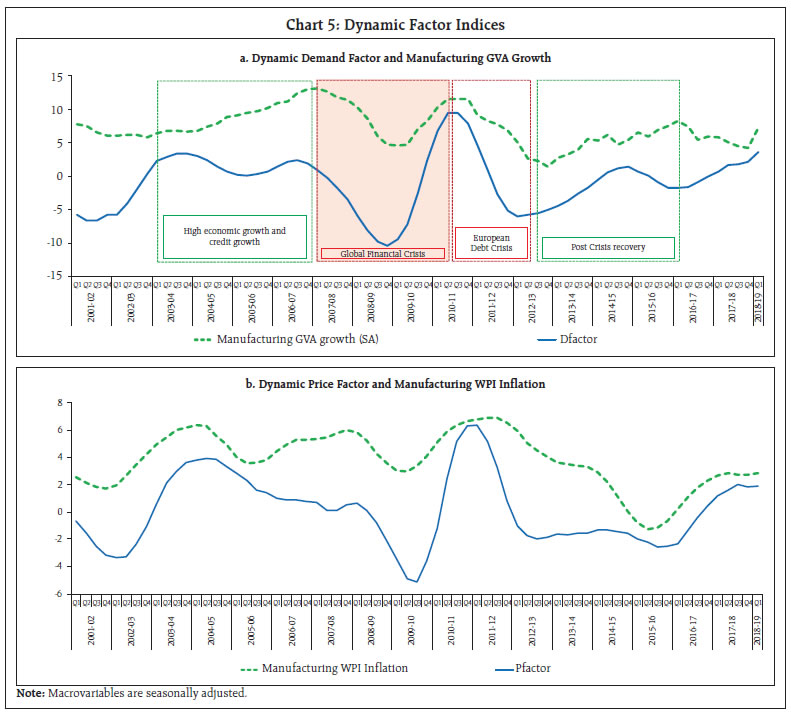
| Table 2: Cross Correlations between Composite survey indicators and real macrovariables | | (a) BEI and Dfactor with manufacturing GVA Growth | (b) Pfactor with manufacturing WPI Inflation | | Lead- BEI /Dfactor | BEI | Dfactor | Lead Pfactor | Pfactor | | -4 | -0.04 | 0.21 | -4 | 0.33 | | -3 | 0.14 | 0.35 | -3 | 0.47 | | -2 | 0.36 | 0.38 | -2 | 0.66 | | -1 | 0.51 | 0.64 | -1 | 0.77 | | 0 | 0.65 | 0.79 | 0 | 0.63 | 5. Conclusion The four rounds of IOS for the year 2017-18 viewed in conjunction indicated gradual improvement in demand conditions facing manufacturers, while the outlook for the first quarter of 2018-19 appeared stable. The overall financial situation improved in Q4:2017-18 but expectations remained weighed down. On the price front, sentiments on cost of raw materials deteriorated from Q3:2017-18, while some improvement was evident in respect of selling prices. Dynamic factor indices based on the IOS data produce lead indicators for manufacturing GVA growth and manufacturing WPI inflation that are able to track turning points and offer considerable scope for future research candidates for inclusion in the RBI’s panel of lead indicators of economic activity for nowcasting / forecasting purposes. References Amstad, Marlene and Richard Etter (2000), “A New Approach to indicate Changes in Business Cycles in the Manufacturing Industries Using Markov Switching Models on Business Survey Indicators in Economic Surveys and Data Analysis”, CIRET Conference Proceedings, pp. 283-305. Bec F., and Mogliani M. (2015), “Nowcasting French GDP in real-time with surveys and “blocked” regressions: Combining forecasts or pooling information?”, International Journal of Forecasting, vol. 31(4), 1021- 1042 Business Tendency Surveys: A Handbook (2003), OECD Hansson J., Jansson P., Lof M. (2003), “Business Survey Data: Do They Help in Forecasting the Macro Economy?”, Working Paper, No. 84, National Institute of Economic Research. Kabundi A. (2006), “Estimation of Economic Growth in France Using Business Survey Data”, IMF Working Paper No. 04/69 Kevin Lane and Tom Rosewall, (2015), “Firmlevel Capacity Utilisation and the Implications for Investment, Labour and Prices”, RBA Bulletin. Lekshmi, O. and Mall, O.P., (2015), “Forward looking surveys for tracking Indian economy: an evaluation”, BIS IFC Bulletin No 39. Patra, M.D, Pattanaik, S., John, J., Behera, H.K. (2016), “Monetary Policy Transmission in India: Do Global Spillovers Matter?”, RBI Occasional Papers, Vol. 37, No.1 & 2 Piette C., and Langenus G. (2013), “Using survey data for predicting Belgian quarterly GDP growth”, Research Department, National Bank of Belgium. Stock, J. and M. Watson (2011), “Dynamic Factor Models”, Oxford Handbook of Economic Forecasting, Oxford Press, ISBN-10: 0195398645.
Appendix A. Dynamic Factor Model
| Table A1: Estimation Results based on GVA Growth (gva) | | VARIABLES | (1) | (2) | (3) | | gva | gva | gva | | L.gva | 1.433*** | 1.217*** | 1.373*** | | | (0.108) | (0.111) | (0.112) | | L2.gva | -0.533*** | -0.253** | -0.564*** | | | (0.108) | (0.120) | (0.109) | | Dfactor_exp | | 0.089*** | | | | | (0.022) | | | BEI_expectation | | | 0.081 | | | | | (0.050) | | Constant | 0.732** | 0.269 | 1.437*** | | | (0.325) | (0.314) | (0.540) | | Adj.R-squared | 0.9104 | 0.9204 | 0.9039 | | N | 68 | 68 | 68 | | RMSE | 0.879 | 0.790 | 0.868 | Note: L. indicates lag operator, Dfactor_exp is dynamic factor for expected NR for demand parameters. Standard errors in parentheses; *** p<0.01, ** p<0.05, * p<0.1.
Dfactor is constructed using NREs of production, capacity utilisation, employment, capacity utilisation and order books. |
| Table A2: Estimation Results based on manufacturing WPI inflation (wpinf) | | VARIABLES | (1) | (2) | | wpinf | wpinf | | | | | | L.wpinf | 1.359*** | 1.199*** | | | (0.104) | (0.111) | | L2.wpinf | -0.552*** | -0.435*** | | | (0.104) | (0.106) | | Pfactor_exp | | 0.126*** | | | | (0.042) | | Constant | 0.743*** | 0.905*** | | | (0.238) | (0.230) | | Adj.R-squared | 0.839 | 0.851 | | N | 68 | 68 | | RMSE | 1.057 | 0.995 | Not: L. indicates lag operator, Pfactor_exp is dynamic factor for expected NR for price parameters.
Standard errors in parentheses; *** p<0.01, ** p<0.05, * p<0.1.
Pfactor is constructed using NREs of selling prices, cost of raw material, cost of external finance and profit margins. |
|