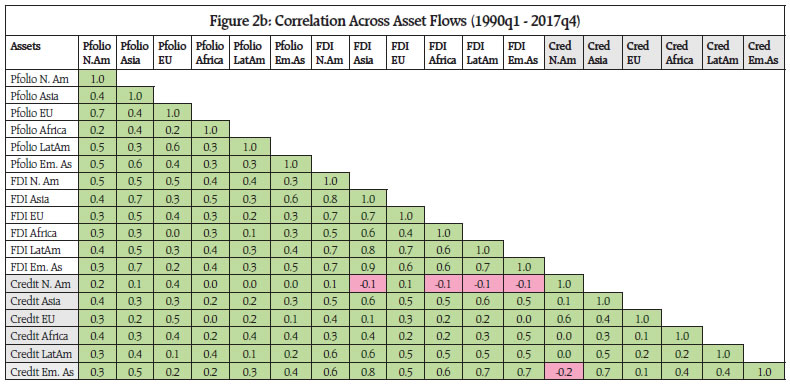
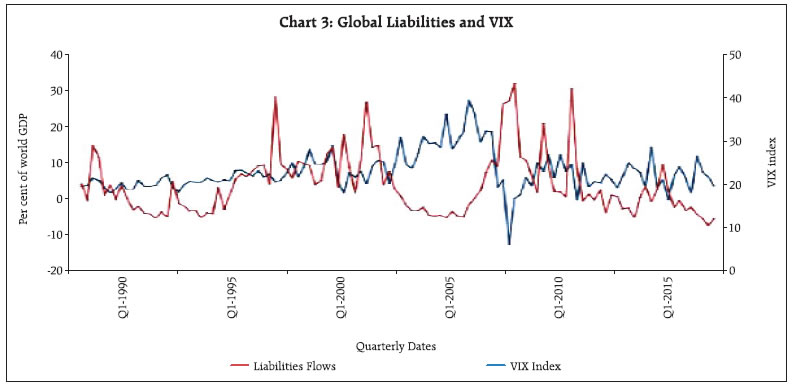
It is a great honour to be invited to deliver the sixteenth L. K. Jha Memorial Lecture at the Reserve Bank of India. Lakshmi Kant Jha was a leader in the Indian Civil Service, a distinguished diplomat and a central bank governor among many other achievements. He was also the Deputy Chairman of the Brandt Commission, whose task was to make recommendations on ways of improving North-South negotiations for global development. We would certainly need more initiatives of this sort at this point in time and all of L.K. Jha’s talent to help our planet. There are many global issues in front of us, which are more pressing by the day: air and water pollution, climate change, international trade policy, international monetary and financial spillovers are some of the most prominent ones. In this lecture, I will focus on issues related to this last topic. I will discuss the changing landscape in international financial markets and its relation with the ability of national monetary authorities to set independent monetary and financial conditions for their countries. I will discuss first the characteristics of the current financial globalisation and their implications. I will then review some evidence on the global financial cycle and turn to some discussion of policy options, particularly for financial stability. 2. Financial globalisation in the recent era Financial globalisation has increased massively since the 1990s. The great financial crisis of 2008 has stopped that progression. A simple and widely used measure of de facto financial integration is the sum of all cross-border financial liabilities (or of cross-border financial assets), scaled by annual world GDP. As reported in Lane and Milesi-Ferretti (2017), financial integration has risen spectacularly from the 1990s to 2007: cross-border labilities increased from about 70 per cent of world GDP in 1995 to about 210 per cent of world GDP in 2007 (see Chart 1). The lion’s share of these liabilities (or assets) belong to advanced economies or financial centers. In contrast, emerging and developing economies which constituted about 30 per cent of world GDP in 2007 accounted for only 10 per cent of cross-border financial assets. Their economic mass grew remarkably so that as of 2015, the world GDP share of emerging and developing economies was around 40 per cent. Their share of external assets had, however, expanded only to 13 per cent. 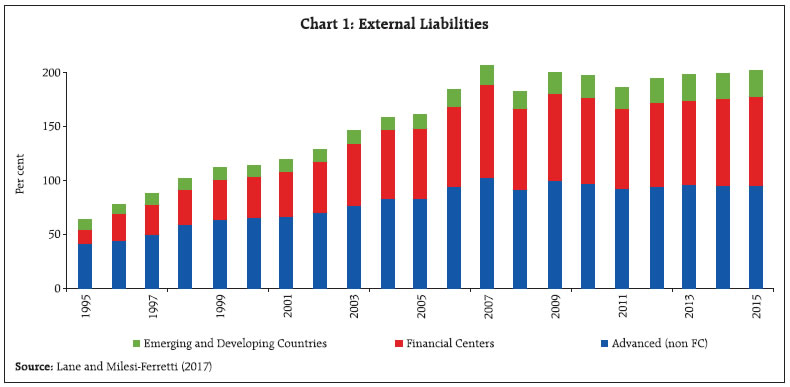 The menu of assets exchanged across borders has become broader with derivatives and asset-backed mortgage securities becoming internationally traded. The share of asset managers has also grown in recent years while global bank flows have decreased. Given these large amounts of cross-border asset positions, the scope for international capital flows to provide welfare gains or to do harm, has therefore, widened considerably since the 1990s. Hidden sides of financial globalisation A number of offshore financial centers are managing an increasing amount of world wealth as information technology and financial innovation have made it simpler to move funds overseas. The data show a massive over-representation of financial centers (compared to economic size) in cross-border asset holdings. As of 2007, financial centres1 accounted for around 10 per cent of world GDP but over 43 per cent of global financial assets. In 2015, their share in world GDP was down at 8 per cent but their global share of external assets remained at around 43 per cent. Many of the services provided by offshore centres are legal but some facilitate tax “optimisation”. There is also ground to believe that they ease tax evasion and money laundering. Recent work summarised in Zucman (2018) suggests that wealth held in offshore centres is very concentrated. For example, in Scandinavia, the top 0.01 per cent of the wealth distribution appears to own about 50 per cent of the wealth hidden in offshore financial centres. The emergence of more decentralised means of payments (cryptocurrencies, digital money) may lead to an amplification of this trend, if regulation is not carefully crafted by the central banking community - keeping abreast with the latest technological innovations and monitor these new types of capital flows. Benefits of financial globalisation Some of the most widely cited benefits of financial globalisation, enshrined in the psyche of economists and policy makers alike are - risk diversification and better allocation of capital (without restrictions on mobility, capital should flow to places where the marginal product of capital is the highest). Ironically, may be, since they have been very influential in the policy world, those benefits had not until recently been evaluated in a quantitative version of the stochastic neoclassical growth model, which provides the theoretical foundations for them. In a recent paper, I show with my co-authors (see Coeurdacier et al., (2018)) that welfare gains of financial integration due to better risk sharing and better capital allocation are small even for capital scarce and risky emerging economies. The intuition for these results can be summarised as follows. Relatively safe developed countries have small gains from reducing consumption volatility. They also have small gains due to a more efficient world allocation of capital after financial integration. Emerging countries face higher levels of uncertainty and could have potentially larger gains when they share risk. However, financial integration, by affecting the distribution of risk across countries, also leads to a change in the value of the steady state capital stocks. Unless riskier countries are also capital scarce, they will see capital flowing out as their precautionary savings are reallocated towards safer (developed) countries. When riskier countries are also significantly capital scarce (as emerging countries in the data), the standard efficiency gains driven by faster convergence are strongly dampened by the reallocation of precautionary savings. Hence the welfare gains are small. This does not necessarily imply that the gains from financial integration are small overall, but it does challenge economists and policy makers to go beyond the classic justifications to open up the financial account which are risk diversification and optimal international allocation of capital. There may be mechanisms through which financial flows improve Total Factor Productivity, for example, in the recipient country. It would certainly be valuable to learn more about those mechanisms and how general they are, in particular, whether they pertain to all classes of capital flows. 2. Global Financial Cycles In a paper written for the 2013 Jackson Hole symposium, I defined the Global Financial Cycle as the co-movement of gross capital flows, credit growth, risky asset prices and leverage across countries. Capital Flows Chart 2a shows the matrix of correlations of capital inflows (liabilities of countries) by asset classes disaggregated in the traditional categories of the balance of payment (FDI, portfolio (debt and equity) and credit2) into different geographical regions (North America, Europe, Latin America, Asia, Emerging Asia, Africa) during the period 1990Q1-2017Q4. The heatmap colours correspond to the signs of the correlations of capital flows across regions and types of flows (green when the correlation is positive and red otherwise). As evidenced by the very clear preponderance of the green colour in the heatmap, most types of capital inflows are positively correlated with one another and across regions. There is a strong commonality in liability flows across the world. The same is true for the matrix of correlations of capital outflows (assets) in Chart 2b. On the other hand there are no systematic patterns in the heatmap of the correlations of net flows. What is behind those co-movements in gross flows and are they associated with global credit growth and asset price fluctuations? Global factors It has long been noted that global factors are a major determinant of international capital flows. As observed by Calvo, et al., (1996), “global factors affecting foreign investment tend to have an important cyclical component, which has given rise to repeated booms and busts in capital inflows”. Economists have identified cycles in the real rate of interest and in the growth rate of advanced economies as important “push” factors for capital flows. Several studies have found that movements in the VIX3 are strongly associated with capital flows. The VIX is widely seen as a “fear gauge”, a market proxy for risk aversion and uncertainty. Carry trade flows, for example, tend to increase when the VIX is low and to collapse when the VIX spikes. Chart 3 plots aggregate gross inflows as a proportion of the world GDP for the period 1990 Q1-2017 Q4 together with the VIX (inverted scale). Particularly striking is the prolonged lowering of the VIX during the period 2002-2007, during which capital inflows surged. Credit flows are the more volatile and procyclical component of all flows, with a particularly dramatic surge in the run up to the crisis and an equally dramatic collapse during the crisis. Credit growth and leverage are negatively linked to the VIX. 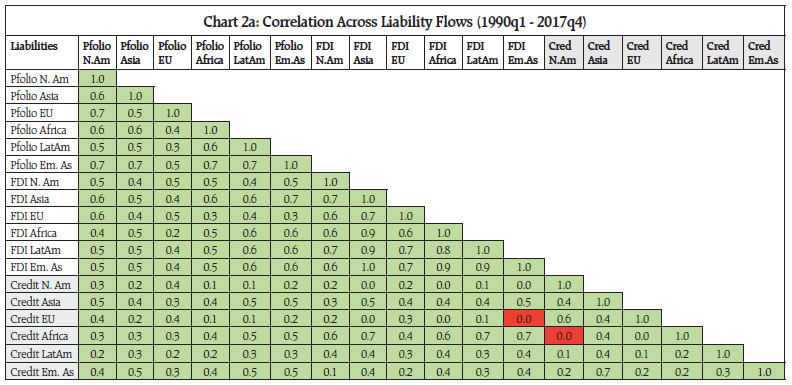
 Asset prices Similarly, risky asset prices around the world co-move negatively with the VIX. For a large part, they do not reflect sector-specific, country-specific or company-specific factors but rather one global factor. As shown by Miranda-Agrippino and Rey (2015), using a large cross section of 858 risky asset prices (i.e. prices of stocks, corporate bond prices) distributed over the five continents, an important part of the variance of risky returns (25 per cent) is explained by one single global factor4. As apparent from Chart 4, the factor goes up from the early 1990s until mid 1998 when the Russian crisis erupts followed by the Long-Term Capital Management (LTCM) bankruptcy, and eventually the bursting of the dotcom bubble. From the beginning of 2003, the index increases rapidly until the beginning of the third quarter of 2007 when it plummets. This is shortly after the collapse of the subprime market and this coincides with the first signals of increased vulnerability of the financial markets. The high degree of negative correlation of the global factor with the VIX is striking. Economic mechanism One mechanism consistent with those facts is the existence of a positive feedback loop between greater credit supply, asset price inflation, and compression of spreads. Smaller risk premiums amplify bank and non-bank lending. As asset prices go up, measured risk is low and all balance sheets look healthier. By relaxing value-at-risk constraints which are widely used in the banking sector but also in the asset management industry, this creates additional space for lending, and so on. This contributes to the procyclicality of credit and portfolio flows and their importance in the build-up of financial fragility. In some recent work (Coimbra and Rey (2018)), my co-author and I show that in times of low funding costs, agents with the highest ability to take risk, e.g. because of looser value-at-risk constraints, tend to increase their balance sheet faster and sometimes driving out more conservative players from market. This leads to a concentration of risk in some fast-growing balance sheets. We find that in the data, the skewness of the distribution of leverage of banks goes up during boom periods of low funding costs. There is a fat right-tail of risk taking financial intermediaries which concentrates a lot of macroeconomic risk. For example, in the Swedish financial crisis at the beginning of the 1990s, Englund (2016) explains, how between 1985 and 1990, the rate of increase of lending by financial institutions jumped to 16 per cent due in part to deregulation. There were rapid shifts in market shares: between 1985 and 1988, the lending shares of Sparbanken Sverige and of Gota increased from 20.8 to 22.1 per cent and from 7.9 per cent to 8.9 per cent of all bank lending, respectively, while more conservative players held back. The CEOs of these two banks emphasised that‘; internal targets geared at maximisation of return to equity led to expansion without proper account or risk taking’;. There was a significant correlation between the rate of credit expansion and the subsequent credit losses in the crisis, leading to bailouts. 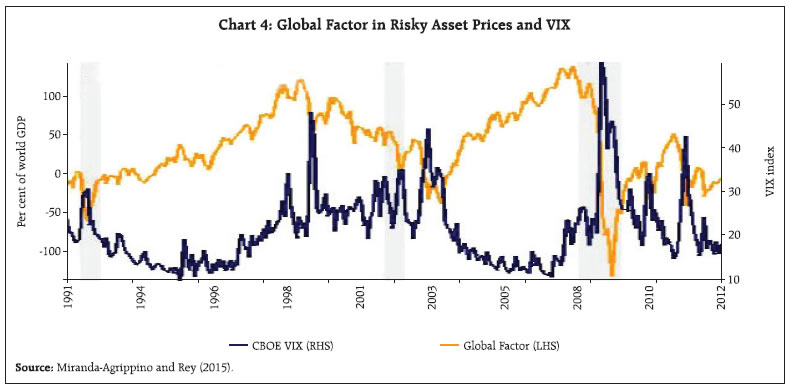 As credit cycles and capital flows obey global factors, they may be inappropriate for the cyclical conditions of some economies. For some countries, the global cycle can lead to excessive credit growth in boom times and excessive retrenchment in bad times. As excessive credit growth is one of the best predictors of crisis5, global financial cycles can be associated with surges and retrenchments in capital flows, booms and busts in asset prices and crises. The picture emerging is that of a world with powerful global financial cycles. It is also a world with massive deviations from uncovered interest parity. There are interrelations with the monetary conditions of the centre country (the United States), capital flows and the leverage of the financial sector in many parts of the international financial system. 3. Constraints on national monetary authorities In international macroeconomics and finance, we often think within the framework of the “trilemma”: in a financially integrated world, fixed exchange rates export the monetary policy of the centre country to the periphery. The corollary is that, only floating exchange rates enable monetary policy independence (see e.g. Obstfeld and Taylor (2004)). But the global financial cycle transforms the Mundellian trilemma into a dilemma. The trilemma misleads us by assuming that domestic monetary and financial conditions shaping the macroeconomic situation of a country can be conveniently summarised by this one single variable, the short-term interest rate. If that were the case, the extra degree of freedom gained through exchange-rate flexibility would indeed be enough to neutralise any effects of foreign financial conditions on the domestic macroeconomy. Yet, in a world of globalised finance where financial conditions such as spreads, risk premia, cost of funds are exported from the centre country of the international monetary system monetary policy independence is constrained, including for countries with flexible exchange rates. A growing body of empirical evidence6 finds that US monetary policy shocks around FOMC meeting windows are transmitted internationally and affect leverage, asset prices and spreads, capital flows and credit creation around the world including in jurisdiction with flexible rates. The effect of US monetary policy shocks on mortgage spreads is of the same order of magnitude in the US and in Canada for example. This does not mean that flexible exchange rates have no purpose, they do and they help external adjustments of countries following large macroeconomic shocks as emphasised in Obstfeld and Taylor (2017). But this means that flexible exchange rate cannot insulate economies from the global financial cycle, in particular, during the boom phase of the cycle. As analysed by Hyun Shin and his co-authors (Bruno and Shin (2015), Hofmann, et al., (2016)) and by Portes and Vines (1997), an appreciation of the exchange rate during the boom phase may strengthen capital flows and encourage more lending. Furthermore as (Caruana (2012)) points out the depreciation of higher-yielding currencies tends to happen fast during episodes of stress in global asset markets, and many emerging market economies have found this destabilising. 4. Paths of Emancipation National authorities have the following policy options to insulate their economies and manage the global financial cycle: i. Impose targeted capital controls; ii. Limit credit growth and leverage during the upturn of the cycle, using national macroprudential policies on banks and nonbanks; iii. Act on the transmission channel structurally by imposing stricter regulation on all financial intermediaries who create credit, bank or non-banks; iv. Decrease procyclical fiscal incentives. If it is really excessive credit growth that is the main issue of concern (as opposed to exchange rate appreciation), capital controls should be viewed as a partial substitute with macroprudential tools. The latter tend to be more targeted. But capital controls may be appropriate if there is a lot of direct cross-border lending and the banking system can be circumvented (see Ostry, et al., (2011)). Macro-prudential policies can weaken the link between domestic monetary policy and capital inflows, without the imposition of capital controls. For instance, by preventing excessive credit growth in boom times, the central bank may reduce the incentive for banks to borrow externally. There are now many tools available to macroprudential authorities in different countries (countercyclical buffers, sectoral risk weights, etc., for banks; debt to income ratios, loan to value ratios, etc., for borrowers). But most of the existing panoply of tools can be applied only to the banking sector. Since a lot of recent credit creation takes place outside banks - for example, in India the share of Non-Banking Financial Companies in total credit extended has increased from around 9.4 per cent in March 2009 to more than 17 per cent by March 2018, it becomes more crucial that macroprudential authorities and central banks have the power to modulate credit growth in the non-bank sector as well. Macroprudential interventions Beyond tools, one of the biggest practical issues is to determine the timing of intervention. When should one activate circuit breakers to cut the positive feedback loops described earlier? It is important, not to wait too long; not to wait, for example, for the quasi-certainty that there is a bubble in asset prices or real estate to intervene. One option is to devise quasi-automatic rules based on early-warning indicators that triggers an action (or a documented explanation of why an authority does not act) as soon as a certain threshold is crossed. This has the advantage of being more robust to lobbying of interested parties, banks or finance ministries7. It also overcomes the well-known bias towards inaction when good times are unfolding and everyone is happily sharing the dividends of increasing asset returns, forgetting about the risk building up. Recent machine learning techniques can help build more robust early warning indicators (see Fouliard, Howell and Rey (2018)). Among the tools helping to form the judgement of macroprudential authorities, the ability to stress-test the balance- sheets of the financial sector (banks and non-banks) either in a targeted way or broadly, should figure prominently. This is in order to judge whether large but realistic changes in asset prices could jeopardise financial stability. Stress testing is a difficult exercise in general and estimating second-round effects is particularly challenging but particularly important in a country like India where the shadow banks constitute an important part of total assets (about 13 per cent at end 2016 according to the Financial Stability Board—see Chart 5) and they engage in maturity transformation which could lead to fire sales and affect the banks. Stress tests also require careful thinking about communication policy (and/ or absolute confidentiality as the case may be). Moreover, fiscal backstop strategies are needed to guarantee the credibility of the stress testing. None of this is easy. But doing stress tests regularly and often, even if this is an imperfect process, is a necessary monitoring tool. It improves the knowledge of supervisors and insures they are up to date with the recent market developments; importantly it may also give constructive challenges to the internal risk monitoring of institutions. It may reveal failures in corporate governance in organisations where incentives are not necessarily aligned to keep risk in check or where information is not available or centralised adequately. It may even reveal “blind spots” of risk taking activities. At the heart of the transmission mechanism of the global financial cycle to the domestic economy is the ability of financial intermediaries, whether banks or shadow banks to leverage up quickly to very high levels when financing conditions are favourable. Credit is excessively sensitive to the financing costs. It is possible, in addition to or instead of monitoring the cyclical properties of credit growth to use financial regulation to cut the ability of financial intermediaries to be excessively procyclical. Policy levers to do so are the leverage ratio or additional capital requirements. Importantly, we should not forget that, usually, there are a number of important domestic distortions that interact with capital flows and credit growth. In practice, for political reasons, we see subsidies to investment in real estate and to debt in many countries. These subsidies are instrumental to creating the initial froth in real estate prices and investment. By all means, the first thing to do should be to remove these distortions. It is also important to remember that excessive borrowing by a country often means that someone else is lending excessively: macroprudential policies apply to lending countries just as well as they apply to borrowing countries. 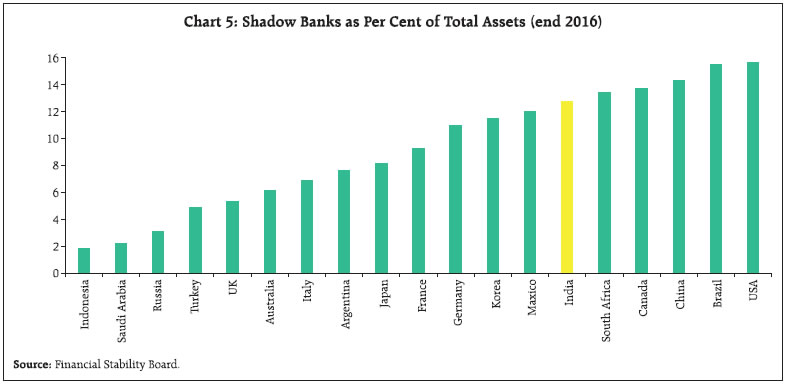 Finally, for any of this to work, macroprudential authorities should be independent. In return for their independence, macroprudential authorities should be accountable to elected bodies. Their mandate on financial stability should be as transparent as possible and well explained to the parliament and general public. This involves pointing out to the citizens, the very large costs of financial crises. Unfortunately, we have many very concrete examples of these huge costs all over the world: economic costs, social and political costs and even direct threats to the social fabric of our countries. Avoiding financial crises is a difficult task for which one is rarely thanked as in best cases nothing dramatic happens. It should nevertheless be a policy priority. References Acharya, Viral V. and Raghuram G. Rajan (2013). Sovereign Debt, Government Myopia and the Financial Sector, Review of Financial Studies, 26(6), 1526-1560. Bruno, Valentina and Hyun Song Shin (2015). “Capital Flows and the Risk-taking channel of monetary policy”, Journal of Monetary Economics, 71, 119-132. Calvo, Guillermo A., Leonardo Leiderman, and Carmen Reinhart (1996). “Capital Flows to Developing Countries in the 1990s: Causes and Effects,” Journal of Economic Perspectives, 10, Spring 1996, 123-139. Caruana, J. (2012). Policy making in an interconnected world. Jackson Hole Economic Symposium. Coeurdacier Nicolas, Hélène Rey and Pablo Winant (2015). “Financial Integration and Growth in a Risky World”, NBER WP 21817 Coimbra, Nuno. and Hélène Rey (2017). “Financial cycles with heterogeneous intermediaries”, NBER WP 23245. Eichengreen Barry and Richard Portes (1987). ‘The Anatomy of Financial Crises’, in Richard Portes and Alexander Swoboda, eds., Threats to International Financial Stability, Cambridge University Press. Financial Stability Board: Global Shadow Banking Monitoring Report 2017 Forbes, Kristin J. and Francis E. Warnock (2012). “Capital Flow Waves: Surges, Stops, Flight and Retrenchment” Journal of International Economics 88(2): 235-251. Fouliard, Howell and Rey (2018). “Answering the Queen: Online machine learning and financial crises”, mimeo London Business School. Gerko and Rey (2017). “Monetary Policy in the Capitals of Capital” Journal of the European Economic Association 15 (4), 721-745. Gourinchas, Pierre-Olivier and Maurice Obstfeld (2012). “Stories of the Twentieth Century for the Twenty- First,” American Economic Journal: Macroeconomics, 4(1), 226-65. Hofmann, B., lhyock Shim, and H. S. Shin (2016). Sovereign yields and the risk-taking channel of currency appreciation. BIS WP 538. Òscar Jordà, Moritz Schularick, Alan M. Taylor, Felix Ward (2018). “Global Financial Cycles and Risk Premiums, NBER WP 24677. Lane, Philip and Gian Maria Milesi-Ferretti (2017); ‘International Financial Integration in the Aftermath of the Financial Crisis’; IMF Working paper, 17/115. Miranda-Agrippino, Silvia, Rey, Hélène (2015). US Monetary Policy and the Global Financial Cycle, NBER WP 21722. Obstfeld, M. and A. Taylor (2017). “International monetary relations: Taking finance seriously”. Journal of Economic Perspectives. Obstfeld, Maurice and Alan Taylor (2004). “Global capital markets: integration, crisis and growth”, Cambridge University Press. Ostry, Jonathan D., Atish R. Ghosh, Karl Habermeier, Luc Laeven, Marcos Chamon, Mahvash S. Qureshi, and Annamaria Kokenyne. “Managing Capital Inflows: What Tools to Use?” IMF Staff Discussion Note SDN/11/06, April 2011. Portes, R. and D. Vines (1997). Coping with capital inflows. Commonwealth Secretariat Economic Paper (30). Rey, H. (2013). Dilemma not trilemma: The global financial cycle and monetary policy independence. Proceedings of the Jackson Hole symposium. Reserve Bank of India (2018). Financial Stability Report. Schularick, Moritz and Alan M. Taylor (2012). “Credit Booms Gone Bust: Monetary Policy, Leverage Cycles, and Financial Crises, 1870-2008.” American Economic Review 102, 1029-61. Zucman, Gabriel (2018). “Global Wealth Inequality”, UC Berkeley, mimeo.
|