At a time when global economic activity is besieged by the outbreak of the second wave of COVID-19, incoming data for the month of October 2020 have brightened the near-term outlook for the Indian economy and stirred up consumer and business confidence. There are, however, formidable downside risks that confront the path of recovery. Since the assessment of the performance of the Indian economy in the first half of 2020-21 that was presented in the Monetary Policy Report of October 2020, several developments point to a window of respite opening up and an unshackling of economic activity from the grip of COVID-19 as the festival season sets in. After the unprecedented decline of 23.9 per cent in gross domestic product (GDP) in Q1:2020-21, ‘nowcasting’1 assessment presented in an article later in this Bulletin suggests that the pace of contraction of GDP eased to 8.6 per cent in Q2:2020-21. The estimates of the National Statistical Office (NSO) that are expected at the end of November 2020 will formally bear out the extent of improvement that occurred in the quarter gone by. For 887 non-financial listed companies that have declared results so far (constituting around four-fifth of the market capitalisation of all listed non-financial companies), sales remained in contraction in Q2, although at a moderated pace relative to Q1. Expenses of these companies, however, fell faster than sales in the quarter ending September 2020, resulting in a sharp rise in operating profits after two consecutive quarters of contraction. With other income increasing moderately, net profits rose strongly, mirroring the behaviour of operating profits, which suggests that gross value added by the corporate sector in Q2 may surprise on the upside (Chart 1). 
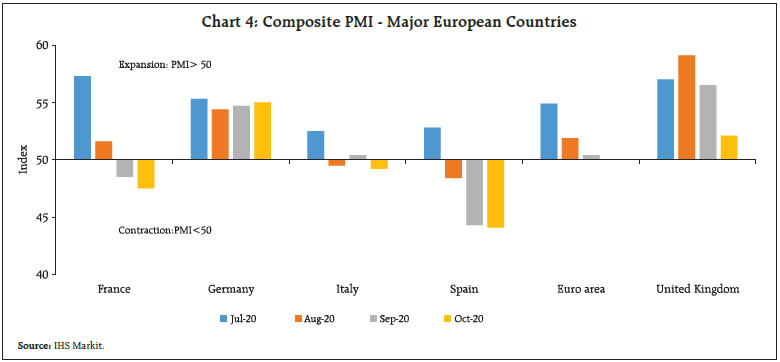
| Table 1: Select Ratios of Manufacturing Companies | | (Per cent) | | End of Period | Debt to equity ratio | Debt to asset ratio | Cash to total assets | | H2:2018-19 | 35.9 | 19.2 | 2.4 | | H1:2019-20 | 32.6 | 17.7 | 2.7 | | H2:2019-20 | 45.7 | 22.4 | 3.2 | | H1:2020-21 | 40.5 | 21.5 | 4.1 | | Source: Capitaline. | Unaudited balance sheets of 423 early reporting listed private manufacturing companies suggest that leverage (as measured by debt to equity ratio and the debt to asset ratio) marginally declined in H1:2020-21 relative to the previous months (Table 1). Evidently these companies reduced their assets during H1:2020-21 to mobilise funds. Investment in fixed assets (capex) remained muted during the pandemic. Funds mobilised by these companies in the form of equity and liquidation of assets were mainly used to reduce liabilities and increase cash holdings, the latter case indicative of precautionary saving in uncertain times. Investment by these companies remained subdued. Earnings results of 225 listed banking and financial sector companies in India (representing around four-fifth of all the listed banking and financial sector companies in terms of market capitalisation) reflected a modest pickup in interest income (Chart 2). On the other hand, income flows like profit/ loss from sale of assets and investments registered a healthy increase. Total expenditure moderated on account of lower growth in interest expenses, leading to a robust rise in operating profits. Furthermore, provisioning on loans and advances grew only marginally, resulting in a sharp jump in net profits. According to CARE Ratings, the ratio of gross non-performing assets (NPAs) to total assets improved to 7.7 per cent in September 2020 from 8.2 per cent in the preceding quarter. This article, the first in the series, tracks a host of indicators of various facets of the economy that have become available for the month of October, 2020 with a view to sustaining an ongoing assessment of this cusp on which the Indian economy is poised in Q3. It is envisaged that hereafter, a monthly review of the state of the economy will become a regular feature in the Bulletin. By doing so, a hallowed tradition that began with the first issue of the Bulletin in January 1947, but interrupted during the period 1995 to date, will be revived. 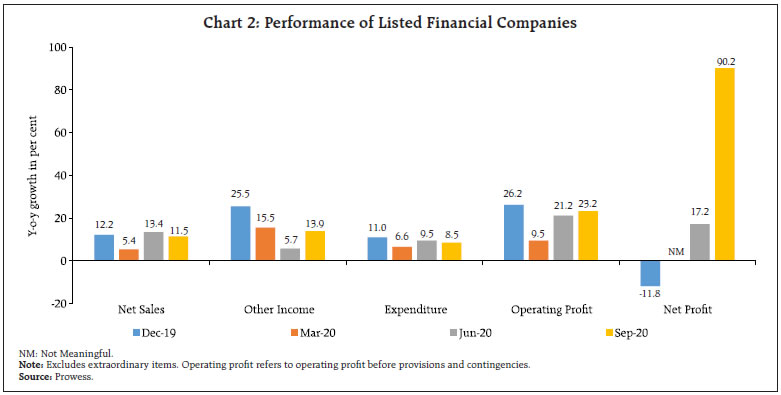 Set against this backdrop, this article sifts through various indicators to gauge the state of the economy in the month of October 2020. Rest of the article is divided into five sections. The next Section encapsulates the evolving global economic and financial market developments. Section III analyses the incoming data on high frequency indicators through various sectors of the real economy. Section IV exmines the evolving financial market conditions in the wake of recent liquidity management measures of the Reserve Bank. The last Section sums up the discussion. II. The Global Setting Global economic activity is besieged by the outbreak of the second wave of COVID-19 that is enforcing re-clamping of lockdowns across Europe and a resurgence of infections in the US (Chart 3). Consequently, the hesitant emergence of the global composite purchasing managers’ index (PMI) into expansion from July 2020 is at risk. This is already evident in the September and October composite PMI for major European economies, which have edged down from the levels registered in July, with some countries even falling back in contraction, primarily on account of the weakening services sector activity (Chart 4). While the global composite PMI increased to 53.3 in October from 52.5 a month ago, struggling consumer-facing industries amidst re-imposed restrictions remain major challenge for full-paced recovery. This could adversely impact the rejuvenation of global trading activity that was underway in Q3 of 2020 - the UNCTAD estimated the decline in world trade to have eased to (-) 5 per cent in Q3 from (-) 19 per cent in Q2 on year-on-year (y-o-y) basis. Consequently, the upward revision of the projection of world merchandise trade volume for 2020 by the World Trade Organisation (WTO) from (-) 12.9 per cent made in April to (-) 9.2 per cent in October is confronted with headwinds. Already, crude oil prices have started losing steam since mid-September on fears of the second wave; at US$ 40.5 per barrel in October, they traded 0.6 per cent below their level a month ago. While base metal prices edged up for the sixth consecutive month on the back of re-stocking by China, gold prices remained elevated on safe haven demand as risk aversion pervaded global financial markets, although eased marginally in October on strong dollar. These developments accentuate the significant downside risks to the recent upward revisions to global output forecasts cited by the International Monetary Fund (IMF) in its October 2020 World Economic Outlook (Table 2). 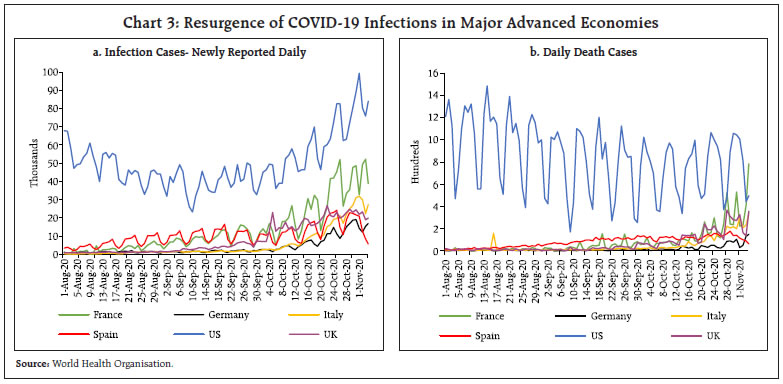
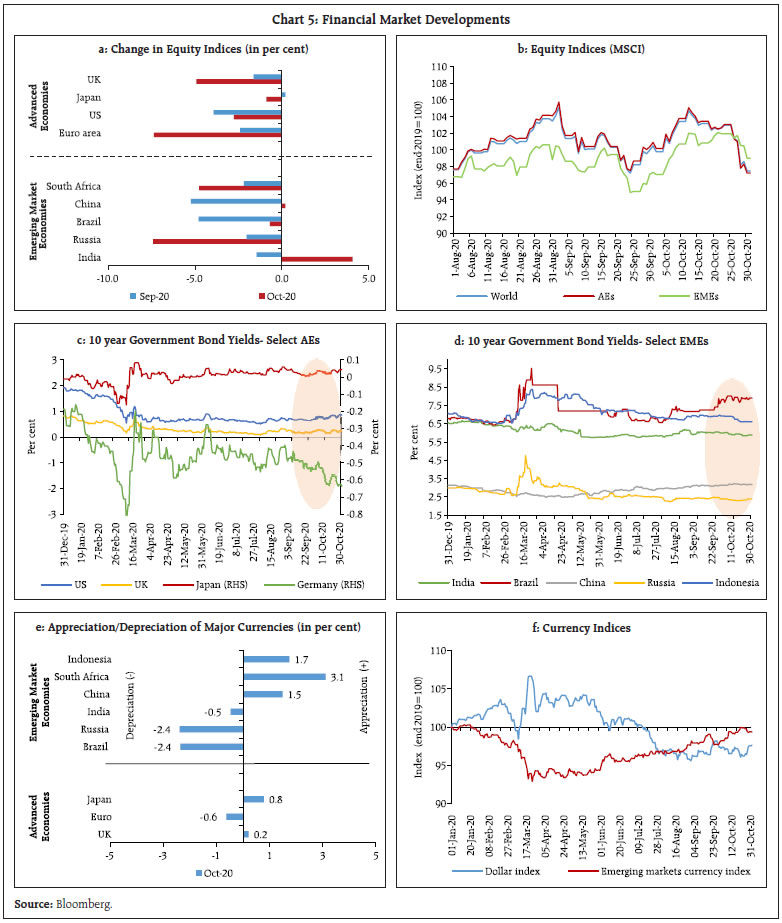
 Global equity markets have tumbled, forced into correction by the COVID resurgence and uncertainty surrounding prospects of policy support (Chart 5a and 5b). Global bond markets traded mixed, reflecting country-specific idiosyncratic factors (Chart 5c and 5d). In the currency markets, the US dollar though strengthened marginally by 0.2 per cent in October, on cumulative year-to-date basis it depreciated by 2.4 per cent up to the month under review. For the emerging market (EM) currencies – the Morgan Stanley Capital International Emerging Markets (MSCI-EM) has depreciated by 0.6 per cent on year-to-date basis, notwithstanding an appreciation of 1.3 per cent witnessed in October (Chart 5e and 5f). The IMF’s October Global Financial Stability Report pointed out that financial vulnerabilities from stretched valuations in equity markets, growing corporate debt, and visceral fragilities in banks and the nonbank financial sector are rising, putting medium-term macro-financial stability and growth at risk. The IMF’s Fiscal Monitor warned that sovereign debt is at historically high levels at which a debt crisis might be inevitable without prompt and decisive policy action for many low-income countries and some emerging market economies. 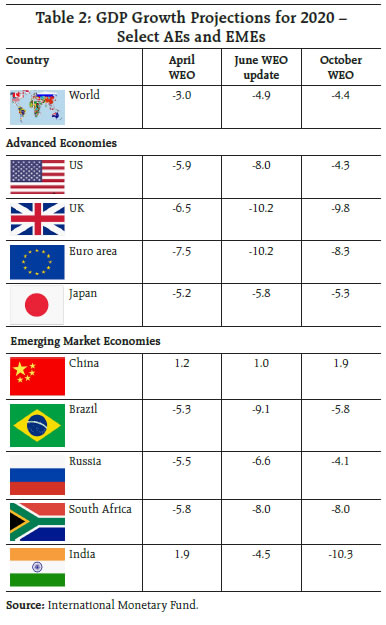
 III. Domestic Developments Contrary to global developments, there are growing signs of the receding of the health crisis in India and this has provided confidence and courage to people to emerge out of containment and engage in economic activity within norms of social distancing, masks and sanitisation. Since mid-September, India is bending the COVID curve. There has been a sequential decline in the new cases that has been sustained through October. New cases in terms of seven-day averages or the case trajectory has dropped from 93,180 on September 18 to 46,062 on October 31. The recovery rate2 has crossed 90 per cent. Daily recoveries in October are more than new cases. The doubling rate3 has increased to around 120 days from 3.7 days when the lockdown was imposed on March 25. The slanting down of the curve has encouraged authorities to progressively unlock the economy (Chart 6). La Nina conditions prevailing over the Pacific Ocean have imparted an early nip in the air and with it a rising optimism as festivities begin. There is a growing confidence that even if there is a second wave, the precipitous plunges of Q1:2020-21 may not recur because the brunt of the impact on contact-dependent industries and services has happened, and they are quickly adapting to a virtual normal. Moreover, extraordinary policy measures have put a floor under the economy. A trade-off between lives lost and livelihoods cannot be allowed any longer by allowing the virus to spread. The key is to ignite new sources of optimism and dispel contagious pessimism. In the time of COVID-19 and social distancing, signs of movement have become scarce and sought after, including looking for them from outer space. The Google mobility index4, which charts people’s movements through satellite imaging by geography and across different categories of activity, indicates that in October, movement has increased around groceries, pharmacies and residential places above pre-COVID levels but remained lower at workplaces, areas of recreation and around retail shops. These signs are corroborated by the Apple mobility index, which has moved past its baseline set on January 13, 2020, led by the southern cities (Chart 7). Movement of goods also increased in October, as reflected in an increase y-o-y of 21.4 per cent in the issuance of e-way bills – intra-state by 23.3 per cent and inter-state by 18.8 per cent. Aggregate Demand Indicators of aggregate demand are still arriving, but there are indications of a pick-up as the festival season gathers intensity. In October, electricity consumption increased by 11.5 per cent on a y-o-y basis for the second successive month after remaining in contraction over the year so far. The consumption of petrol and diesel also emerged out of contraction and posted growth rates of 4 per cent and 6.6 per cent, respectively. Sales of consumer durables have surged across categories such as smartphones, consumer electronics and automobiles. E-commerce platforms recorded an acceleration of 50 per cent in sales. Mirroring these indicators of the revival in domestic spending, collections under the goods and services tax (GST) broke through the ₹1 lakh crore mark in October for the first time in the financial year, a 10.2 per cent increase y-o-y (Chart 8). The optimism is also exuded in the September 2020 round of the Reserve Bank’s consumer confidence survey (CCS) where households are more confident for the year ahead, with expectations of improvement in general economic situation, employment conditions and income scenario during the coming year. 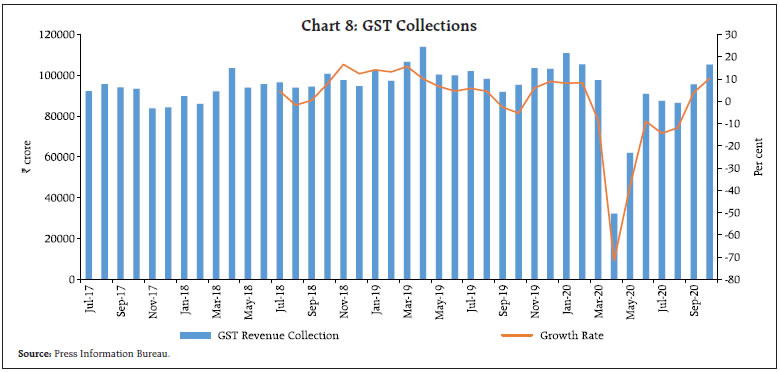 This positive sentiment is also boosted by a brightening employment scenario. According to the Centre for Monitoring the Indian Economy (CMIE), the unemployment rate has receded almost continuously from a high of 23.5 per cent in April 2020 to 7 per cent in October, with 7.2 persons in every 100 remaining unemployed in urban areas, down from 25 in every 100 unemployed in April. In the rural sector, employment demanded by households under Mahatma Gandhi National Rural Employment Guarantee Act (MGNREGA) expanded by 91.3 per cent in October, indicating that people are quickly restoring lost livelihood. Daily movements of sea-bound vessels at 13 major ports point towards a contraction in export growth after a rebound that commenced in September, and this is corroborated by information on processing of export documents at customs frontiers and authorised dealer banks (Chart 9). Meanwhile, import demand is posting a shallower contraction on the basis of document processing. Preliminary data on India’s merchandise trade for October 2020 released by the Ministry of Commerce and Industry reveal that exports at US $ 24.8 billion declined by 5.4 per cent y-o-y, against an acceleration of 6.0 per cent in the previous month. While oil exports registered a contraction of 53.3 per cent, non-oil exports accelerated by 1.8 per cent, led by agricultural commodities and drugs and pharmaceuticals. The decline in imports continued for the eighth consecutive month, although with improving demand conditions, the pace of contraction eased to 11.6 per cent in October from 19.6 per cent a month ago. Consequently, the trade deficit widened to US $ 8.8 billion in October 2020, the highest in the current financial year (Chart 10). Aggregate Supply Aggregate supply conditions have posted a marked improvement in the agricultural and manufacturing sectors, while contact-intensive services are still lagging, indicative of a multi-speed recovery.
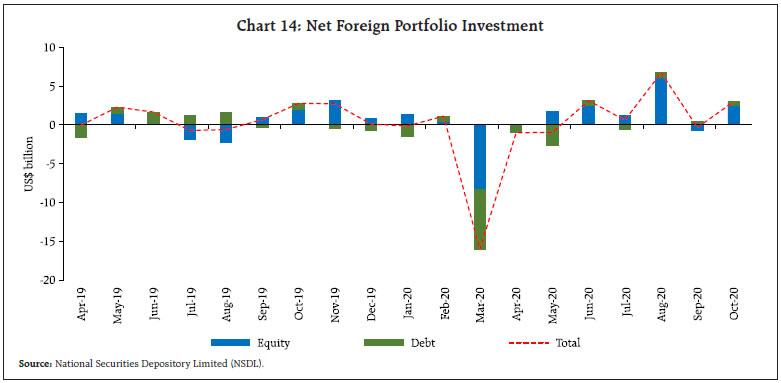
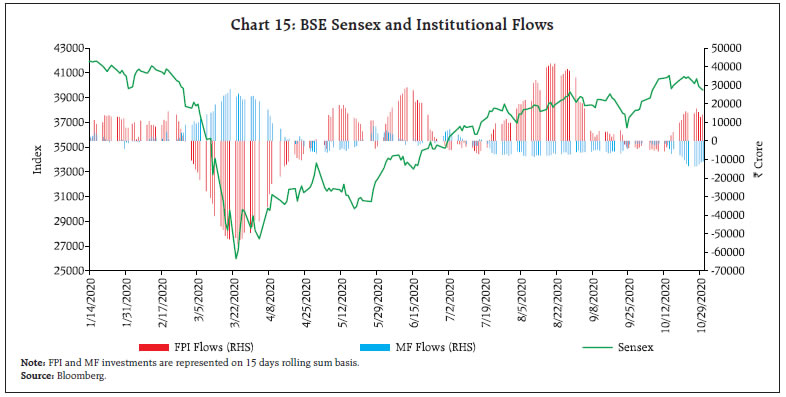
In the agriculture sector, the exceptionally delayed withdrawal of the south west monsoon has created congenial soil and reservoir conditions for the forthcoming rabi sowing season. As on November 6, 2020, overall rabi acreage stood at 100.9 lakh hectares, 18.8 per cent higher as compared to the previous year. Meanwhile, by the end of October, kharif rice procurement was 24.6 per cent higher than a year ago, taking stocks to a level of 2.6 times above the buffer norms. The record wheat procurement resulted in stocks 2.1 times the buffer norms. Overall subsidised foodgrains distribution under the National Food Security Act was 63.3 per cent higher than a year ago by the end of October due to free distribution under Pradhan Mantri Garib Kalyan Yojana. Turning to industrial activity, India’s manufacturing PMI surged in a broad-based acceleration to its highest level in a decade at 58.9 in October, driven mainly by new orders and output amidst restocking of inventories (Chart 11). The future output index rose to 64.3, its highest in the past 50 months. Manufacturing firms responding to the Reserve Bank’s industrial outlook survey (IOS) expect that the upturn exhibited in Q2:2020-21 would strengthen in Q3 with improvements in production, capacity utilisation and order books. There are expectations of a recovery in external demand conditions and job landscape, with optimism on the part of availability of finance. In services where activity had virtually collapsed under the impact of the pandemic, several indicators are rapidly turning around with new business models and work ethics. The services PMI for October at 54.1 emerged out of the contraction zone for the first time since the outbreak of COVID-19, driven by an increase in new work intakes. Among specific categories of services, construction activity is picking up as evident in rising steel consumption, although information on cement production will conclusively endorse this improvement. Trading activity is above pre-COVID levels as reflected in GST collections and rising e-way bill volumes. Transportation has been boosted by a 15.4 per cent jump in railway freight traffic across various categories of commodities, and passenger traffic is following in its wake, albeit, with lagged responses as lockdowns ease. Car manufacturing majors are reporting double digit growth in response to festival demand and restocking as well as shift in preferences towards owned vehicles over public transportation. The ebullience is not, however, shared by dealerships. According to the Federation of Automobile Dealers Associations (FADA), sales of two-wheelers and passenger vehicles declined by 27 per cent and 9 per cent, respectively, in October 2020. The decline was sharper in the case of commercial vehicles and three-wheelers, which registered a contraction of 30 per cent and 65 per cent, respectively. 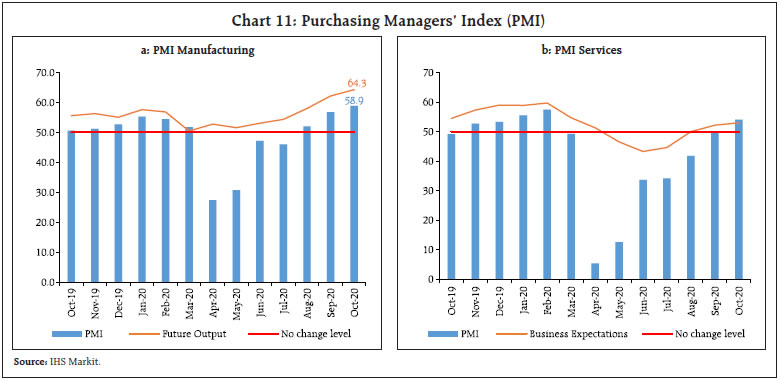 Inflation The official release of the consumer price index (CPI) for October by the NSO is slated for November 12, 2020. Information on retail prices on a daily basis from the Ministry of Consumer Affairs, Food and Public Distribution (Department of Consumer Affairs) indicates that food price pressures that have persisted since the beginning of the financial year continued unabated in October across the board, barring prices of cereals, tomato and sugar. In particular, inflation sensitive prices of onions and potatoes have ruled at unrelentingly high levels during the month (Table 3). In the non-food category, excise duties and state taxes on petroleum products have kept retail inflation in this group elevated, with second round effects evident in prices of other goods and services. Some moderation in pump prices of petrol and diesel was observed in October tracking international prices5. Increase in the cost of doing business due to additional sanitisation-related expenditures, social distancing norms and labour shortages have also played a role in keeping core inflation firm. Cost-push pressures are likely to have been somewhat mitigated by the progressive easing of lockdowns, removal of restrictions on inter-state movements of goods and migration of labour back to cities. In the manufacturing PMI for October, input prices moved up, but remained lower than historical standards. Consequently, output prices recorded only moderate increases, pointing to still weak pricing power. Taking these factors into account, a poll of professional forecasters6 pointed to a likely persistence of elevated inflationary pressures in October, with a median CPI inflation projection of 7.3 per cent. | Table 3: DCA Essential Commodity Prices | | S. no | Commodities | Weight in CPI | ₹ per Kg. | Month-over-month (per cent) | | Sep-19 | Oct-19 | Sep-20 | Oct-20 | Sep-19 | Oct-19 | Sep-20 | Oct-20 | | 1 | Rice | 4.4 | 32.4 | 33.1 | 34.7 | 34.9 | 1.1 | 2.3 | 0.6 | 0.4 | | 2 | Wheat & Atta | 2.6 | 27.7 | 28.8 | 29.5 | 29.2 | 0.2 | 3.8 | -0.5 | -1.2 | | 3 | Gram Dal | 0.3 | 65.6 | 66.3 | 68.7 | 72.5 | -0.5 | 1.0 | 3.5 | 5.6 | | 4 | Tur/Arahar Dal | 0.8 | 85.9 | 86.6 | 94.9 | 104.6 | 1.0 | 0.7 | 2.0 | 10.2 | | 5 | Urad Dal | 0.3 | 74.8 | 78.4 | 99.0 | 104.0 | -0.2 | 4.9 | 0.3 | 5.0 | | 6 | Moong Dal | 0.3 | 83.4 | 84.6 | 101.8 | 102.6 | 1.3 | 1.4 | -1.7 | 0.8 | | 7 | Masoor Dal | 0.3 | 62.8 | 63.3 | 77.8 | 78.4 | 0.2 | 0.7 | 0.6 | 0.8 | | 8 | Groundnut Oil | 0.3 | 131.3 | 134.0 | 150.5 | 153.0 | 0.8 | 2.0 | 0.8 | 1.7 | | 9 | Mustard Oil | 1.3 | 109.7 | 111.2 | 126.5 | 128.6 | 0.9 | 1.4 | 1.6 | 1.7 | | 10 | Vanashpati | 0.1 | 79.6 | 80.0 | 93.3 | 94.9 | 0.4 | 0.5 | 2.1 | 1.7 | | 11 | Refined Oil (sunflower, soyabean and palm oil) | 1.3 | 89.8 | 89.9 | 105.3 | 107.2 | 1.1 | 0.1 | 3.1 | 1.8 | | 12 | Potato | 1.0 | 18.9 | 20.6 | 36.7 | 39.5 | -0.7 | 8.8 | 10.4 | 7.7 | | 13 | Onion | 0.6 | 38.3 | 47.0 | 31.6 | 50.2 | 54.3 | 22.8 | 39.5 | 59.0 | | 14 | Tomato | 0.6 | 31.2 | 38.6 | 51.8 | 45.4 | -19.4 | 23.7 | 13.3 | -12.4 | | 15 | Sugar | 1.1 | 39.2 | 39.4 | 40.4 | 40.2 | 1.2 | 0.6 | 0.4 | -0.4 | | 16 | Gur | 0.1 | 45.2 | 46.2 | 49.5 | 49.3 | 1.4 | 2.2 | 0.4 | -0.2 | | 17 | Milk | 6.4 | 44.5 | 44.9 | 46.8 | 46.9 | 2.2 | 0.9 | -0.4 | 0.1 | | 18 | Tea Loose | 1.0 | 213.6 | 215.3 | 228.3 | 231.2 | 0.6 | 0.8 | 1.9 | 1.3 | | 19 | Salt | 0.2 | 15.5 | 15.4 | 16.5 | 16.5 | 0.5 | -0.3 | 1.0 | 0.0 | | 20 | Weighted average price (1 to 19) | 22.9 | 55.8 | 57.0 | 62.2 | 63.5 | 1.4 | 2.1 | 1.8 | 2.1 | | Source: Department of Consumer Affairs, GoI and RBI staff estimates. | IV. Financial Conditions System liquidity expanded further in October 2020 as average daily net absorptions under the liquidity adjustment facility (LAF) increased to ₹4,46,802 crore, despite a sizeable build-up in Government of India (GoI) cash balances. Currency in circulation (CiC), which was somewhat muted in September, picked up in October with the onset of the festival season and drained some liquidity from the system. In terms of liquidity management, liquidity was injected through three open market operation (OMO) purchases, while transient liquidity movements were managed through LAF operations. Monetary and credit conditions moderated through 2020-21, with upward pressures on inflation in spite of muted demand conditions. Reserve money adjusted for the first round impact of changes in the cash reserve ratio (CRR) increased by 16.3 per cent on y-o-y basis as on October 30, 2020 (14.7 per cent a year ago), mainly driven by a high growth in CiC on the components side and net foreign assets (NFA) on the sources side. This was instrumental in supporting money supply (M3) growth at 11.6 per cent as on October 23, 2020 (10.6 per cent a year ago). Bank credit to commercial sector remained subdued at 5.1 per cent as on October 23, 2020 as against 8.9 per cent a year ago; however, aggregate deposits registered a robust growth of 10.0 per cent (Chart 12). Reflecting the impact of targeted long-term repo operations (TLTROs), scheduled commercial banks’ investments in commercial paper, bonds/debentures and shares of corporate bodies during the year 2020-21 increased by ₹15,561 crore as against a decline of ₹24,495 crore during the same period last year. In consonance with the accommodative stance of monetary policy, the Reserve Bank announced On Tap TLTROs with tenors of up to three years for a total amount of up to ₹1,00,000 crore at a floating rate linked to the policy repo rate. Liquidity availed by banks under the scheme are to be deployed in corporate bonds, commercial paper and non-convertible debentures issued by the entities in agriculture, agri-infrastructure, secured retail, micro, small and medium enterprises (MSMEs), and drugs, pharmaceuticals and healthcare, over and above the outstanding level of their investments in such instruments as on September 30, 2020. Funds availed under the scheme can also be used to extend bank loans and advances to these sectors. The measure is aimed at addressing sector-specific liquidity constraints to aid recovery by improving funding conditions for sectors which have multiplier effects on growth. The Reserve Bank decided to conduct OMOs in State Development Loans (SDLs), as a special case during the current financial year, with a view to improving liquidity and facilitate efficient pricing of SDLs. The first such OMO in SDL for ₹10,000 crore was conducted on October 22, 2020. Thus, durable liquidity amounting to ₹66,305 crore7 has been injected through outright OMOs in October. Moreover, banks can now hold fresh acquisitions of SLR securities (since September 1) under the held to maturity (HTM) category up to an overall limit of 22 per cent (increased from 19.5 per cent) of Net Demand and Time Liabilities (NDTL) till March 31, 2022. 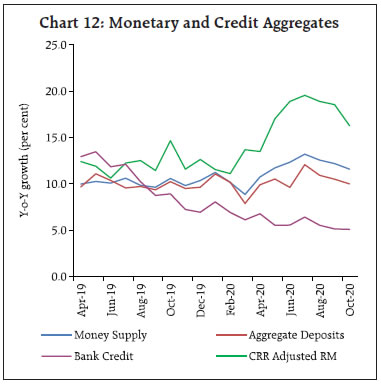 These abundant liquidity conditions permeated money markets during October 2020. In the overnight uncollateralised segment, the call money rate traded around the lower bound of the LAF corridor and even dipped below the reverse repo rate in the last week of the month. In the collateralised segments – market repo and tri-party repo – rates trailed below the call rate by 18 basis points and 20 basis points, respectively. In the near-term segments, i.e., certificates of deposit and 91-day treasury bills, rates remained at sub-reverse repo levels (averaging 3.30 per cent and 3.23 per cent, respectively) while discount rates on commercial paper were barely 25 basis points above the LAF reverse repo rate (Chart 13). The expansion of liquidity also resulted in softening of corporate bond yields as well as risk premia as reflected in moderation of corporate bond spread over the risk-free rate of corresponding maturity across the rating spectrum (Table 4). The transmission of policy repo rate changes to deposit and lending rates of scheduled commercial banks has improved reflecting combined impact of liquidity surplus, the accommodative monetary policy stance, the introduction of external benchmark-based pricing of loans, weak credit demand conditions and lagged impact of policy rate cuts. From March to October 2020, the 1-year median marginal cost of funds-based lending rate (MCLR) has declined by 90 basis points (bps), while reduction in median term deposit rate has been of the order of 137 bps. 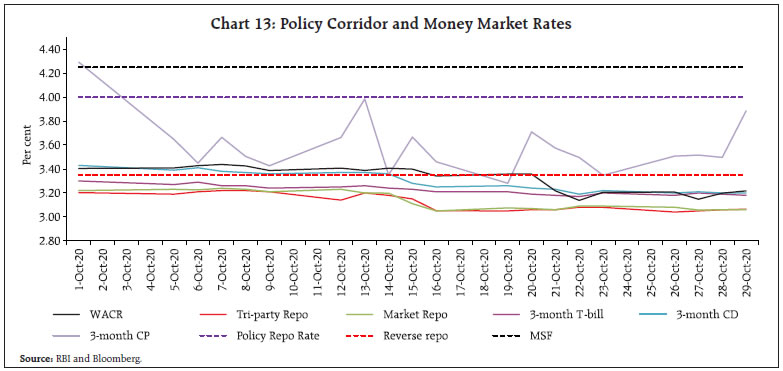 In the bond markets, the benchmark 10-year yield in the government securities segment traded with a soft bias relative to the preceding month, with sentiment lifted by an increase in the size of OMOs by the Reserve Bank and the conduct of OMOs in SDLs for the first time. In the corporate bond segment, spreads on 5-year AAA bonds narrowed to 22 bps, 28 bps lower than a month ago. At the lowest end of the rating spectrum, i.e., BBB- too, spreads shrank marginally. Resource mobilisation through private placement of corporate bonds moderated to ₹62,331 crore during October 2020 from ₹64,389 crore during September 2020. Foreign portfolio investors brought in flows of US $ 0.4 billion into debt markets (government securities and corporate bonds taken together) during the month (Chart 14). There were also inflows of US $ 0.1 billion through the voluntary retention route (VRR). Irrational exuberance in domestic equity markets extended into October 2020, driven by monetary and fiscal policy measures undertaken in the context of the pandemic as well as better than expected corporate earnings in Q2:2020-21. Banking, finance and information technology (IT) stocks powered the surge. The benchmark index (SENSEX) crossed a seven-month high in the first week of October, and rallied further in ensuing days, recouping 52 per cent of the losses suffered on March 23 (Chart 15). Foreign portfolio investors turned net buyers during October as against net sales a month ago, bringing in US $ 2.5 billion to the equity segment. In contrast, mutual funds were net sellers during the month on account of redemption pressures. | Table 4: Financial Markets - Rates and Spread | | | Interest Rates
(per cent) | Spread in bps
(over corresponding risk-free rate) | | Instrument | As on September 30, 2020 | As on October 29, 2020 | Variation
(in bps) | As on September 30, 2020 | As on October 29, 2020 | Variation
(in bps) | | (1) | (2) | (3) | (4 = 3-2) | (5) | (6) | (7 = 6-5) | | CP (3-month) | 4.32 | 3.89 | -43 | 105 | 69 | -36 | | Corporate Bonds | | | | | | | | (i) AAA (1-yr) | 4.35 | 4.00 | -35 | 47 | 36 | -11 | | (ii) AAA (3-yr) | 5.35 | 4.90 | -45 | 43 | 28 | -15 | | (iii) AAA (5-yr) | 6.10 | 5.60 | -50 | 50 | 22 | -28 | | (iv) AA (3-yr) | 6.13 | 5.84 | -29 | 121 | 122 | 1 | | (v) BBB-minus (3-yr) | 10.10 | 9.79 | -31 | 518 | 517 | -1 | | 10-yr G-sec | 6.01 | 5.89 | -12 | - | - | - | | Sources: CCIL; F-TRAC; FIMMDA; and Bloomberg. |
 In the foreign exchange market, the Indian rupee (INR) depreciated modestly against the US dollar in line with other emerging market currencies, although it ended the month 1.9 per cent above its level at the end of March 2020. Improvement in underlying fundamentals such as a sharp narrowing of the trade deficit and recovery in portfolio flows buoyed market sentiment. In terms of the 36-currency trade-weighted real effective exchange rate, the INR depreciated by 0.2 per cent in October from its level a month ago. India’s foreign exchange reserves rose to US $ 560.7 billion, equivalent of 16.4 months of imports and fully covering India’s outstanding external debt at the end of June 2020 (Chart 16). In the payment space, digital transactions on the unified payment interface (UPI) picked up both in volume and value. In October, total transactions crossed the 2 billion mark and amounted to ₹3.9 lakh crore in terms of value. Immediate payment service (IMPS) retail transactions also rose by 14 per cent in volume and by 10.4 per cent in value over September 2020. In the National Electronics Funds Transfer (NEFT) system, there was an increase of 11.9 per cent in volume and 3.2 per cent in value. Turning to large value payments, there was an increase of 6.2 per cent in volume terms in the real time gross settlements (RTGS) but a contraction of 10.5 per cent in value (Table 5). 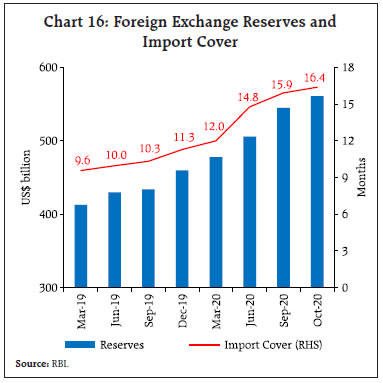
| Table 5: Payment Transactions in 2020-21 | | (in ₹ crore) | | | RTGS | NEFT | UPI | IMPS | | Apr-20 | 64,43,653 | 13,06,406 | 1,51,141 | 1,21,141 | | May-20 | 70,41,869 | 14,81,750 | 2,18,392 | 1,69,402 | | Jun-20 | 86,51,978 | 19,06,586 | 2,61,835 | 2,06,951 | | Jul-20 | 83,35,279 | 19,63,113 | 2,90,538 | 2,25,775 | | Aug-20 | 72,92,380 | 19,30,552 | 2,98,308 | 2,35,137 | | Sep-20 | 94,89,066 | 21,65,515 | 3,29,032 | 2,48,662 | | Oct-20 | 84,96,046 | 22,35,389 | 3,86,107 | 2,74,645 | | Source: National Payments Corporation of India (NPCI). | V. Conclusion Incoming data for the month of October 2020 have brightened prospects and stirred up consumer and business confidence. With the momentum of September having been sustained, there is optimism that the revival of economic activity is stronger than the mere satiation of pent-up demand released by unlocks and the rebuilding of inventories. If this upturn is sustained in the ensuing two months, there is a strong likelihood that the Indian economy will break out of contraction of the six months gone by and return to positive growth in Q3:2020-21, ahead by a quarter of the forecast provided in the resolution of the monetary policy committee on October 9, 2020. In this context, however, it is prudent to recognise the formidable downside risks confronting the prospects of the recovery. The foremost is the unrelenting pressure of inflation, with no signs of waning in spite of supply management measures such as the imposition of stock limits on onion traders, imports of potatoes and onions (without fumigation) and a temporary reduction in import duties on pulses. There is a grave risk of generalisation of price pressures, unanchoring of inflation expectations feeding into a loss of credibility in policy interventions and the eventual corrosion of the nascent growth impulses that are making their appearance. The second major risk to the economy stems from the global economy now at risk from the second wave of COVID-19. Should external demand collapse again as commodity prices seem to foretell, the recent recovery in exports could become stillborn. Lurking around the corner is the third major risk – stress intensifying among households and corporations that has been delayed but not mitigated, and could spill over into the financial sector. If the green shoots manage to survive these risks and take root, the key question is what will be the drivers of the recovery? We live in challenging times.
|