An Economic Activity Index for India constructed from twenty-seven monthly indicators using a dynamic factor model suggests that the economy rebounded sharply from May/June 2020 with the reopening of the economy, with industry normalising faster than contact-intensive service sectors. The index tracks GDP dynamics closely and nowcasts GDP growth at (-)8.6 per cent in Q2:2020-21. Introduction The health emergency created by COVID-19 led to a sudden stop in economic activity all over the world. Supply disruptions due to containment measures were magnified by large-scale demand destruction from employment and income losses, weakening of consumer and business confidence, heightened uncertainties, contraction in global trade and tourism and behavioural changes like voluntary social distancing. In India, with more than 83 lakh infections including 1.2 lakh recorded deaths due to COVID-19 as on November 4, 2020, the economy took a severe hit with GDP for Q1:2020-21 declining by 23.9 per cent year-on-year (y-o-y). In a period of heightened volatility, it becomes difficult to ascertain the current and future outlook of the economy posing difficult challenges for forward-looking policy. Conflicting signals emerging from diverse indicators may point to different directions for the underlying state of the economy. The fact that official GDP estimates are available with a lag of almost two months does not help either. In a fast-changing environment, time is of essence and delays in the availability of official statistics pose constraints on optimal policy decisions. In this background, high-frequency indicators of economic activity, which are available with shorter lags offer an alternative for real-time tracking of the economy to aid forward-looking policy. Accordingly, central banks and international organisations rely on a host of continuously flowing information from leading and concurrent activity indicators to gauge the underlying state of the economy on a real-time basis. Recent developments in econometric modelling and computational power have supported state-of-the-art, real-time and continuously updating frameworks that synthesise information available in a variety of economic indicators to predict the current dynamics of GDP. These models use sophisticated econometric methods, machine learning tools and artificial intelligence to glean information out of diverse indicators to identify consistent economic patterns. Many central banks have developed “nowcasting” models, which are used to predict the present, the very near future and the very recent past almost on a real time basis using regular high-frequency data releases on activity indicators (Giannone, Reichlin and Small (2008)). In this article, an attempt is made to construct an Economic Activity Index (EAI) for India and use the index to nowcast the real GDP for Q2:2020-21, which is the main motivation of this study, besides evaluating the underlying nowcasting model in real time to validate its robustness so that it can be regularly updated for informing policy decisions.1 Further, sectoral indices are constructed by using indicators representing industry, services, global and miscellaneous activities to identify sectoral developments in the aftermath of COVID disruptions. The remainder of this article is organised as follows. Section II contains a brief literature review. Section III explains the data and methodology used in the article. Section IV presents the main findings and Section V concludes. II. Literature Review The literature on exploiting many economic variables to analyse fluctuations in aggregate economic activity dates back to the seminal work on measurement of business cycles (Burns and Mitchell, 1946). The business cycle itself is the co-movement among many economic variables and pervasiveness of fluctuations across sectors, which occur with a rough synchronism (Zarnowitz, 1991). In this vein, the introduction of more formal and mathematically precise models to explain business cycles is also regarded as a seminal contribution. For this purpose, an “unobserved single index” or “dynamic factor” is estimated, which is affected by two stochastic components – one, the unobserved single index driving the co-movement across indicators and two, the idiosyncratic component and measurement errors. The unobserved single index is interpreted as the state of the economy based on four series: industrial production; real personal income less transfer payments; real manufacturing and trade sales; and employee-hours in non-agricultural establishments (Stock and Watson, 1989). The use of dynamic factor models to nowcast low frequency variables like GDP have recently becme popular (Giannone, Reichlin and Small, 2008). Central banks are also increasingly relying on nowcasting models for near-term projections of key variables. The nowcasting model of the Federal Reserve Bank of New York builds on these contributions and shows that additions and updations of high-frequency data relevant to a quarter contribute to an improvement in nowcasting performance (Bok et al, 2017). On the other hand, the nowcasting model of the Federal Reserve Bank of Atlanta called GDPNow uses a bridge equation approach to map monthly source data into GDP sub-components, mimicking the methods used by the US Bureau of Economic Analysis to estimate real GDP growth (Higgins, 2014). The Bank of England’s GDP nowcast represents the Monetary Policy Committee’s estimate of economic growth in the current quarter prior to the release of the official data (Anesti et al, 2017). Overall, central banks’ nowcasts are informed by a suite of statistical models, superimposed by careful inference and judgement, reflecting all available high-frequency data on economic activity, surveys and financial markets. Although still in its infancy, the nowcasting literature has expanded to incorporate the emerging market economies’ (EMEs) case. This presents unique challenges in terms of lack of information on key macroeconomic variables (for example, employment and income) in the form of data gaps and missing values, small sample size and excessive volatility. Dynamic factor models have been employed to nowcast real GDP growth for Brazil, Russia, India, China, and Mexico (BRIC+M) and found to be reliable (Dahlhaus et al, 2017). Another notable contribution with a focus on India finds that predictions improve when additional variables from more timely international data sources are included (Bragoli and Fosten, 2017). A bridge equation approach by using the information in monthly indicators for predicting the current quarter GDP has been employed in the Indian case (Bhattacharya et al, 2011). III. Data and Methodology The study uses twenty-seven monthly indicators representing industry, services, global and miscellaneous activities to gauge the underlying state of the economy (Table 1).2 The sample ranges from April 2004 to September 2020. These indicators, directly or indirectly, cover a wide spectrum of domestic activities. They are released in a staggered manner throughout a month (Annex Table A(iii)). | Table 1: High-Frequency Indicators | | Industry | Services | Global | Miscellaneous | | IIP | Domestic air passenger traffic | US Industrial Production | Gross taxes | | Automobile sales (Total) | Domestic air cargo traffic | Baltic Dry Index | Job Speak Index | | Non-oil exports | Port cargo traffic | US Purchasing Managers' Index - Mfg. | Non-food credit | | Non-oil-non-gold imports | Railway freight | OECD Composite Leading Indicator | Broad Money (M3) | | Purchasing Managers' Index - Mfg. | Foreign tourist arrivals | US payrolls | Consumer Price Index – non-food | | Power supply | Purchasing Managers' Index - Serv. | | Crude prices (average of Brent, Dubai and WTI) | | Tractor sales | Fuel consumption | | | | Cement production | | | | Steel consumption | | | Dynamic Factor Model The recent advances in time-series econometrics have offered automated platforms to distil information from a plethora of indicators. Essentially, it involves solving a signal extraction problem of separating the pervasive co-movement in fluctuations (the signal) from idiosyncratic and measurement errors (the noise). The dynamic factor model provides a suitable approach to capture common fluctuations across macroeconomic indicators in a few common factors (Bok et al, 2017). The general specification of a dynamic factor model is as follows: 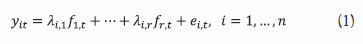 where yi is the indicator, fj is the latent common factor and λij is the factor loading of factor fj on indicator yi.3 The idiosyncratic component of the indicator is captured by the eit term. Thus, the observed movements in any indicator comprise of two unobserved components – a common component driven by common factors, and an idiosyncratic component specific to each indicator. The dynamic factor model is described in a state-space form where (1) is the observation equation and the autoregressive processes underlying the common factors and idiosyncratic errors represent transition equations. The model is estimated using the Kalman filter and the expectation-maximisation (EM) algorithm (Bok et al, 2017). All indicators are expressed as standardised y-o-y percentage changes. The model described above is considered particularly suitable for monitoring macroeconomic conditions in real time as it provides flexibility to incorporate data with mixed frequency, missing values and non-synchronous releases. The Kalman filter algorithm uses the predicted (or expected) value of the indicator to estimate the dynamic factor and other model parameters, which are recursively updated if the actual value of the indicator turns out to be different from the predicted value. Thus, the Kalman filter provides a convenient framework for handling irregularities in the data (Bok et al, 2017; Banbura et al, 2013). Single common factors are estimated by first taking all twenty-seven indicators together and then separately for the subset of indicators representing industry, services, global and miscellaneous activities. The estimated single common factor ft is then used to nowcast the current quarter GDP growth using a bivariate regression accounting for serial correlation in errors.4 The model specification is given below. The model specification implies that the conditional forecast (or nowcast) of GDP growth is driven by both the contemporaneous dynamic factor ft and past error. IV. Nowcasting Results The dynamic common factor, which is termed the overall index of economic activity, is presented in Chart I. It is observed that the index captures major economic events such as the global financial crisis (GFC), the subsequent recovery and the recent deceleration starting from 2018-19. Further, it suggests that the collapse in activity in the wake of COVID-19 was much sharper than during the GFC. Focusing on the recent months, it is seen that after plunging to -6.4 in April in the wake of the lockdown, the index gradually recovered to -2.1 in September 2020. The rebound was sharper in May and June as the economy reopened after the lockdown, but turned out to be somewhat slower in July-September. To underline sectoral variations, separate indices are constructed for industry, services and global activities (Chart II). Focusing on the recent months (Chart III), it is observed that while the decline in both industry and service activities was synchronous and of equal magnitude in the wake of the lockdown, the recovery has been more rapid for industry and much slower for services. Thus, the analysis suggests a two-speed recovery with contact-intensive service sectors (e.g., retail trade, transport, hotels and restaurants, and recreation) showing sluggish recovery in the face of continuing health risks.5 Further, in contrast to the domestic industry and service indices, the global index declined to a lesser extent and seems to have recovered better, despite some tapering in July-September. 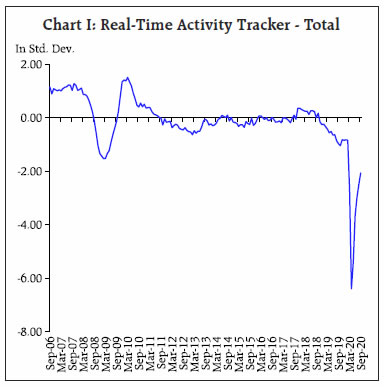
 The overall index of economic activity is used to nowcast GDP growth using a bivariate regression model described in equations 2 and 3 in Section III (Table 2). Model 1 is the preferred specification with a reasonably high adjusted R-squared and no evidence of residual autocorrelation. The coefficient on activity index is statistically significant, suggesting that the index significantly explains GDP dynamics. Using the estimated coefficients and current quarter index of activity, GDP growth nowcast for Q2:2020-21 is (-)8.6 per cent y-o-y (Chart IV).6 The 90 per cent confidence interval for the nowcast is (-)4.8 – (-)12.3 per cent. Further, Models 3, 4 and 5 provide estimates for non-agriculture, industry and services GDP separately and suggest a higher in-sample fit for the services sector; for industry, the Q-stat suggests remaining higher order residual autocorrelation. Nonetheless, the individual activity indices for industry and services significantly explain movements in sectoral GDPs (Chart V and VI). | Table 2: Regression Estimates | | Dependent Variable (Y-o-Y) | GDP | GDP- Non- Agri. | GDP- Industry | GDP- Services | | (1) | (2) | (3) | (4) | (5) | | Activity Index - Total | 5.568 | 4.410 | 6.081 | | | | | (0.174) | (0.259) | (0.133) | | | | Activity Index - Industry | | | | 6.952 | | | | | | | (0.321) | | | Activity Index - Services | | | | | 5.418 | | | | | | | (0.181) | | AR (1) | 0.641 | | 0.751 | 0.600 | 0.612 | | | (0.104) | | (0.089) | (0.109) | (0.128) | | Constant | 6.597 | 6.767 | 7.086 | 6.171 | 7.715 | | | (0.603) | (0.241) | (0.982) | (0.935) | (0.509) | | Adjusted R-squared | 0.855 | 0.820 | 0.862 | 0.726 | 0.873 | | DW Stat | 1.913 | 1.155 | 1.679 | 2.160 | 2.055 | | Q-statistics (12 lags, p-value) | 0.954 | 0.011 | 0.233 | 0.000 | 0.448 | | Note: Figures in parentheses are standard errors. |
V. Conclusion Sharp fluctuations in economic conditions on account of COVID-19 have put a premium on swift intelligence. This entails sifting through a vast amount of continuously flowing data to identify the current state of the economy. The dynamic factor model has become a popular tool to measure the underlying state of the economy from a host of high-frequency activity indicators. Accordingly, the economic activity index constructed here is an efficient predictor of advance quarterly GDP estimates of the NSO. The recent dynamics of the index suggests that a gradual recovery in economic activity is underway since the April 2020 trough, with some moderation during July-September 2020. Sectoral indices declined synchronously in March and April, but have diverged in the recovery phase, with industry normalising faster than contact-intensive service sectors due to continuing health risks. The index tracks GDP dynamics reasonably well in the sample and offers itself for consideration in the policy matrix of coincident information in India. Following policy implications emerge from the analysis: -
India has entered a technical recession in the first half of 2020-21 for the first time in its history with Q2:2020-21 likely to record the second successive quarter of GDP contraction. -
The contraction is ebbing with gradual normalisation in activities and expected to be short-lived. -
The economic activity index can be used to gauge directional movements in GDP growth well ahead of official releases. References Anesti, N., S. Hayes, A. Moreira and J. Tasker (2017). Peering into the present: the Bank’s approach to GDP nowcasting. Quarterly Bulletin: Q2, Bank of England. Banbura, M., D. Giannone, M. Modugno, and L. Reichlin (2013). Nowcasting and the Real-Time Data Flow. In G. Elliott and A. Timmermann, eds., Handbook of Economic Forecasting, Vol. 2. Amsterdam: Elsevier- North Holland. Bhattacharya, R., R. Pandey and G. Veronese (2011). Tracking India Growth in Real Time. National Institute of Public Finance and Policy, Working Papers 2011/90. Bok, B., D. Caratelli, D. Giannone, A. Sbordone and A. Tambalotti (2017). Macroeconomic Nowcasting and Forecasting with Big Data. Federal Reserve Bank of New York Staff Reports. Bragoli, D. and Fosten, J. (2018). Nowcasting Indian GDP. Oxford Bulletin of Economics and Statistics. 80(2) 259-282. Burns, A. F. and W. C. Mitchell (1946). Measuring Business Cycle. NBER Book Series. Dahlhaus, T., J. Guénette and G. Vasishtha (2017). Nowcasting BRIC+M in real time. International Journal of Forecasting. 33(4) 915-935. Giannone, D., L. Reichlin and D. Small (2008). Nowcasting: The real-time informational content of macroeconomic data. Journal of Monetary Economics. 55(4) 665-676. Higgins, P. (2014). GDPNow: A Model for GDP “Nowcasting”. Federal Reserve Bank of Atlanta Working Paper Series 2014-7. Stock, J. and M. Watson (1989). New Indexes of Coincident and Leading Economic Indicators. Macroeconomics Annual, National Bureau of Economic Research. 4, 351-409. Zarnowitz, V. (1991). What is a Business Cycle? NBER Working Paper No. 3863, October.
Annex – Charts and Tables
| A(iii). Publication Lags in the Release of Indicators | | Indicator | Publication Lag (Approximate) | | Index of Industrial Production | 6 weeks | | Auto Sales | less than 2 weeks | | Non-oil Exports | 2 weeks | | Non-oil-non-gold Imports | 2 weeks | | PMI - Manufacturing | 1 day | | Power Supply | less than 1 week | | Tractor Sales | less than 2 weeks | | Cement Production | 1 month | | Steel Consumption | 7 weeks | | Fuel Consumption | less than 2 weeks | | Air Passenger | 3-4 weeks | | Air Cargo | 3-4 weeks | | Port Cargo | 1 week | | Rail Freight | 1 week | | Foreign Tourist | 2-3 weeks | | PMI - Services | less than 1 week | | US IIP | 1.5 month | | Baltic Dry Index | Daily (no lag) | | US PMI | 1 day | | OECD Composite Leading Indicator | more than 1 month | | US Payroll | 2 days | | Gross Taxes | 1 month | | JobSpeak Index | less than 2 weeks | | Non-Food Credit | 2 weeks | | Broad Money (M3) | 2 weeks | | CPI - Non-food | less than 2 weeks | | Crude Price | Daily (no lag) |
|