A country’s financial development hinges around the existence of deep and liquid government securities market. Spurred by reforms undertaken over the years, the gilt market in India has gained depth, liquidity and vibrancy while exhibiting resilience through periods of instability and crises, including the recent pandemic. Going forward, increasing the liquidity across tenors in the sovereign yield curve, widening the investor base and developing the derivatives market can be the focus areas to augment the assiduously built market ecosystem for government securities. Introduction A country’s financial development hinges around the existence of deep and liquid government securities market. Besides providing flexibility to the public debt manager to manage borrowing obligations and the maturity profile of public debt while minimising rollover risks, this market also determines risk-free interest rates, leading to price discovery in other segments of the market spectrum such as markets for money market instruments and corporate bonds. It also plays a critical role in facilitating the conduct of monetary policy through indirect instruments such as repos and open market operations (OMOs). Spurred by reforms undertaken over the years, the gilt market in India has gained depth, liquidity and vibrancy while exhibiting resilience through periods of instability and crises, including the recent pandemic. India’s gilt market has emerged as the third largest government bond market in Asia (Rajaram and Ghose, 2019). This article examines the development of the government securities market in India, especially in the context of policy initiatives underpinning its evolution. Section II discusses the developments in the government securities market over time, while Section III discusses these developments over space in a comparison with emerging markets (EM) peers. Section IV discusses the factors constraining the further development of the market. Section V concludes with an evaluation of potential policy solutions to carry forward the modernisation of the government securities market consistent with an economy progressively engaged in global integration. II: Market Micro-Structure The development of an efficient government securities market involves (a) the establishment of a legal architecture and regulatory framework to support issuance and trading of government securities; (b) building a potential investor base; and (c) development of market infrastructure for derivative segments that price and trade various risks (IMF and World Bank, 2001). II.1. The Legal Framework A robust legal and regulatory framework for debt management facilitates discipline, transparency, and accountability for securities issuance; and for fostering market development with sound enforceable supervisory practices (IMF and World Bank, 2001). The RBI Act, 1934, invests the Reserve Bank with the responsibility of management of public debt of the Government of India and (by agreement) of State Governments. The Public Debt Act, 1944 and the Government Securities Act, 2006 provide the legal framework for the issuance and servicing of government securities, depository services related to government securities and overall management of public debt. In 2006, the RBI Act was amended to give explicit regulatory powers to the Reserve Bank over government securities, derivatives, and money market instruments. Furthermore, the Payment and Settlement Systems (PSS) Act, 2007 empowers the Reserve Bank to regulate and supervise payment and settlement systems of the country, thereby providing a legal basis for multilateral netting, settlement finality and guaranteed settlement, all of which are critical for efficiency of the gilt market. Within this overarching statutory framework, the Reserve Bank has been issuing regulations to regulate and develop the government securities market. To strengthen the debt issuance framework through better management and distribution of auction risk, guidelines for “When, as and if issued” (or ‘When Issued’ (WI)) trading in government securities were issued (2006). In the same year directions to allow short sale1 in government securities were issued to facilitate expression of two-way views on interest rates and improve price discovery. Liquidity in government securities market is complemented by deep and liquid repo markets. The repo market also facilitates undertaking short position as the delivery obligation of the short position is met by borrowing securities through the repo market. To augment the repo market, its participant base that included only SGL account2 holders, was expanded to include non-SGL account holders (2003), Re-repo of government securities was permitted (2015) and tri-party repo was introduced (2017). A comprehensive set of Directions on the repo markets was issued in July 2018. An active derivatives market facilitates capital market activity by providing instruments to hedge risks while also contributing to price discovery in the underlying. Guidelines for over the counter (OTC) rupee interest rate derivatives and interest rate futures were issued in 1999 and 2003, respectively. The regulatory framework has evolved over the years to address various aspects of the interest rate derivative markets covering inter alia, eligible institutions, permissible instruments, exposure limits and reporting. Comprehensive Directions covering both OTC and exchange traded derivatives were issued in 2019. To promote transparency, fair access and dissemination of traded information and to ensure integrity and safety in trading, the electronic trading platforms (ETPs) on which transactions in instruments regulated by the Reserve Bank can be contracted were brought under the regulatory purview with the issuance of the Electronic Trading Platform (Reserve Bank) Directions, 2018. To strengthen the regulatory framework to prevent abusive market practices, directions for prevention of market abuse were introduced in 2019, in line with best global practices. With a view to improving the governance of the benchmark processes in markets regulated by the Reserve Bank, especially after the LIBOR scam3, the Financial Benchmark Administrators (Reserve Bank) Directions were issued in 2019 in accordance with the best practices recommended in the International organisation of Securities Commissions (IOSCO) report on Principles for Financial Benchmarks (2013) and the Report of the Committee on Financial Benchmarks set up by the Reserve Bank (2014). The legal and regulatory framework for the government securities markets has thus evolved over the years to facilitate efficient management of public debt and foster the development of secondary markets. II.2. The Supply Side Issuances of government securities are made in different maturity buckets, enabling the formation of a yield curve from the short to the very long run of up to 40 years. Consequently, the share of securities with residual maturity of 20 years and above in the outstanding stock has increased from 13 per cent at end-March 2012 to 17 per cent at end-September 2020 (Table 1). In conjunction, issue sizes have been enlarged through reissuances in consecutive auctions to create liquidity-enhancing homogenous stocks of securities with common coupon and maturity dates. The rollover risk of large issuance sizes is managed through active consolidation using buyback/switches to supplement passive consolidation by way of reissuances. The number of securities has, consequently, remained largely unchanged over the last decade even as the stock of government debt has more than doubled. | Table 1 - Maturity Profile of Dated Government Securities | Maturity
(years) | March 31, 2012 | September 30, 2020 | | No. of securities | Total outstanding
(₹ Cr.) | Share in total outstanding
(per cent) | No. of securities | Total outstanding
(₹ Cr.) | Share in total outstanding
(per cent) | | 0-5 | 39 | 7,82,017 | 30 | 34 | 19,39,139 | 29 | | 5-7 | 12 | 4,22,251 | 16 | 10 | 8,74,072 | 13 | | 7-10 | 14 | 4,77,846 | 18 | 13 | 11,25,350 | 17 | | 10-15 | 11 | 3,61,451 | 14 | 16 | 13,52,702 | 20 | | 15-20 | 6 | 2,09,367 | 8 | 4 | 2,27,151 | 3 | | 20-25 | 7 | 2,37,307 | 9 | 6 | 5,06,002 | 8 | | 25-30 | 3 | 1,03,000 | 4 | 3 | 2,77,798 | 4 | | >30 | | | | 5 | 3,54,468 | 5 | | Total | 92 | 25,93,328 | | 91 | 66,56,682 | | | Note: Excludes special securities. Source: CCIL, RBI, RBI staff calculation. | Transparency in public debt supply was enhanced through the introduction of issuance calendars for auctions in government securities since April 2002. In recent years, detailed half-yearly borrowing calendars are announced, setting out weekly schedules of issuances, including the tenor and amount of securities to be issued. Dated government securities are primarily issued as fixed-coupon bonds. Product diversity has, however, sought to be brought about through instruments such as inflation-linked bonds, capital-indexed bonds, floating-rate bonds and bonds with embedded options. Treasury Bills (T-Bills) and Cash Management Bills (CMBs) are issued as discounted instruments. Regulatory provision for issuance of Separate Trading of Registered Interest and Principal of Securities has also been made to facilitate the development of a zero-coupon yield curve. Niche products targeted at retail investors include sovereign gold bonds (a government security denominated in gold) and savings bonds. Primary issuances of dated government securities are supported by a set of 21 Primary Dealers (PDs) who underwrite these auctions with prescribed targets on bidding commitments / success ratio (in respect of T-Bills/CMBs). During 2019-20, PDs individually achieved the stipulated minimum success ratio of 40 per cent, with an average of over 60 per cent. In addition, PDs may also be invited by the Reserve Bank to collectively bid to underwrite up to 100 per cent of the notified auction amounts of State Development Loans (SDLs)4. II.3. The Demand Side A heterogeneous investor base with different time horizons and risk preferences plays a key role in increasing the resilience of debt markets by ensuring active trading and liquidity across tenors. Over the past decade, the investor base for government securities has expanded. Banks remain the largest investors in government securities. However, their share in total holdings has declined while those of insurance companies and non-resident investors have increased (Table 2). | Table 2: Government Securities Holding (Per cent Share in Outstanding Stock) | | Quarter ended | Commercial Banks | Insurance Companies | Corporates | FPIs | Provident Funds | RBI | State Governments | Other Financial Institutions | Others | | Mar 2010 | 47.25 | 22.16 | 2.99 | 0.59 | 6.76 | 11.76 | - | 4.24 | 4.24 | | Mar 2020 | 40.41 | 25.09 | 0.81 | 2.44 | 4.72 | 15.13 | 2.05 | 4.24 | 5.12 | | Source: DBIE | Foreign Portfolio Investors (FPIs) have been permitted to invest in government securities subject to an upper limit of 6 per cent of the outstanding stock. With the introduction of the Fully Accessible Route (FAR), non-residents, including FPIs, can invest without any macro-prudential limits in certain specified securities5. FPIs can also invest in any government security through the Voluntary Retention Route (VRR)6, with several exemptions from macro-prudential limits, but subject to a minimum retention period. As is the case globally, retail investment in government securities in India is primarily routed through collective investment schemes like insurance, pension and mutual funds. Small savings schemes with associated tax benefits and fixed deposits with public sector banks also compete with government securities for retail interest. Nonetheless, several steps have been taken to encourage direct retail investment in government debt: (i)As retail investors may not have the expertise to appropriately price government securities, a non-competitive bidding facility in primary auctions was introduced for them with securities issued at the weighted average price discovered in auctions; (ii)A separate limit of 5 per cent of notified amount is set aside for retail investment in all primary issuances; (iii)Retail investors can use alternate aggregator/facilitator channels such as banks, PDs and stock exchanges; (iv)Sovereign gold bonds have been launched for the retail investors and secondary market trading in the same has been enabled through exchanges; (v)A separate odd-lot segment with a minimum market lot size of ₹ 10,000 against a standard lot size of ₹ 5 crore has been created in Negotiated Dealing System Order Matching (NDS-OM) since 2007; (vi) Constituents’ Subsidiary General Ledger (CSGL) account holders like Securities and Exchange Board of India (SEBI)-regulated depositories have been permitted to undertake value free transfer (VFT) of government securities directly on the Reserve Bank’s Core Banking Solution (e-Kuber) portal in respect of trades on exchanges between demat holders of different depositories. A facility of direct file upload on e-Kuber is being developed for the benefit of the CSGL account holders. II.4. Market Infrastructure A sound, robust and safe market infrastructure increases the resilience of the government securities market against external shocks and contributes to continuous price discovery, thereby enhancing market liquidity (BIS, 1999). The Reserve Bank has been engaged in developing the trading infrastructure for government securities, including reporting and timely dissemination of traded information both in outright and repo markets. The Negotiated Dealing System (NDS) introduced by the Reserve Bank in February 2002, has evolved over the years into a robust market infrastructure. Auction of dated government securities was operationalised in the NDS (Public Debt Office-NDS) in April 2005 with a view to enhancing operational efficiency by enabling online bidding. The NDS-Auction platform catered to primary auctions until October 2012 when e-Kuber, a technology-based solution, which fosters market-based price discovery took over. This is seamlessly integrated with the depository of government securities held at the Reserve Bank’s Public Debt Office, the payment systems and the secondary market trading infrastructure, including the NDS-OM and Clearing Corporation of India Ltd. (CCIL) (see below), to ensure linkages between the primary and secondary markets. This infrastructure also incorporates an interface with stock exchanges through which bids can be collected and placed with the Reserve Bank. Around 80 per cent of secondary market transactions in government securities are conducted on the NDS-OM which is an anonymous order matching platform for trading in government securities7. Complementing the trading infrastructure is a mechanism for settlement of transactions on a delivery-versus-payment (DvP)-III8 basis and through a central counterparty which eliminates counterparty risks and, through multilateral netting, reduces liquidity requirements. The CCIL, set up in 2001, is authorised as a payment system under the PSS Act, 20079 to act as the central counterparty for government securities transactions. The CCIL has been assessed as compliant with international standards set out under the Principles for Financial Markets Infrastructure (PFMI)10. Repo transactions in government securities are conducted primarily over two platforms - Clearcorp Repo Order Matching System (CROMS) and Triparty Repo Dealing System (TREPS). These platforms, including the NDS-OM, are operated by Clearcorp Dealing Systems (India) Ltd., a CCIL subsidiary and are governed under the Electronic Trading Platforms (Reserve Bank) Directions, 2018. Repo trades are also settled by the CCIL under the DvP-III process along with outright transactions to secure liquidity and netting efficiency in settlements. The infrastructure arrangements incorporate near real-time dissemination of trade information. Complementing the market infrastructure is a trade repository to which all OTC derivative transactions in related interest rate derivatives (as also foreign exchange and credit derivatives) are reported, thus providing a 360 degree view of all transactions in government securities and related markets, enabling effective market oversight and surveillance. During the past decade, average daily turnover in the outright segment increased at a Compounded Annual Growth Rate (CAGR) of 16 per cent from ₹15,000 crore in 2009-10 to ₹64,000 crore in 2019-20 (Chart 1). The netting benefits accruing to participants increased commensurately, as can be observed by an improvement in netting factor, which measures efficiency achieved on account of multilateral netting (Chart 2). Increased market liquidity and improvement in market infrastructure has also made it easier to execute large trades (Table 3). The repo market witnessed substantial growth, with average daily volume increasing from around ₹ 75,000 crore in 2009-10 to around ₹ 2 lakh crore in 2019-20 (Chart 3). Simultaneously, the derivatives markets (interest rate swaps or IRS; interest rate futures or IRF) have also developed. In particular, liquidity in the Overnight Index Swap (OIS) market witnessed a significant increase in recent years (Chart 4). | Table 3 - Deal Size Analysis for Outright Trades | | Financial Year | Deal Size (percent of total deals) | | Below ₹ 5 crore | ₹ 5 crore | ₹ 5-10 crore | ₹ 10-20 crore | Above ₹ 20 crore | | 2009-10 | 5.7 | 65.1 | 18.0 | 3.3 | 7.8 | | 2019-20 | 3.4 | 52.9 | 21.1 | 7.8 | 14.9 | | Source: CCIL. |
The government securities market has also provided a robust backbone for the development of the corporate bond market. Stable credit spreads (difference between government securities and corporate bond yields) over long periods of time testify to the relatively smooth transmission of impulses from the government securities segment to the corporate bond market (Charts 5 and 6).
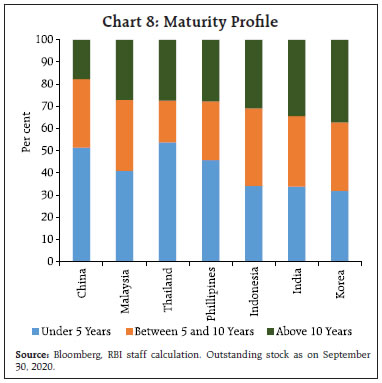
III. Cross-country Experience The size of Indian Government bond market is large compared to most Asian economies, except China and Malaysia (Chart 7). In comparison to Asian peers, the maturity profile of outstanding Indian government debt is more uniformly distributed across short (less than 5 years), medium (5 to 10 years) and long (above 10 years) tenors (Chart 8), allowing investors the flexibility to invest as per their time horizons. Even relative to the wider emerging market (EM) universe, the average maturity of outstanding government debt is relatively high, indicating a lower rollover risk (Chart 9). 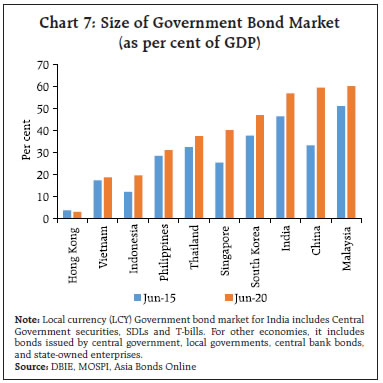
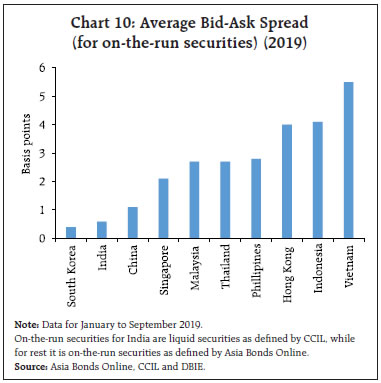
 A liquid market is generally characterised by small bid/ask spreads which do not materially increase for large transactions (Gerber, 1997). The average bid-ask spread for Indian government securities is among the lowest amongst Asian EM peers (Chart 10). In fact, the market liquidity compares well even with developed economies in terms of impact cost and bid-ask spread (BIS, 2019). However, the turnover ratio – the ratio of turnover to outstanding stock of bonds – is lower in the Indian case, indicating relatively lower volume in the secondary market (Chart 11). 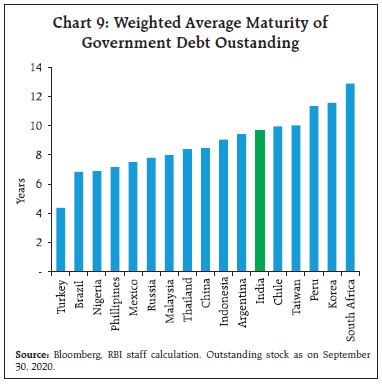

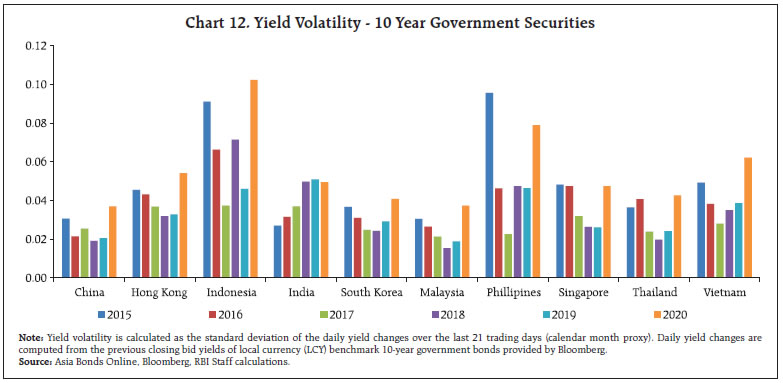 Yield volatility is generally defined as standard deviation of daily yield changes over the previous 21 trading days (a proxy for calendar month). High yield volatility suggests less predictability of the daily movements in bond yields, while low volatility implies that yields are relatively stable at around the average yields and thus may be an indicator of more liquid market (Kawai, 2019). In recent years, yield volatility for Indian government securities has generally remained higher than for bonds in China and Malaysia due to supply concerns and volatility in crude oil prices. However, the volatility has been lower than that of bonds issued in Indonesia, Philippines and Vietnam (Chart 12). Non-resident investment in Indian government securities is low relative to Asian EM peers (Chart 13), partly in reflection of the calibrated approach to opening up of domestic debt markets for foreign investment adopted in India. The relatively lower foreign presence in debt markets has, however, made Indian markets less vulnerable to external shocks such as yield movements in the US Treasury notes (Chart 14). The yield curve for India stretches up to 40 years, a feature not observed in most emerging market economies (EMEs) (Chart 15). The Indian yield curve is also among the flattest, reflecting the lower term premium across the term structure. At the same time, the Indian yield curve displays kinks at select tenors, reflecting the liquidity premium commanded by select securities / tenors. Such kinks are also observed in the yield curves of some other EMs (Chart 16).
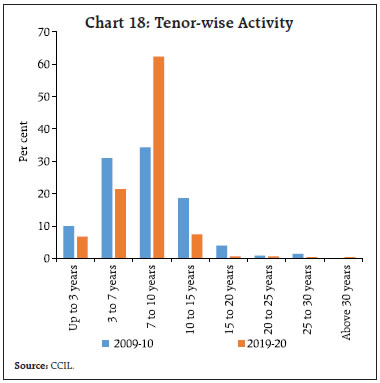
IV. Some Idiosyncratic Features Secondary market liquidity in government securities is concentrated in a few securities and a few tenors. The share of the top 5 securities in the secondary market turnover remains high at about 75 per cent in 2019-20 (Chart 17). The bulk of the trading remains concentrated in securities with tenors between 7 and 10 years (Chart 18). A wider distribution of secondary market liquidity across tenors could further increase the reliability of sovereign yield curve as a benchmark for risk-free rates and, consequently, improve the pricing of non-sovereign debt. This, however, also reflects specific aspects of the market microstructure in India. 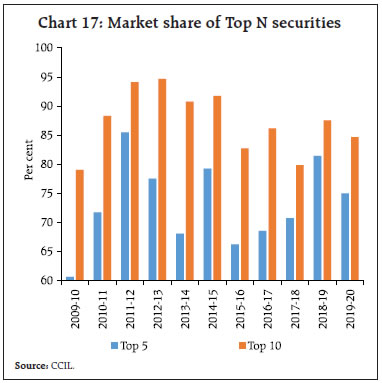
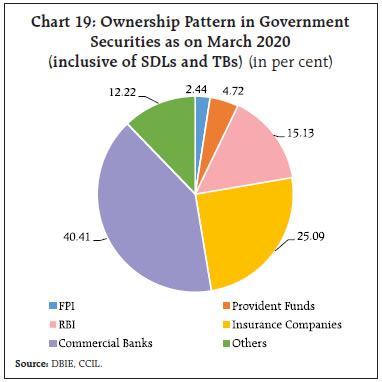
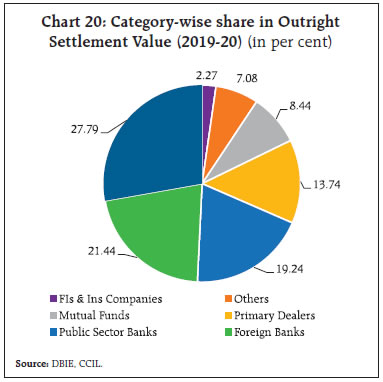 Insurance and provident funds are ‘buy and hold’ investors due to their cash flow patterns and related investment strategies, preferring longer dated securities in line with their liability commitments. The share of such entities in daily trading volumes is significantly lower relative to their share in holdings of government securities (Charts 19 and 20 and Table 4). | Table 4: Maturity Bucket-wise Holdings for Dated Government of India securities | | (Per cent) | | Category | Up to 5 year | 5 to 10 year | 10 to 15 year | 15 to 25 year | Above 25 year | | Commercial Banks | 54.2 | 52.1 | 43.2 | 11.6 | 3.1 | | Insurance | 7.6 | 10.6 | 31.5 | 65.2 | 90.4 | | Mutual Funds | 2.5 | 3.7 | 2.2 | 0.3 | 0.5 | | Co-op Banks | 0.3 | 1.3 | 0.8 | 0.3 | 0.2 | | RBI | 28.2 | 23.2 | 11.6 | 6.2 | 0.0 | | Provident Funds | 2.0 | 2.3 | 4.4 | 10.8 | 3.9 | | State Governments | 2.2 | 3.9 | 3.2 | 0.0 | 0.0 | | Others | 3.0 | 2.9 | 3.1 | 5.6 | 1.8 | | Total | 100.0 | 100.0 | 100.0 | 100.0 | 100.0 | Note: Data as on June 30, 2020.
Source: RBI staff calculations. | A large number of participants in the government securities markets are ‘long only’ players, with regulatory constraints or trading strategies that constrain them from assuming short positions in bear markets. For instance, while the Reserve Bank has allowed all entities to take short positions, entities outside its jurisdiction such as mutual funds are restricted by their respective regulators. Even among banks, some prefer to hold long positions as a trading strategy. Thus, liquidity tends to dry off in bearish markets and in times of uncertainty, with participants unwilling or unable to express their views on prices. IRD market segments have developed over the last few years. However, the only major liquid product is the Mumbai Interbank Offered Rate (MIBOR) based OIS (Table 5). Participation in the IRD markets is also limited to foreign banks, private sector banks and PDs, which together account for most of the trading volumes. Banks, insurance companies and pension funds hold significant amounts of government securities, but with insurance companies and pension funds not required to mark their investments to market and banks permitted to hold a large part of their government securities in the ‘Held to Maturity’ (HTM) category, such participants are not incentivised to hedge. Additionally, prescriptions of asymmetric accounting treatment of hedges – mark -to-market depreciations have to be accounted for but appreciations are ignored in the case of cash positions while both appreciation and depreciation have to be accounted for in the case of derivative positions11 – is also one of the reasons why banks have been averse to hedging. | Traded Volume of IRS Trades | | (In ₹ Billion) | | Year | MIBOR | MIFOR | INBMK | | 2013-14 | 22,967 | 798 | 4 | | 2014-15 | 20,292 | 1,198 | 3 | | 2015-16 | 21,329 | 993 | 3 | | 2016-17 | 19,235 | 1,254 | - | | 2017-18 | 33,808 | 1,112 | - | | 2018-19 | 58,617 | 1,709 | - | | 2019-20 | 39,181 | 2,886 | | | 2020-21 (till Aug-20) | 6,745 | 668 | | V. The Way Forward In 2020-21, the primary market issuance strategy has been fine-tuned to issue securities in six “key” tenors viz., 2-year, 5-year, 10-year, 14-year, 30-year and 40-year with each security being issued/reissued once in a fortnight. This strategy will help the early build-up of sufficient float for trading in the secondary market and provide certainty about the exact tenor of security issuances. Globally, illiquid securities are generally traded bilaterally. The Reserve Bank has recently authorised the Request For Quote (RFQ) mode of dealing on NDS-OM to provide participants with dedicated infrastructure to enable simultaneous and direct obtaining of quotes from multiple counterparties. While the investment regime for non-residents has been evolving to facilitate FPI investments within calibrated macro-prudential controls, further efforts are necessary to enable non-residents to tap Indian gilts. International settlement of government securities through International Central Securities Depositories (ICSDs) can enable non-residents that desire to invest in government securities but are not keen to have a domestic registration for the purpose. Recent regulatory changes facilitating ease of access for non-residents to domestic hedging markets can also further this endeavour. Similarly, efforts are ongoing to expand the retail investor base through technology-driven solutions tailored to enable direct access to NDS-OM- an ‘NDS-OM–Exchange Connect’ to link exchanges to NDS-OM has also been developed and shared with exchanges. Work is underway with the Government on the introduction of a gilt Exchange Traded Fund (ETF). A clearing member structure has been developed, which will enable registered brokers/depository participants to participate in NDS-OM by becoming indirect members and trading through clearing members of NDS-OM. Currently, participants are permitted to hold short position up to three months. This precludes expression of interest rate views over a longer time horizon or across an interest rate cycle. Increasing the horizon for short position as also tweaking of related regulatory norms may help in developing liquidity in the markets, especially in bearish conditions. The market for ‘special repo’12 currently facilitates borrowing of securities. Investors like insurance companies and mutual funds, who hold large quantum of government securities, have regulatory limitations in terms of lending securities through the repo market. A separate Securities Lending and Borrowing Mechanism (SLBM) to enable wider participation could augment secondary market liquidity. Deliverable bond forwards could facilitate the hedging of long-term interest rate and reinvestment risk by market participants like insurance companies, provident funds and corporates including Non-Banking Financial Companies (NBFCs). Bond forwards could provide a complete hedge solution for large institutional participants as compared to OIS swaps, which essentially hedge the unfunded costs. Globally, the use of bond forwards for hedging long-term liabilities is not uncommon. Going forward, increasing the liquidity across tenors in the sovereign yield curve, widening the investor base and developing the derivatives market can be the focus areas. This will augment the assiduously built market ecosystem for government securities and will act as a catalyst for the markets to further evolve and serve the interests of a growing economy which is becoming increasingly integrated with the global economy. References Bank for International Settlements. Committee on the Global Financial System (CGFS) Paper No. 62. (1999, January). Establishing viable capital markets. Bank for International Settlements. CGFS. (1999, October). How should we design deep and liquid markets? The case of government securities. IMF and World Bank. (2001, July). Developing Government Bond Markets – A Handbook. Masahiro Kawai. (2019, January). Economic Research Institute for Northeast Asia Discussion Paper No. 1901e. Asian Bond Market Development. Robert I. Gerber. (1997). Managing Fixed Income Portfolios. In Frank J. Fabozzi (Eds.), A User’s Guide to Buy-Side Bond Trading (Chapter 16, p. 278). New Hope, PA: Frank J. Fabozzi. Sahana Rajaram & Payal Ghose. (2019, December). CCIL Monthly newsletter. Indian Sovereign Bond Market - An update.
|