The Union Budget 2021-22 strikes the right chord by prioritising counter-cyclical investment-led fiscal support to post-COVID recovery in growth. The inbuilt reforms package which include privatisation, asset monetisation, new initiatives on long-term financing of infrastructure and clean-up of the non-performing assets in the banking system, and incentive-linked targeted promotion of activity in the manufacturing sector will further step-up the growth momentum in the medium-run. Greater fiscal transparency, use of reasonable baseline projections for revenue budgeting and stability in the tax regime are the other highlights of the budget. As the economy stabilises from the COVID-19 shock, the fiscal consolidation path will put India’s public finances on a sustainable path to rebuild fiscal space. Introduction The Union Budget 2021-22 recognises the critical role of the public sector in sustaining post-COVID recovery in growth while emphasising the pivotal role of the private sector to step-up India’s medium-term growth trajectory. Woven around the six themes of health and well-being, physical and financial capital and infrastructure, inclusive development for aspirational India, reinvigorating human capital, innovation and research and development (R&D), and minimum government-maximum governance, it has introduced several measures to provide an impetus to growth, particularly creation of large scale infrastructure, encouraging innovation, boosting health sector, relief for hard-hit sectors like Micro, Small and Medium Enterprises (MSMEs), as well as reforms in the governance structure. The thrust on sectors like infrastructure, health and step up in allocations for capital expenditure would have a multiplier effect, improving the investment climate and, in turn, propelling domestic demand, income and employment. While avoiding fiscal over-commitment in view of the prevailing uncertainties, due consideration has been given to the need to resume fiscal consolidation by reducing the gross fiscal deficit (GFD) to below 4.5 per cent of gross domestic product (GDP) by 2025-26. The fiscal consolidation in 2021-22 is sought to be achieved through increased buoyancy of tax revenue by improving compliance and by increasing receipts from disinvestment and monetisation of assets. Against this background, the rest of the article is divided into three sections. Section II discusses the key facets of the Union Budget 2021-22 viz., a comparative analysis with earlier Union Budgets, key deficit indicators, analysis of the fiscal slippage during 2020-21, decomposition of GFD, tax buoyancy and lastly, focus on capital expenditure and social sector spending. Section III highlights some of the key fiscal issues emerging from this Budget that will determine the nature and success of fiscal policy in the medium term such as disinvestment and asset monetisation, bank recapitalisation, fiscal transparency, market borrowing and debt dynamics and lastly, devolution and implication for states with respect to the 15th Finance Commission’s (FC-XV) recommendations. Section IV sets out the concluding observations. II. Union Budget: Key Facets a. Budget in a Comparative Perspective The Union Budget 2021-22 was formulated under exceptional circumstances of a 7.8 per cent contraction in GDP in 2020-211. Since the 1960s, GDP contractions have happened only thrice: 1965-66, 1972-73, and 1979-802 (Chart 1a). The first two episodes of growth contraction came in the backdrop of war combined with a monsoon failure, and the GDP contraction of 1979-80 was a result of the severe drought conditions with 19 per cent rainfall deficiency in the monsoon season. An event study on the fiscal implications during these years reveals a broadly uniform pattern for government receipts (Chart 1b), with growth of receipts falling in each of the crisis years in line with the contraction in growth, followed by a recovery in the ensuing year (except 1965-66, when receipts growth recovered only in the third year following the crisis). The expenditure pattern, on the other hand, has been varied (Chart 1c). In the crisis years of 1965-66 and 1979-80, fiscal responses to the crisis were lagged, with expenditure growth registering an increase in the period t+1, the year after the crisis. Contrary to the past pattern, in 2020-21, expenditure was frontloaded, resulting in a record high expenditure growth of 28.4 per cent in the crisis year itself. Consequently, the GFD-GDP ratio is revised to a peak of 9.5 per cent in 2020-21. The fiscal deviations have been varied across the contraction years, hinging critically on the sequencing of the expenditure push (Chart 1d). 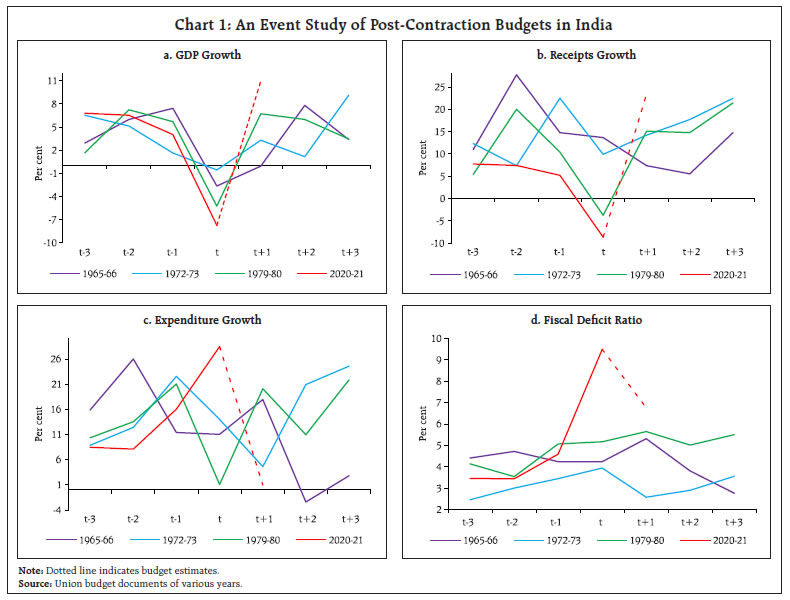 b. Key Deficit Indicators As against the budgeted GFD of 3.5 per cent of GDP for 2020-21, the revised estimates (RE) placed the GFD at 9.5 per cent of GDP, the deterioration primarily caused by a large decline in tax revenues on account of the unprecedented contraction led by the pandemic, with no cushion from disinvestments (Table 1). Higher revenue expenditure, primarily on account of on-budgeting of subsidies has also contributed to the slippage, with large-scale rationalisation of expenditure somewhat compensating for the pandemic-related stimulus. For 2021-22, the GFD-GDP3 ratio is budgeted at 6.8 per cent on the back of a cut in revenue expenditure and higher disinvestment receipts. The focus of expenditure has shifted to capital spending while tax revenue is pegged at realistic levels, i.e., those realised in RE for 2020-21. c. Analysis of the Fiscal Slippage in 2020-21 The total fiscal slippage for 2020-21 was 595 basis points, of which, 255 basis points could be attributed to cyclical factors4: (i) the contraction in GDP triggered automatic stabilisers, with the reduction in tax revenues contributing about 200 basis points to the slippage; (ii) the lower GDP also pushed up the GFD-GDP ratio from the denominator side, resulting in a slippage of another 55 basis points (Chart 2). The structural fiscal slippage attributable to discretionary actions by the government stood at 340 basis points as the government undertook necessary additional spending to support the economy (210 basis points), and because of lower ‘other receipts’ uncorrelated with cyclical fluctuations (130 basis points). A major component (about 150 bps) of this structural deficit represents a ‘one-off’ event, due to increase in outlay for subsidies, most of which are intended to clear past dues/arrears. | Table 1: Key Fiscal Indicators | | (as per cent of GDP) | | | 2019-20 | 2020-21 | 2021-22 | | Actual | BE | RE | BE | | 1 | 2 | 3 | 4 | 5 | | 1. Fiscal Deficit | 4.6 | 3.5 | 9.5 | 6.8 | | 2. Revenue Deficit | 3.3 | 2.7 | 7.5 | 5.1 | | 3. Primary Deficit | 1.6 | 0.4 | 5.9 | 3.1 | | 4. Gross Tax Revenue | 9.9 | 10.8 | 9.8 | 9.9 | | 5. Non-Tax Revenue | 1.6 | 1.7 | 1.1 | 1.1 | | 6. Revenue Expenditure | 11.6 | 11.7 | 15.5 | 13.1 | | 7. Capital Expenditure | 1.6 | 1.8 | 2.3 | 2.5 | | 8. Central Government Debt | 52.3 | 50.6 | 64.3 | 62.5 | | Source: Union Budget 2021-22. |
| Table 2: Decomposition of GFD | | (Per cent) | | | 2018-19 | 2019-20 | 2020-21 | 2021-22 | | BE | Actual | BE | Actual | BE | RE | BE | | 1 | 2 | 3 | 4 | 5 | 6 | 7 | 8 | | 1. Revenue Deficit | 66.6 | 70.0 | 68.9 | 71.4 | 76.5 | 78.8 | 75.7 | | 2. Capital Outlay | 44.6 | 43.0 | 44.2 | 33.3 | 47.8 | 18.0 | 34.1 | | 3. Net Lending | 1.5 | 1.6 | 1.8 | 0.7 | 2.1 | 5.0 | 1.8 | | 4. Disinvestment (minus) | 12.8 | 14.6 | 14.9 | 5.4 | 26.4 | 1.7 | 11.6 | | Source: Union budget documents of various years. | d. Decomposition of GFD The decomposition of GFD shows that the revenue deficit, which pre-empted about 70 per cent of the GFD during 2018-19 to 2019-20, is likely to increase its share to 79 per cent in 2020-21 (RE) and 76 per cent in 2021-22 (BE). On the other hand, the contribution of growth-inducing capital outlay is expected to rise sharply in 2021-22 after a significant fall in 2020-21 (Table 2). e. Tax Buoyancy The Union Budget 2021-22 introduces tax reforms that aim to stimulate growth, simplify tax administration and reduce litigations. On the direct tax front, the focus is on measures to improve compliance while broadly retaining the extant tax structure. With respect to indirect taxes, rationalisation of customs duty is proposed to remove distortions and incentivise domestic production and exports. In order to improve compliance, several measures have been proposed including constitution of a faceless Dispute Resolution Committee for small tax-payers, a faceless Income Tax Appellate Tribunal, and leveraging data analytics and artificial intelligence to identify tax evaders. The gross tax revenue is budgeted to grow by 16.7 per cent in 2021-22 over the previous year’s RE on the back of the expected improvement in compliance (Annex I). Direct taxes and indirect taxes have been budgeted to grow at 22.4 per cent and 11.4 per cent, respectively. The budgeted tax buoyancies for 2021-22 are higher than trend levels (proxied by the average for 2010-11 to 2019-20) for direct taxes, especially corporation tax. In absolute terms, however, corporation tax revenues have been budgeted at lower levels to 2018-19 and 2019-20. For indirect taxes, the budgeted buoyancies are lower (except customs duty), attributable to the budgeted contraction in Union excise duties (Table 3). On the whole, the budgeted tax buoyancies appear reasonable at this stage. | Table 3: Tax Buoyancy | | | Average Tax Buoyancy (2010-11 to 2019-20) | 2021-22 (BE) | | 1 | 2 | 3 | | 1. Gross Tax Revenue | 0.96 | 1.16 | | 2. Direct Taxes | 0.83 | 1.56 | | (i) Corporation Tax | 0.62 | 1.57 | | (ii) Income Tax | 1.20 | 1.58 | | 3. Indirect Taxes | 1.15 | 0.79 | | (i) GST | 1.68* | 1.55 | | (ii) Customs Duty | 0.19 | 1.49 | | (iii) Excise Duty | 0.86 | -0.50 | *: Average of two years.
Note: Tax buoyancy is defined as the responsiveness of tax revenue to changes in nominal GDP.
Source: RBI staff estimates based on Union budget documents of various years. | f. Focus on Capital Expenditure and Social Sector Spending With ‘physical and financial capital, and infrastructure’ being one of the six key pillars of the Union Budget proposals, focus has been laid on capital expenditure to revive investment and growth. Accordingly, capital expenditure, which increased to 2.3 per cent of GDP in 2020-21 (RE), is budgeted to increase further to 2.5 per cent of GDP in 2021-22 from an average of 1.7 per cent during 2010-11 to 2019-20. In contrast, revenue expenditure is projected to contract marginally in 2021-22, indicative of the government’s commitment to improve the quality of expenditure and to derive maximum ‘bang for the buck’ in terms of fiscal stimulus for the economy (Chart 3a). The capital expenditure growth in 2020-21 is, however, mostly on account of growth in loans and advances, with capital outlay (capital expenditure excluding loans and advances) recording only a modest growth of 6.7 per cent (Chart 3b)5. In 2021-22, capital outlay is budgeted to increase substantially by 54.7 per cent, with the capital outlay on major infrastructure estimated to grow by a robust 90 per cent - led by the railways, roads and bridges, and communications (Table 4). Through increase in capex allocation, the government has provided a shot in the arm for reviving momentum of economic activity and rekindle the animal spirits. Though this might lead to higher deficit and borrowing, the quality of expenditure is expected to improve with sharp increase in capex. The improvement in expenditure quality augurs well for the incipient investment revival of the Indian economy. Social sector expenditure, which includes expenditure on education, health, social security, housing and the like increased to 3.7 per cent of GDP in 2020-21 as the government adopted a series of interventions during the pandemic in order to provide relief to vulnerable sections of the population. As the pandemic has exposed the basic problems plaguing our health system, government expenditure on health sector is budgeted to almost double to 0.4 per cent of GDP in 2021-22 (Table 5). 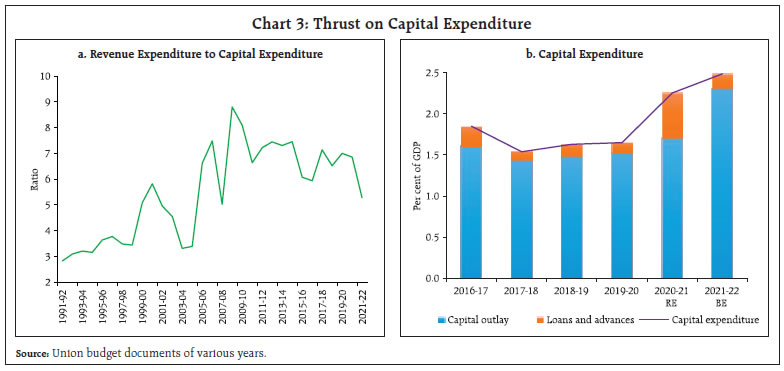
| Table 4: Capital Outlay | | | ₹ thousand crore | Growth Rate (per cent) | | 2019-20 | 2020-21 (BE) | 2020-21 (RE) | 2021-22 (BE) | 2019-20 | 2020-21 (RE) | 2021-22 (BE) | | 1 | 2 | 3 | 4 | 5 | 6 | 7 | 8 | | 1. Total Capital Outlay | 311 | 380 | 332 | 514 | 11.4 | 6.7 | 54.7 | | 2. Defence | 111 | 114 | 135 | 135 | 16.7 | 21.1 | 0.4 | | 3. Capital Outlay (excluding Defence) | 200 | 267 | 198 | 379 | 8.7 | -1.2 | 91.6 | | (i) Major Infrastructure | 146 | 175 | 124 | 236 | 9.4 | -14.9 | 90.0 | | Irrigation | 0.3 | 0.3 | 0.1 | 0.3 | -3.0 | -55.4 | 150.0 | | Energy | 1 | 2 | 3 | 1 | -61.5 | 147.5 | -65.6 | | Indian Railways | 68 | 70 | 29 | 107 | 28.4 | -57.3 | 269.3 | | Roads & Bridges | 71 | 77 | 87 | 101 | 1.4 | 22.8 | 16.1 | | Civil Aviation | 0.02 | 0.03 | 0.04 | 0.04 | -99.5 | 87.1 | -11.2 | | Ports and Light | | | | | | | | | Houses | 0.2 | 0.1 | 0.2 | 0.2 | 35.9 | -33.8 | -1.3 | | Communications | 5 | 26 | 4 | 26 | 103.1 | -15.1 | 486.1 | | (ii) Industry & Minerals | 6 | 7 | 5 | 7 | 55.6 | -22.7 | 53.6 | | (iii) Science, Technology and Environment | 9 | 10 | 6 | 11 | 26.4 | -35.6 | 77.0 | | (iv) Others | 39 | 74 | 63 | 125 | -1.8 | 61.1 | 99.0 | | Source: Union budget documents of various years. | III. Union Budget: Emerging Issues a. Asset Monetisation and Disinvestment The Union Budget 2021-22 relies heavily on receipts from asset monetisation and disinvestment to meet the dual commitments of an expenditure push while treading on the path of fiscal consolidation. An economic asset represents a benefit, or series of benefits, accruing to the economic owner. They generate value either through use in production (e.g., an office building), or by being held over a period (e.g., land) [System of National Accounts, 2008]. Government assets may be classified into financial and non-financial assets; non-financial assets may be further classified into produced and non-produced assets, and tangible and non-tangible assets (Chart 4). While non-financial assets vary widely across countries, on an average, their value is estimated to be 1.2 to 1.3 times the financial assets, and the combined value of financial and non-financial assets is higher than the gross debt in most countries (Bova et al., 2013). | Table 5: Social Sector Expenditure of Central Government | | Year | (₹ thousand crore) | (per cent of GDP) | | Social Sector Expenditure | Social Sector Expenditure | Education | Health | | 1 | 2 | 3 | 4 | 5 | | 2012-13 | 244 | 2.5 | 0.6 | 0.3 | | 2013-14 | 270 | 2.4 | 0.6 | 0.3 | | 2014-15 | 184 | 1.5 | 0.2 | 0.1 | | 2015-16 | 239 | 1.7 | 0.2 | 0.1 | | 2016-17 | 271 | 1.8 | 0.2 | 0.2 | | 2017-18 | 274 | 1.6 | 0.3 | 0.1 | | 2018-19 | 290 | 1.5 | 0.2 | 0.1 | | 2019-20 | 339 | 1.7 | 0.2 | 0.2 | | 2020-21 (RE) | 721 | 3.7 | 0.2 | 0.2 | | 2021-22 (BE) | 543 | 2.4 | 0.2 | 0.4 | | Source: Union budget documents of various years. | Monetisation of financial assets, in the form of disinvestment of government equity in central public sector enterprises (CPSEs), has been a regular feature of Union Budgets since the reforms of 1991. Realised revenues from disinvestment have, however, generally fallen short of the budgeted targets, with 2017-18 and 2018-19 being exception years when a large part of disinvestment happened through less preferred routes like cross-sale of CPSEs (Chart 5).6 Disinvestments could not materialise in 2020-21, with the revised estimates for 2020-21 falling short of the budgeted amount of ₹2.10 lakh crore by as much as 85 percent. 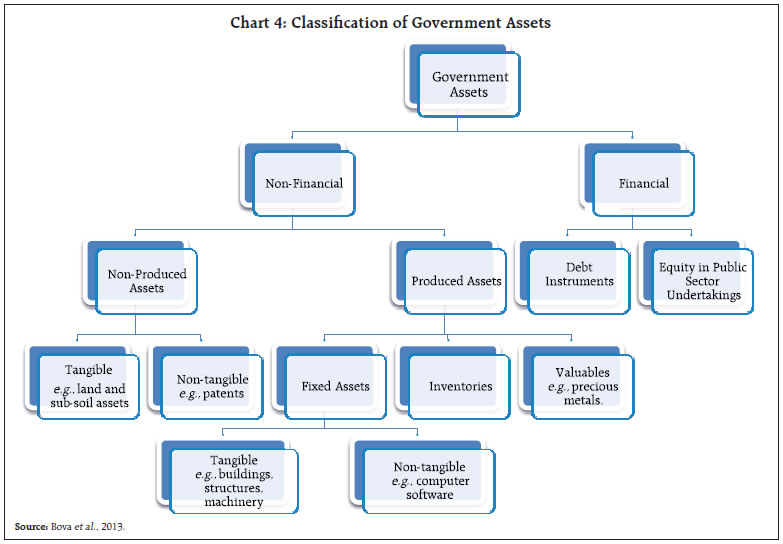 In 2021-22, the government has signalled its intent to go big on disinvestments by introducing a new public-sector enterprises policy, announced earlier under the AtmaNirbhar Bharat 1.0 Scheme. It provides a credible roadmap for disinvestment by clearly identifying strategic sectors which would have bare minimum presence of CPSEs, and privatisation/closure of CPSEs in all non-strategic sectors. Similarly, an incentive package of central funds for states would be worked out to incentivise disinvestment by states. For 2021-22, the disinvestment target has been pegged at ₹1.75 lakh crore, with a number of proposals.7 Even as the new public sector enterprises policy and buoyant market conditions spell well for disinvestment, the disinvestment plan will need to be pursued actively in order to realise the budgeted targets. While disinvestment could be a preferred option to support government earnings and reduce deficit, particularly when incurring higher expenditure becomes unavoidable despite low revenues, disinvestment also entails future revenue losses (e.g., loss of dividend income for the government and a permanent reduction in the assets held by the government) and can face issues in terms of ‘saleability’ of assets. Owing to such concerns, past performance on the disinvestment front has remained rather poor. An alternative/supplement to disinvestment is non-financial asset monetisation, which involves creation of new sources of revenue by unlocking the value of public assets such as land, buildings, dams, pipelines, roads, railways, airports, power transmission lines and mobile towers, among several other public assets which are under the control of government departments or CPSEs (GoI, 2019). It aims to help solve the twin problems of management of existing assets by tapping private sector efficiencies and financing of new infrastructure by unlocking the value of investment made in public assets which have not yielded appropriate or potential returns so far (Kant, 2021). Monetisation as a mechanism to finance infrastructure has been successfully employed internationally, the front-runner among them being Australia’s Asset Recycling Initiative, under which the central government provides a monetary incentive (of an additional 15 per cent of the estimated proceeds) to sub-national governments when they monetise an asset (through sale or lease) and use the proceeds to re-invest in new infrastructure. 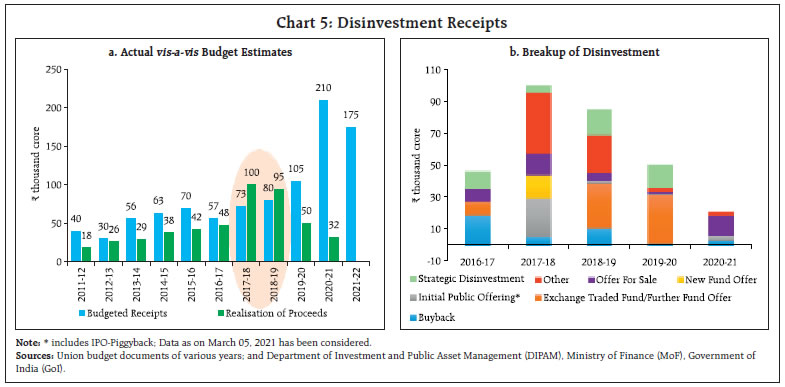 The Union Budget 2021-22 lays down the path for non-financial asset monetisation, which involves, inter alia, a ‘National Monetisation Pipeline’ of potential brownfield infrastructure assets and an ‘Asset Monetisation Dashboard’ to track the progress and provide visibility to investors. Some of the assets identified for monetisation in 2021-22 include operational roads of National Highways Authority of India (NHAI), transmission assets of Power Grid, Dedicated Freight Corridor of Indian Railways and airports in tier-II and tier-III cities. While the amount received by the union government from non-financial asset monetisation will be included under disinvestment receipts, it does not necessarily mean an outright sale of assets. It may take the form of long term lease, known as concession agreement, which entail mandatory transfer of assets back to the government, and may be the preferred method of monetising core infrastructure assets. Some of the illustrative models for monetisation of assets include direct contractual approach, structured finance approach, and sale and lease of land. There are few instances of sub-national governments in India also leveraging their assets to generate new revenue resources. It is important that the revenue generated through asset monetisation may be invested in new infrastructure without having to resort to public debt. A cycle of infrastructure creation followed by monetisation, without holding on to the assets, could prove to be a game changer for infrastructure investment in India. b. Recapitalisation The Union Budget 2021-22 has proposed recapitalisation of public sector banks (PSBs) for ₹20,000 crore with the objective of consolidation of their financial capacity8. PSBs have been proactively building buffers during 2020-21 to improve their resilience in the face of the pandemic shock and the process will need to be continued into 2021-22 to which some contribution has come from the Budget. There exists ample literature illustrating the critical role of bank recapitalisation in fostering credit and investment. Bank recapitalisation is found to have a strong effect on bank loan supply and is also a pre-requisite for efficient supply and allocation of credit (Gambarcorta and Shin, 2016). In specific reference to India, it was found that the relationship between bank capital and credit is non-linear and any amount of recapitalisation in banks is helpful in accelerating credit growth (Verma and Herwadkar, 2019). Indian monetary policy can influence credit supply of banks depending on their capital position (Muduli and Behera, 2020). Internationally, countries have recapitalised banks through various measures viz., capital injection through bond transfer (in exchange for bad loans or unrequited), cash transfer or transfer of property assets; reduction of bank liabilities by the government or a public agency; repurchase agreement; provision of guarantees on outstanding loans; issuance of short/medium term loan; actions on enterprises to allow servicing/repayment of bank debt and subsidising delinquent borrowers to enable them to service their bank borrowings (Annex II). In the aftermath of the 2007-08 financial crisis, various European Union (EU) member states made efforts to manage the failure of financial institutions, recapitalisation being one of the means. India has also announced and implemented bank recapitalisation packages for its PSBs from time to time (Chart 6). 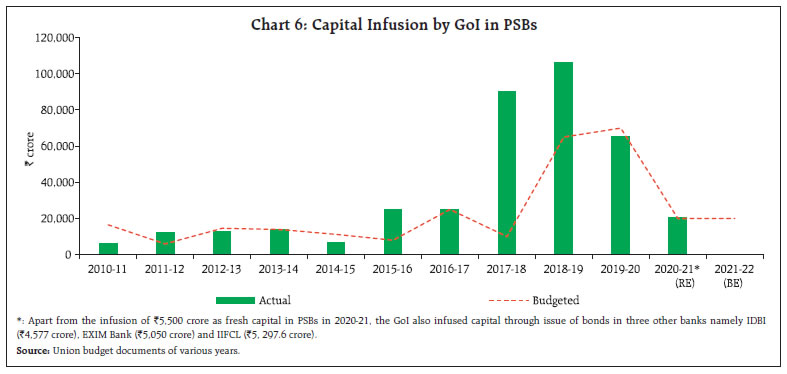
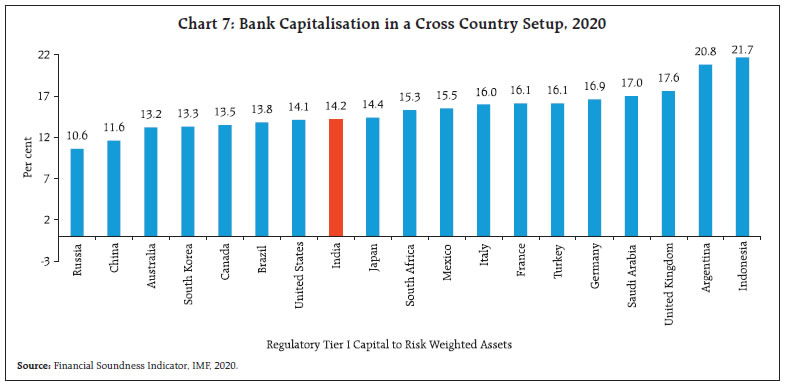 Regarding the recording of bank recapitalisation cost in the fiscal accounts, the GoI had followed international best practice in pricing the government’s bond-financed equity stakes in the PSBs. Market prices, as per the applicable formula mandated by Securities and Exchange Board of India (SEBI) regulations, were paid by the GoI and being consistent with a preferred shareholder acquiring a large allotment of equity, the recapitalisation was recorded below the line as a financial transaction (IMF, 2018). Nevertheless, despite the implementation of mammoth recapitalisation package from time to time in India, it appears that while Indian banks remain above the regulatory minimum capital requirement; many of the G-20 economies operate with relatively higher capital in their banking systems than India (Chart 7). The recapitalisation package undertaken by India over the past several years had some unique desirable features. By devising the funding mainly through issuing recapitalisation bonds, the capital injection was front-loaded while staggering the attendant fiscal implications over a period. Moreover, the recapitalisation bonds were liquidity neutral for the government except for the interest expenses that contributed to the annual fiscal deficit (Table 6). This is apart from the increase in government expenditure (through rise in capital expenditure) in few years, attributable largely to the implementation of bank recapitalisation (CAG, 2020). Finally, the linking of the recapitalisation package with bank performance was expected to bring in market discipline. Going ahead, with the PSBs accounting for a major share in advances made by scheduled commercial banks (SCBs), further measures on recapitalisation may be needed as infusion of capital in banks is needed not just from regulatory perspective but also from the angle of funding growth through improved credit offtake when credit demand picks up further. Simultaneously, recapitalisation and privatisation of PSBs need to go together. The strategic changes such as merger and amalgamation initiatives adopted by the GoI since 2017 has resulted in 7 large and 5 smaller PSBs (from a total of 27 PSBs in 2017). The merger and amalgamation measures (based on bad loans and regional factors) were intended to manage the capital more efficiently. Governance reforms and action plans to enhance operational efficiency and customer services are integral to the recapitalisation packages. Also, in the context of mergers and amalgamations, it is of critical importance that the consolidated entity is well-capitalised. Looking forward, the proposal to privatise two more PSBs, as announced in Union Budget 2021-22, alongside disinvestment of strategic sectors like banking could further contribute to promote efficiency in the banking system. | Table 6: Burden of Recapitalisation on the Budget | | | Interest paid to Banks on Recap Bonds
(₹ crore) | Fiscal Deficit as per cent of GDP | Interest Paid on Recap Bonds as per cent of | | GDP | Total Budget Expenditure | | 1 | 2 | 3 | 4 | 5 | | 2018-19 | 5,800.6 | 3.4 | 0.03 | 0.25 | | 2019-20 | 16,286.0 | 4.6 | 0.08 | 0.61 | | 2020-21 (RE) | 19,292.8 | 9.5 | 0.10 | 0.56 | | 2021-22 (BE) | 19,292.8 | 6.8 | 0.09 | 0.55 | | Source: Union budget documents of various years. | c. Transparency Fiscal transparency refers to the comprehensiveness, clarity, reliability, timeliness, and relevance of public reporting on the past, present, and future state of public finances. It not only helps in strengthening budgetary practices and improving accountability but also improves government’s credibility and market confidence. IMF’s Fiscal Transparency Code, 2014 is the most widely recognised standard for disclosure of information about public finances. It comprises of a set of principles incorporated under four pillars viz., fiscal reporting, fiscal forecasting and budgeting, fiscal risk analysis and management, and resource revenue management. The first principle under this code is the coverage of fiscal reports, which classifies fiscal reporting practices as basic, good and advanced (Chart 8). In the last few years, the government has adopted measures to acknowledge/include its extra-budgetary activities in the Union Budget, which are aimed at promoting fiscal reporting and will go a long way in enhancing transparency and credibility. These include: Firstly, the disclosure of Extra-Budgetary Resources (EBRs) raised by CPSEs through issuance of Government of India-Fully Serviced Bonds (GoI-FSB). Since 2016-17, certain CPSEs are permitted to issue GoI-FSB, for which repayment of entire principal and interest is to be borne by the union government. While the amount raised through GoI-FSB is utilised for financing government schemes in infrastructure and social sectors (e.g., Swachh Bharat Mission, Pradhan Mantri Awas Yojana, Pradhan Mantri Krishi Sinchayee Yojana, among several other schemes), these borrowings and expenditure remain off-budget. However, in the Union Budget 2019-20 liabilities on account of EBRs were first acknowledged, along with the target to reduce the accretions to the EBR stock to zero in five years’ time. From 2020-21 onwards, the government has started publishing details of scheme-wise utilisation of resources raised through GoI-FSB in the Union Budget Documents (Chart 9). 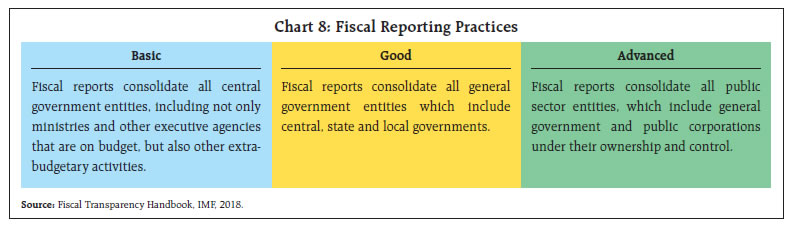
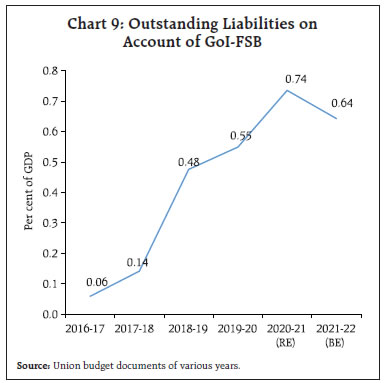 Secondly, since 2016-17, the government has resorted to the practice of providing loans to Food Corporation of India (FCI) from the National Small Savings Fund (NSSF) in lieu of food subsidy. This practice of off-budgeting a substantial portion of annual food subsidy has been proposed to be discontinued in the Union Budget 2021-22. However, further reforms in the food security system will be needed. Furthermore, the government has also provided an enhanced outlay for food subsidy in 2020-21(RE) and 2021-22 (BE), which is expected to bring down the outstanding dues of FCI from the peak of ₹2.55 lakh crore to ₹1.19 lakh crore by the end of this year and further to ₹64,000 crore by the end of 2021-22 (Chart 10). With the disclosure of extra-budgetary resources and on-budgeting of FCI dues to NSSF, the Centre has taken decisive steps towards improving fiscal reporting practices. It is also necessary to work towards generating a comprehensive general government database, that would include local governments’ fiscal data along with extra-budgetary data for all levels of government. The next challenge in this regard would be to consolidate data of CPSEs with the general government data in order to arrive at comprehensive public sector statistics, on the lines of Whole of Government Accounts (WGA) in the U.K.9 d. Market Borrowing and Debt Dynamics Gross market borrowing through dated securities for 2021-22 is budgeted at ₹12,05,500 crore as compared with ₹12,80,000 crore in 2020-21 (RE). The central government is raising additional ₹80,000 crore during February-March, 2020-21. Apart from market borrowing, which continues to be the major financing item of Centre’s GFD, NSSF has also emerged as a significant source of financing accounting for about 26 per cent of GFD (Annex III and Chart 11a). A notable change that this Budget has envisaged is to end the practice of public sector undertakings accessing the NSSF, as was the case post 2015-16 (Chart 11b). States had earlier progressively reduced their outstanding liabilities to NSSF, primarily on account of higher interest cost, as recommended by FC-XIV. Reflecting this, while interest outgo on account of NSSF borrowings of states is declining, that for the centre is on a rising trend (Chart 11c). Any shortfall in NSSF borrowing may need to be met by market borrowings. Amid large market borrowing for the second successive year and the global bond sell-off in recent months, through the monetary policy statement released on February 5, 2021, the Reserve Bank has assured that it will ensure the orderly completion of the market borrowing programme in a non-disruptive manner. In the policy statement released on February 5, 2021, the Reserve Bank and the Centre came out with a proposal to provide retail investors with online access to the government securities market – both primary and secondary – directly through the Reserve Bank (‘Retail Direct’). This move is expected to broaden the investor base and provide retail investors with enhanced access to participate in the government securities market. This is a major structural reform placing India among select few countries which have similar facilities. This will also facilitate smooth completion of the Government borrowing programme in 2021-22. 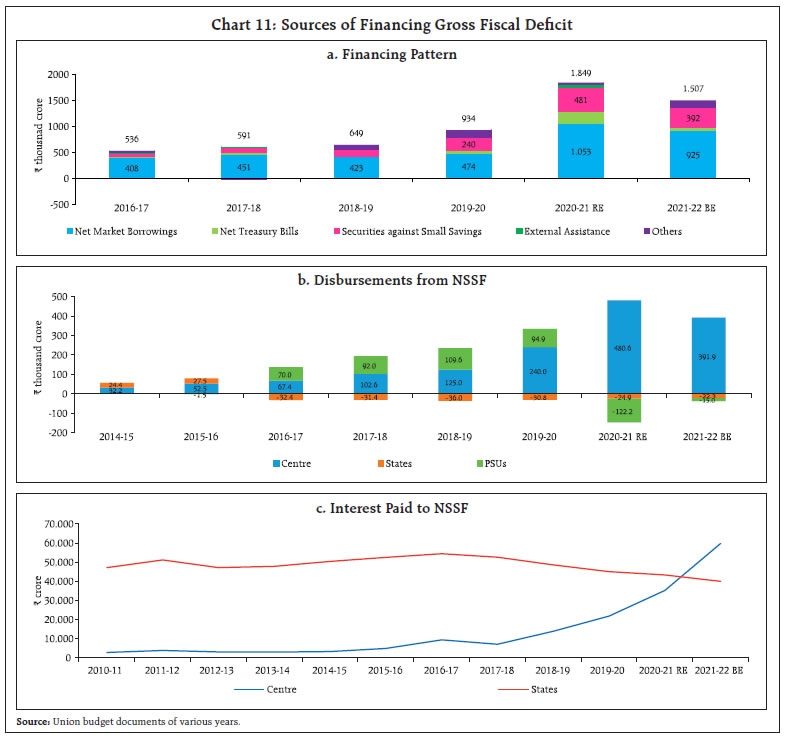 Due to higher borrowing in 2020-21, the centre’s debt-GDP ratio increased to 64.3 per cent (50.6 per cent in 2020-21BE), including EBR (Table 7). Adding states’ debt-GDP ratio, the general government’s debt is expected to cross 90 per cent. As the centre is planning to reduce net borrowing in 2021-22, the debt-GDP ratio is expected to be lower at 62.5 per cent, including 0.6 per cent for EBR. Furthermore, even as states’ borrowing limit has been extended, the expected normalisation in economic activities will prompt states to bring down debt in 2021-22; this should bring down general government debt to below 90 per cent. The Fifteenth Finance Commission (FC-XV) has recommended debt paths for states, the Centre and general government in its report released on February 1, 2021. Because of COVID-19 related uncertainty, the centre has found forecast of economic growth and fiscal variables, including the specification of a return path, challenging. It has however, stated to return to the path of fiscal consolidation as soon as economic growth and receipts return to their long-run averages. | Table 7: Outstanding Debt of Central Government | | (Per cent of GDP) | | | Debt | of which EBR | | 1 | 2 | 3 | | 2018-19 | 49.6 | 0.5 | | 2019-20 | 52.3 | 0.6 | | 2020-21 (RE) | 64.3 | 0.7 | | 2021-22 (BE) | 62.5 | 0.6 | | Sources: Union budget documents of various years; and RBI staff estimates. | The Economic Survey 2020-21, has conveyed the message that growth leads to debt sustainability, and a negative differential between the cost of borrowing (r) and economic growth (g) is a healthy signal. A long-term analysis of interest rate-GDP growth differentials (r-g) of the general government shows that it, generally, remained negative in India over last four decades barring 2000-01 to 2002-03 (Chart 12a)10. This feature of ‘r-g’ was on account of changes in GDP growth rates rather than changes in interest rate (GoI, 2021). Moreover, the negative interest-growth differentials are common in countries at all levels of development (Chart 12b) (Mauro and Zhou, 2020). Also, it is evident that as ‘r-g’ gradually became less and less negative in India during the Asian financial crisis and later during the post-taper tantrum period, the debt-GDP ratio increased steadily, thus, indicating that it is not only the value of ‘r-g’ but also its slope that might influence debt sustainability. The difference between r and g, that was approaching zero in 2019-20 even prior to the pandemic, is likely to be positive in 2020-21 - primarily due to a sharper contraction in GDP and a low and stable interest rate. The decline in GDP growth in 2020-21 is, however, temporary and higher GDP growth (in double-digit for 2021-22), is likely to reverse the situation, going forward. Apart from ‘r-g’ that essentially works on the stock of debt, the flow of primary balances also play a vital role in debt evolution. A higher primary deficit (PD) leads to a higher stock of debt and an increase in interest payments, given ‘r-g’. This reduces space for spending towards productive long-term assets and constraints future revenue generation to repay past debt. Therefore, the gain from the increase (decline) in negative (positive) ‘r-g’ differential may be more than offset by an increase in primary deficit. Since India’s primary balance was in deficit, the interest payment to GDP ratio increased steadily till 2002-03 (Chart 13). After that, as a result of fiscal consolidation, the ratio declined sharply by turning a higher primary deficit to surplus. The deficit trend again echoed in the post-global financial crisis. During 2020-21, the exogenously driven contraction in receipts and increased spending on revenue account led to a deterioration of the centre’s primary balance, albeit a lower deficit is budgeted for 2021-22. 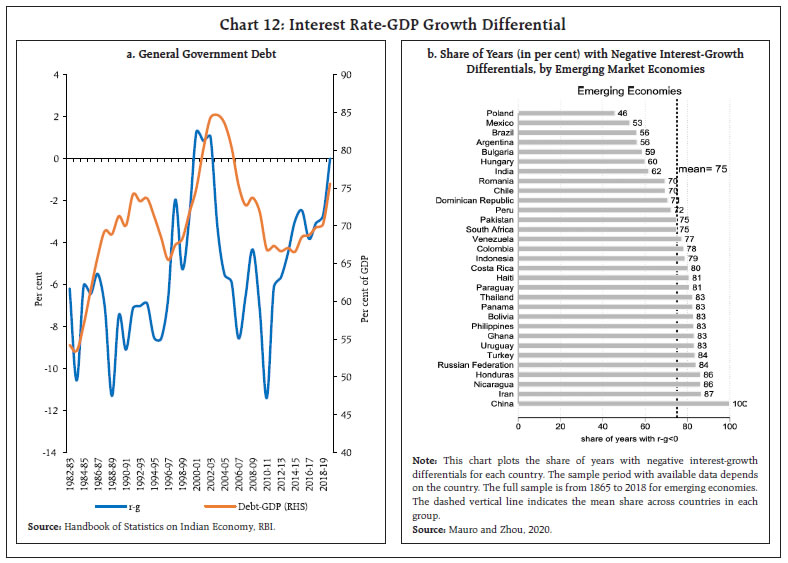 Notwithstanding the risk of higher debt/primary deficit, the quality of debt/primary deficit matters in the medium to long-run. As per the ‘golden rule’, revenue expenditure should be met out of revenue receipts, and borrowing should be channelised towards capital expenditure. In India, though the ratio of revenue expenditure to capex has been declining since the global financial crisis, revenue balance was always in deficit, and hence, part of borrowing moved towards revenue spending. While some spending is mandatory under revenue expenditure, some are also necessary for the smooth or efficient functioning of capital assets. Therefore, the right mix of revenue and capital needs to be framed by the different layers of government for promoting economic growth. Maintaining and improving the quality of expenditure would help address the objectives of fiscal sustainability while supporting growth (Das, 2021). As stated earlier, while the adverse effect of the current pandemic necessitated diverting central government’s attention towards revenue expenditure such as spending on health, food, transfers under PM Kisan and MGNREGA, fiscal transparency and higher spending on capex in 2020-21 were welfare-enhancing and necessary. Therefore, while the centre’s current high borrowing and the resultant high debt aim at enhancing social welfare and sustaining recovery in GDP growth, structural reforms coupled with enhanced fiscal transparency and quality of expenditure can help in debt sustainability. e. Devolution and Implications for States’ based on Finance Commission’s Recommendation The net transfer of resources from the centre to states in 2020-21 is lower by 5.6 per cent in the revised estimates compared to the budgeted amount. Revenue account transfers are significantly lower by 15.1 per cent in the revised estimates due to the sharp reduction in taxes devolved (29.9 per cent), partially offset by higher revenue deficit grants and scheme related transfers. Given this sharp reduction in revenue account transfers, states’ resources are sought to be augmented through additional loans in the form of back-to-back loans for GST compensation shortfall and special loan assistance for capital expenditure. The back-to-back loan for GST compensation shortfall is a financing arrangement by which centre borrows the amount from the market and lends it to states; thus, deficit neutral for the centre. In 2021-22, tax devolution is budgeted to recover close to the level of 2019-20 while revenue deficit grants are budgeted to increase significantly following the recommendations of the FC-XV (Annex IV). The FC-XV has broadly tried to maintain the vertical devolution share as well as the horizontal degree of progressivity across states for the full award period. The increasing share of grants in the overall pool of transfers, which are assigned in terms of a fixed amount rather than a percentage of divisible pool, adds predictability to the quantum and timing of fund flow, thus reducing the revenue uncertainty. Additionally, while most sector-specific grants recommended by the FC-XV have not been provided for in the Budget, health sector grants have been introduced in 2021-22 in view of the urgent need to scale up public healthcare (Annex V). Turning to state finances, the Union Budgets have a cascading effect on them given the high degree of revenue dependence from centre. For all states taken together, transfers from the centre account for 46.9 per cent of revenue receipts, broadly split equally between tax devolution and grants in 2020-21 (BE) (Chart 14a). While transfers in terms of grants have broadly been maintained in 2020-21 (RE) of the Union Budget, the severe reduction in tax devolution coupled with the likely cyclical reduction in states’ own taxes is expected to significantly impact the revised estimates of states budgets for 2020-21. The impact of lower tax devolution is expected to be asymmetric across states given their varied levels of reliance from this source. Among the large states (according to the size of their revenue budget), Uttar Pradesh, Bihar, West Bengal and Madhya Pradesh have a high reliance on tax devolution (Chart 14b). IV. Conclusion The Union Budget 2021-22, banking on the resilience exhibited by the Indian economy to the once in a century crisis, has shifted its focus to stimulating medium-term growth potential through higher capital expenditure and various reforms as against the focus of the government on keeping the economy afloat and recovering from the pandemic during the fiscal 2020-21. While doing so, the Budget does a tight rope walk, exploring ways to ease funding constraint while providing counter-cyclical support for growth revival. It strives towards funding budgeted expenditure by increasing the buoyancy of tax revenue through improved compliance, and by increasing receipts from monetisation of assets, including public sector enterprises and land as well as strategic disinvestment. The enhanced capex investment by the government would not only crowd-in private investment but also boost employment generation. With economic activity gaining momentum and confidence improving, precautionary savings are expected to reduce. The renewed emphasis on infrastructure development and healthcare would augur well for development. The thrust on domestic manufacturing with focus on hard-hit sectors, like MSMEs, would go a long way in enhancing exports and employment. The proposed measures for the financial sector such as privatisation of public sector banks, allocation for recapitalisation and increase in FDI limit in insurance are noteworthy and progressive. Finally, the greater leeway allowed to states in the near term, based on the FC-XV, is crucial since the state governments are bigger spenders on capex than the central government. Another positive aspect has been the greater transparency with regard to off-budget expenditure in the Budget which has been well received by the markets as well. While the fiscal math provided by the government appears to be reasonably realistic, the dominance of non-discretionary items like interest cost in central government spending is a matter of concern. Though the fiscal consolidation path has been stretched, the measures proposed in the Budget, if implemented well, could help in realising its intent and objectives, and be a game changer in achieving higher growth in the medium term. References Andrews, M. (2003), ‘‘Issuing government bonds to finance bank recapitalisation and restructuring: Design factors that affect banks’ financial performance’’, IMF Policy Discussion Paper, November. Bova, E., Dippelsman, R., Rideout, K., and Schaechter, A. (2013), ‘‘Another look at governments’ balance sheets: The role of non-financial assets’’, IMF Working Paper, No. 13/95. Comptroller and Auditor General of India (2020), ‘‘Accounts of the Union Government for the year 2018-19’’, Report No.4. Fedelino, A., Horton, M., and Ivanova, A. (2009), ‘‘Computing cyclically-adjusted balances and automatic stabilisers’’, Technical Notes and Manuals, Fiscal Affairs Department, International Monetary Fund, Vol. 2009, pp. 1-12, December. Gambarcota, L., and Simonov, A. (2016), ‘‘Why bank capital matters for monetary policy’’, BIS Working Paper, No. 558, April. Government of India (2019), ‘‘Asset monetisation: Procedures and mechanism thereof’’, Department of Investment and Public Asset Management, Office Memorandum F.No.3/3/2018/DIPAM-II. ………. (2020), Report of the Fifteenth Finance Commission, Ministry of Finance. ………. (2020), Press Information Bureau, Release ID: 1664833, Special Window to States for meeting the GST Compensation Cess shortfall, October. ……….. (2021), ‘‘Chapter 2: Does Growth Lead to Debt Sustainability? Yes, But Not Vice-Versa!’’, Economic Survey 2020-21, January. International Monetary Fund (2018), Fiscal Transparency Handbook, April. ……………. (2018), Article IV Consultation, IMF Country Report, No. 18/254, August. Kant, A (2021), Effective Asset Monetisation Can Help Create Substantial Fiscal Impact, World-Class Infrastructure in India; Financial Express, January 5. Mauro, P., and Zhou, J. (2020), ‘‘r-g<: Can we sleep more soundly?’’, IMF Working Paper, March. Muduli, S., and Behera, H. (2020), ‘‘Bank capital and monetary policy transmission in India’’, RBI Working Paper Series, No. 12, October. Reserve Bank of India (2020), State Finances: A Study of Budgets of 2020-21, October. ………. (2020), Report of the Internal Working Group to Review Extant Ownership Guidelines and Corporate Structure for Indian Private Sector Banks, November. ……….. (2021), Towards a Stable Financial System, Nani Palkhivala Memorial Lecture delivered by Shri. Shaktikanta Das, RBI Bulletin, February. Verma, R. and Herwadkar, S. (2019), ‘‘Bank recapitalisation and credit growth: The Indian case’’, MPRA Paper No. 97394, December.
| Annex I: Union Budget 2021-22: Key Fiscal Indicators | | | in ₹ crore | Per cent of GDP | Growth Rate | | | 2018-19 | 2019-20 | 2020-21(BE) | 2020-21 (RE) | 2021-22 (BE) | 2020-21 (RE) | 2021-22 (BE) | 2020-21 (RE) | 2021-22 (BE) | | 1 | 2 | 3 | 4 | 5 | 6 | 7 | 8 | 9 | 10 | | 1. Direct Tax | 11,36,615 | 10,49,549 | 13,19,000 | 9,05,000 | 11,08,000 | 4.6 | 5.0 | -13.8 | 22.4 | | (i) Corporation | 6,63,572 | 5,56,876 | 6,81,000 | 4,46,000 | 5,47,000 | 2.3 | 2.5 | -19.9 | 22.6 | | (ii) Income | 4,61,488 | 4,80,398 | 6,25,000 | 4,47,000 | 5,48,500 | 2.3 | 2.5 | -7.0 | 22.7 | | 2. Indirect Tax | 9,43,850 | 9,60,510 | 11,04,020 | 9,95,280 | 11,09,059 | 5.1 | 5.0 | 3.6 | 11.4 | | (i) GST | 5,81,559 | 5,98,749 | 6,90,500 | 5,15,100 | 6,30,000 | 2.6 | 2.8 | -14.0 | 22.3 | | (ii) Customs | 1,17,813 | 1,09,283 | 1,38,000 | 1,12,000 | 1,36,000 | 0.6 | 0.6 | 2.5 | 21.4 | | (iii) Excise | 2,31,982 | 2,40,615 | 2,67,000 | 3,61,000 | 3,35,000 | 1.9 | 1.5 | 50.0 | -7.2 | | 3. Gross Tax Revenue (1+2) | 20,80,465 | 20,10,059 | 24,23,020 | 19,00,280 | 22,17,059 | 9.8 | 9.9 | -5.5 | 16.7 | | 4. Assignment to States | 7,61,454 | 6,50,677 | 7,84,181 | 5,49,959 | 6,65,563 | 2.8 | 3.0 | -15.5 | 21.0 | | 5. NCCD Transfers | 1,800 | 2,480 | 2,930 | 5,820 | 6,100 | 0.0 | 0.0 | 134.7 | 4.8 | | 6. Net Tax Revenue (3-4-5) | 13,17,211 | 13,56,902 | 16,35,909 | 13,44,501 | 15,45,397 | 6.9 | 6.9 | -0.9 | 14.9 | | 7. Non-Tax Revenue | 2,35,705 | 3,27,157 | 3,85,017 | 2,10,653 | 2,43,028 | 1.1 | 1.1 | -35.6 | 15.4 | | (i) Dividends and Profits | 1,13,421 | 1,86,133 | 1,55,395 | 96,544 | 1,03,538 | 0.5 | 0.5 | -48.1 | 7.2 | | (ii) Interest Receipts | 12,145 | 12,349 | 11,042 | 14,005 | 11,541 | 0.1 | 0.1 | 13.4 | -17.6 | | 8. Revenue Receipts (6+7) | 15,52,916 | 16,84,059 | 20,20,926 | 15,55,153 | 17,88,424 | 8.0 | 8.0 | -7.7 | 15.0 | | 9. Non-Debt Capital Receipts | 1,12,779 | 68,620 | 2,24,967 | 46,497 | 1,88,000 | 0.2 | 0.8 | -32.2 | 304.3 | | (i) Disinvestment receipts | 94,727 | 50,304 | 2,10,000 | 32,000 | 1,75,000 | 0.2 | 0.8 | -36.4 | 446.9 | | (ii) Recovery of Loans | 18,052 | 18,316 | 14,967 | 14,497 | 13,000 | 0.1 | 0.1 | -20.9 | -10.3 | | 10. Total Receipts (excluding borrowings) (8+9) | 16,65,695 | 17,52,680 | 22,45,893 | 16,01,650 | 19,76,424 | 8.2 | 8.9 | -8.6 | 23.4 | | 11. Revenue Expenditure | 20,07,399 | 23,50,604 | 26,30,145 | 30,11,142 | 29,29,000 | 15.5 | 13.1 | 28.1 | -2.7 | | (i) Interest Payments | 5,82,648 | 6,12,070 | 7,08,203 | 6,92,900 | 8,09,701 | 3.6 | 3.6 | 13.2 | 16.9 | | (ii) Major Subsidies | 1,96,769 | 2,28,341 | 2,27,794 | 5,95,620 | 3,36,439 | 3.1 | 1.5 | 160.8 | -43.5 | | Food | 1,01,327 | 1,08,688 | 1,15,570 | 4,22,618 | 2,42,836 | 2.2 | 1.1 | 288.8 | -42.5 | | Fertilizer | 70,605 | 81,124 | 71,309 | 1,33,947 | 79,530 | 0.7 | 0.4 | 65.1 | -40.6 | | Petroleum | 24,837 | 38,529 | 40,915 | 39,055 | 14,073 | 0.2 | 0.1 | 1.4 | -64.0 | | 12. Capital Expenditure (i + ii) | 3,07,714 | 3,35,726 | 4,12,085 | 4,39,163 | 5,54,236 | 2.3 | 2.5 | 30.8 | 26.2 | | (i) Capital Outlay | 2,79,492 | 3,11,312 | 3,80,322 | 3,32,247 | 5,13,862 | 1.7 | 2.3 | 6.7 | 54.7 | | (ii) Loans & Advances | 28,221 | 24,414 | 31,763 | 1,06,916 | 40,374 | 0.5 | 0.2 | 337.9 | -62.2 | | 13. Total Expenditure (11+12) | 23,15,113 | 26,86,330 | 30,42,230 | 34,50,305 | 34,83,236 | 17.7 | 15.6 | 28.4 | 1.0 | | 14. Fiscal Deficit (13-10) | 6,49,417 | 9,33,651 | 7,96,337 | 18,48,655 | 15,06,812 | 9.5 | 6.8 | 98.0 | -18.5 | | Source: Union budget documents of various years. |
| Annex II: Bank Recapitalisation – International Experience | | Country | Year | Issuer | Interest rate (per cent) | Maturity (years) | | 1 | 2 | 3 | 4 | 5 | | India | 1980-90s | Government | 7.75-10 | 12 | | Algeria | 1996 | Government | 10 | 20 | | Croatia | 1996 | Agency for rehabilitation of banks | 5 | 15 | | Ecuador | 1999 | Government | Below market | 3-5 | | Hungary | 1992 | Government | linked to 91 days T-bill rate | 20, 25 and 30 years | | Tanzania | 1992 | Government | 11 | 20 | | Uganda | 1996 | Government | linked to 91 days T-bill rate | 1-5 | | Poland | 1991 and 1993-94 | Government | 1991-95: 6-months LIBOR+2 per cent. From 1996: 6-months LIBOR + 0.5 per cent
1993-94: Central bank rediscount rate | 1 and 15 | | Indonesia | 1998 | Government | 12 per cent | 3-10 | | Malaysia | 1998 | Bank restructuring agency | Market based | NA | | Mexico | 1996 | Bank restructuring agency | linked to 91 days T-bill rate | 10 | | Korea | 1998 | KAMCO (Asset Management Company) | Variable US dollars | NA | | Spain | 2012 | Fund for Orderly Bank Restructuring (FROB) | - | 12.5
(weighted average maturity) | | Thailand | 1999-00 | Government | Market based | 10 | NA: Not Available.
Sources: IMF and World Bank. |
| Annex III: GFD Financing | | (Amount in ₹ crore) | | Item | 2019-20 (Actual) | 2020-21 (BE) | 2020-21 (RE) | 2021-22 (BE) | | 1 | 2 | 3 | 4 | 5 | | Gross Fiscal Deficit | 9,33,651 | 7,96,337 | 18,48,655 | 15,06,812 | | | (100.0) | (100.0) | (100.0) | (100.0) | | Financed by | | | | | | Net Market Borrowings | 4,73,968 | 5,44,870 | 10,52,788 | 9,24,708 | | | (50.8) | (68.4) | (56.9) | (61.4) | | Net Treasury Bills | 70,103 | 25,000 | 2,25,000 | 50,000 | | | (7.5) | (3.1) | (12.2) | (3.3) | | Securities issued against Small Savings (net) | 2,40,000 | 2,40,000 | 4,80,574 | 3,91,927 | | | (25.7) | (30.1) | (26.0) | (26.0) | | External Assistance | 8,682 | 4,622 | 54,522 | 1,514 | | | (0.9) | (0.6) | (2.9) | (0.1) | | State Provident Fund | 11,635 | 18,000 | 18,000 | 20,000 | | | (1.2) | (2.3) | (1.0) | (1.3) | | Reserve Fund | 10,411 | 2,978 | -3,450 | 5,051 | | | (1.1) | (0.4) | -(0.2) | (0.3) | | Deposits and Advances | -14,227 | 35,987 | 29,050 | 28,868 | | | -(1.5) | (4.5) | (1.6) | (1.9) | | Draw Down of Cash Balances | 4,971 | -53,003 | -17,358 | 71,383 | | | (0.5) | -(6.7) | -(0.9) | (4.7) | | Others | 1,28,107 | -22,117 | 9,528 | 13,361 | | | (13.7) | -(2.8) | (0.5) | (0.9) | Notes: 1. Net market borrowings include borrowings through dated securities only.
1. Net treasury bills include borrowings through 91-day, 182-day, 364-day and all other treasury bills.
2. Others include buyback of securities, switching-off of securities, saving bonds, relief bonds etc.
Figures in parentheses represent per cent of GFD.
Source: Union Budget 2021-22. | Annex IV: Major Recommendations of the Fifteenth Finance Commission Relating to States The full report of FC-XV (Chairman: Shri N. K. Singh) was submitted on November 9, 2020 and was placed before the parliament on February 1, 2021. The major recommendations of the Commission covering the period 2021-26 are set out below: Tax Devolution -
Share of union taxes (divisible pool) to be devolved to states decrease from 42 per cent to 41 per cent, adjusting for the 1 per cent share allocated to the erstwhile state of Jammu and Kashmir. -
For inter-se distribution of taxes amongst states, criterion of demographic performance introduced to reward states that have successfully curbed population growth. Weightage of forest cover criterion has been increased and a new criterion of tax effort has been introduced. Criterion of income distance per capita retains the highest weightage in determining an individual state’s share in taxes devolved. Grants-in-aid -
Grants recommended for bridging of post-devolution revenue deficit of states, devolution to local bodies, augmenting disaster relief funds, sector-specific initiatives and state-specific needs. Local bodies grants have the highest share followed by post-devolution revenue deficit grants. -
Entry level conditions for local bodies to receive grants, including setting up of state finance commissions and bringing to state legislature the memorandum of action taken by it before March 2024, making available online the financial accounts of local bodies and fixing minimum floor for property taxes (for urban local bodies). -
60 per cent of grants to local bodies to be tied to supporting and strengthening sanitation, waste management, drinking water and water harvesting. -
Post devolution revenue deficit grants recommended for 17 states in 2021-22, reducing to 6 states in 2025-26. -
Sector-specific grants in eight sectors, namely, health, school education, higher education, agriculture, rural roads, aspirational districts, judiciary and statistics. Modernisation Fund for Defence and Internal Security (MFDIS) - MFDIS to be a dedicated non-lapsable fund in the Public Account of India to bridge the gap between budgetary requirements and allocation for defence and internal security.
Fiscal Roadmap -
Elevated path of gross fiscal deficit (GFD) for the union government with the terminal year (2025-26) target of 4 per cent of GDP. -
Normal limit of net borrowings of state governments fixed at 4 per cent of GSDP in 2021-22, 3.5 per cent of GSDP in 2022-23 and 3 per cent of GSDP thereafter. Additional borrowing space of 0.5 per cent of GSDP during the four-year period of 2021-22 to 2024-25, conditional upon improvement in operational and financial performance of power distribution companies. -
Restructuring of FRBM acts by both union and states necessary with a high-powered inter-governmental group to be set-up to examine the issue of debt sustainability. | Annex V: Gross and Net Transfers from Centre to States | | Items | Revenue/ capital/ loan | Amount (₹ '000 crores) | Difference in estimates (per cent) | Per cent of GDP | | 2018-19 | 2019-20 | 2020-21
RE | 2021-22
BE | 2019-20 actual vs RE | 2020-21
RE vs BE | 2018-19 | 2019-20 | 2020-21
RE | 2021-22
BE | | 1. | Devolution of States' share in taxes | Revenue | 761.5 | 650.7 | 550.0 | 665.6 | -0.8 | -29.9 | 4.0 | 3.2 | 3.3 | 3.5 | | 2. | Finance Commission Grants | | 93.7 | 123.7 | 182.4 | 220.8 | 0.0 | 21.6 | 0.5 | 0.6 | 0.6 | 0.7 | | | a. Grant for Rural Local Bodies | Revenue | 35.1 | 59.4 | 60.8 | 44.9 | 1.3 | -13.1 | 0.2 | 0.3 | 0.3 | 0.3 | | | b. Grants for Urban Local Bodies | Revenue | 14.4 | 25.1 | 25.0 | 22.1 | -2.9 | -16.7 | 0.1 | 0.1 | 0.1 | 0.1 | | | c. Grants-in-aid for SDRF | Revenue | 9.7 | 10.9 | 22.3 | 22.2 | 0.0 | 11.3 | 0.1 | 0.1 | 0.1 | 0.1 | | | d. Post Devolution Revenue Deficit Grants | Revenue | 34.6 | 28.3 | 74.3 | 118.5 | 0.0 | 147.8 | 0.2 | 0.1 | 0.1 | 0.1 | | | e. Sector-specific Grants for Health | Revenue | 0.0 | 0.0 | 0.0 | 13.2 | N/A | N/A | 0.0 | 0.0 | 0.0 | 0.0 | | 3. | Scheme related Transfers | | 286.0 | 289.2 | 358.8 | 363.4 | -10.3 | 6.8 | 1.5 | 1.6 | 1.5 | 1.5 | | | a. Under Centrally Sponsored Schemes | Revenue | 271.5 | 275.4 | 315.2 | 318.9 | -2.7 | 6.8 | 1.4 | 1.4 | 1.4 | 1.3 | | | b. Under Central Sector Schemes | Revenue | 13.6 | 12.9 | 42.4 | 43.0 | -66.3 | 7.4 | 0.1 | 0.2 | 0.1 | 0.2 | | | c. Other Transfers | Revenue | 0.9 | 0.9 | 1.0 | 1.3 | -20.0 | -9.5 | 0.0 | 0.0 | 0.0 | 0.0 | | | d. Capital Transfers | Capital | 0.0 | 0.0 | 0.1 | 0.2 | | | 0.0 | 0.0 | 0.0 | 0.0 | | 4. | Some Important Items of Transfer | | 46.2 | 53.7 | 49.7 | 80.1 | -6.3 | -32.2 | 0.2 | 0.3 | 0.3 | 0.3 | | | a. Special Assistance | Revenue | 4.7 | 1.6 | 3.0 | 15.0 | -59.4 | -80.0 | 0.0 | 0.0 | 0.0 | 0.1 | | | b. Assistance to States from NDRF | Revenue | 10.0 | 18.9 | 10.0 | 12.4 | -5.6 | -60.0 | 0.1 | 0.1 | 0.1 | 0.1 | | | c. Externally aided Projects-Loans | Loans | 23.8 | 24.7 | 32.0 | 46.8 | -1.3 | 28.1 | 0.1 | 0.1 | 0.1 | 0.1 | | | d. Other Transfers | Revenue | 7.8 | 8.5 | 4.6 | 5.9 | 2.2 | -43.9 | 0.0 | 0.0 | 0.0 | 0.0 | | 5. | Back to Back Loans to States in lieu of GST Compensation Shortfall | Loans | 0.0 | 0.0 | 110.2 | 0.0 | N/A | N/A | 0.0 | 0.0 | 0.0 | 0.0 | | 6. | Special Assistance as Loan to States for Capital Expenditure | Loans | 0.0 | 0.0 | 12.0 | 10.0 | N/A | N/A | 0.0 | 0.0 | 0.0 | 0.0 | | 7. | Transfers to Delhi, Puducherry and Jammu and Kashmir | Revenue | 8.0 | 28.2 | 51.0 | 48.7 | -0.9 | 7.5 | 0.0 | 0.1 | 0.1 | 0.2 | | 8. | Gross Transfers to States and UTs (1 to 7) | | 1,195.4 | 1,145.5 | 1,313.9 | 1,388.5 | -3.6 | -5.5 | 6.3 | 5.8 | 5.9 | 6.2 | | | of which | | | | | | | | 0.0 | 0.0 | 0.0 | 0.0 | | | Revenue | | 1,171.6 | 1,120.8 | 1,159.6 | 1,331.5 | -3.6 | -15.1 | 6.2 | 5.7 | 5.8 | 6.1 | | | Capital | | 0.0 | 0.0 | 0.1 | 0.2 | | | 0.0 | 0.0 | 0.0 | 0.0 | | | Loans | | 23.8 | 24.7 | 154.2 | 56.8 | -1.3 | 516.9 | 0.1 | 0.1 | 0.1 | 0.1 | | 9. | Recovery of Loans and Advances | | 14.4 | 12.5 | 12.5 | 12.5 | | | 0.1 | 0.1 | 0.1 | 0.1 | | 10. | Net Resources Transferred to States and UTs (6-7) | | 1,181.0 | 1,133.0 | 1,301.4 | 1,376.0 | -3.5 | -5.6 | 6.3 | 5.8 | 5.8 | 6.2 | | Source: Union budget documents of various years. |
|