The COVID-19-induced spike in household financial savings rate in Q1:2020-21 waned substantially in Q2 in a counter-seasonal manner. While households’ deposits and borrowings picked up, their holdings of currency and savings in mutual funds moderated. Increased household consumption, particularly its discretionary component, could be attributed to resumption in economic activity following the easing of lockdown. The reversal in household financial savings is corroborated by the lower surplus in the current account balance. Household debt to GDP ratio rose sharply to 37.1 per cent in Q2:2020-21 from 35.4 per cent in Q1:2020-21. Preliminary indications suggest that household financial savings rate may have gone down further in Q3:2020-21 with the intensification of consumption and economic activity. Prologue Preliminary estimates for Q2:2020-21 indicate that the household financial savings regressed closer to the pre-pandemic levels to 10.4 per cent of gross domestic product (GDP) after touching the unprecedented high of 21.0 per cent in Q1:2020-21. This reversion is mainly driven by the increase in household borrowings from banks and NBFCs accompanied by a moderation in household financial assets in the form of mutual funds and currency. Nonetheless, households’ financial savings rate for Q2: 2020-21 ruled higher than that of 9.8 per cent witnessed in Q2: 2019-20 (Table 1). With the gradual reopening/unlocking of the economy, households switched from an ‘essentials only’ spending pattern to discretionary spending, which resulted in the reversal of household financial savings from the peak it attained in Q1:2020-21. Following the phased-in easing in the stringency of lockdown restrictions - also reflected in the Oxford COVID-19 Government Stringency Index at 78.5 in Q2:2020-21, down from 85.6 in Q1:2020-21 - some constituents of consumption, particularly discretionary, picked up after a quarter long dormancy, which, in turn, led to the moderation in financial savings of households. The trend reversal in household financial savings is also corroborated by the reduced contraction in private final consumption expenditure as also the lower surplus in the current account in Q2:2020-21. Furthermore, the pick-up in private consumption is reflected in various high frequency indicators for the second quarter. For example, production of consumer durables, which registered a contraction of 67.6 per cent in Q1:2020-21 moved into the positive territory towards the end of Q2 with a positive growth of 5.3 per cent in September 2020. Production of non-durables also got reinforced at a positive growth of 0.4 per cent in Q2: 2020-21 vis-à-vis a de-growth of 16.9 per cent in Q1. Consumption of motor spirits and high-speed diesel after contracting by 35.9 per cent and 33.3 per cent, respectively, in Q1:2020-21, recovered as reflected in the reduced contraction of 5.0 per cent and 15.6 per cent, respectively, in the next quarter. Consequently, the pace of contraction in private final consumption eased to 11.3 per cent in Q2:2020-21 from the sharp contraction of 26.3 per cent in Q1:2020-21 as per the quarterly estimates of GDP. The second quarter moderation in household financial savings, however, was counter-seasonal and reflected the impact of high base sequentially and a pick up in discretionary spending of households post easing of lockdown restrictions with a jump from pent up demand. | Table 1: Household Financial Savings | | (₹ lakh crore) | | | 2018-19 | 2019-20 | 2020-21 | | Q1 | Q2 | Q3 | Q4 | Annual | Q1 | Q2 | Q3 | Q4 | Annual | Q1 | Q2 | | Net Financial Assets (A-B) | 2.57 | 2.23 | 2.08 | 6.68 | 13.56 | 2.02 | 4.85 | 4.20 | 5.14 | 16.20 | 8.16 | 4.92 | | | (5.6) | (4.8) | (4.3) | (13.9) | (7.2) | (4.0) | (9.8) | (8.1) | (9.8) | (8.0) | (21.0) | (10.4) | | A. Flow of Financial Assets | 3.49 | 4.77 | 3.46 | 9.62 | 21.34 | 3.83 | 5.65 | 5.51 | 7.86 | 22.85 | 7.38 | 7.47 | | | (7.6) | (10.3) | (7.1) | (20.0) | (11.3) | (7.7) | (11.4) | (10.6) | (15.1) | (11.2) | (19.0) | (15.8) | | B. Flow of Financial Liabilities | 0.91 | 2.55 | 1.38 | 2.94 | 7.78 | 1.81 | 0.80 | 1.31 | 2.72 | 6.64 | -0.78 | 2.55 | | | (2.0) | (5.5) | (2.8) | (6.1) | (4.1) | (3.6) | (1.6) | (2.5) | (5.2) | (3.3) | (-2.0) | (5.4) | Note: Data in parenthesis are as per cent to GDP.
Source: Authors’ calculations. | While real GDP contraction of 24.4 per cent in Q1:2020-21 was accompanied by household financial savings rate of 21.0 per cent, a moderation in GDP contraction to 7.3 per cent in Q2 coincided with the reduction in household financial savings rate to 10.4 per cent. The inverse relation between household financial savings rate and GDP growth may sound counterintuitive, but studies have shown that households tend to save more during the economic slowdown and greater income uncertainty [Levanon and Franco, 20111; Mody et. al., 2012]. A similar trend was observed during the global financial crisis when household financial savings rate increased by 170 basis points as per cent to GDP during 2008-09, which moderated subsequently as the economy picked up. The rest of the article is divided into four sections. Section II presents the cross-country trend of household savings vis-à-vis financial savings in India. Section III brings out the variation in the composition of household financial assets and liabilities over the preceding quarter including some reflections on household debt-GDP ratio. Section IV encapsulates major movements, sector and instrument-wise, in both the assets and liabilities of households’ balance sheet at the micro-foundation level. Section V sets out the outlook on financial savings in Q3:2020-21. Instrument-wise flows of household financial assets and liabilities, including outstanding of select assets and liabilities are provided in Annex I, II and III. II. Cross-Country Trend in Household Savings Globally, the quantum and composition of spending witnessed visible changes as the pandemic-induced mobility restrictions resulted in forced and precautionary savings during Q1 of 2020-21 (Chart 1). With the cautious recovery of economic activity the tendency to accumulate forced/ precautionary savings reduced in Q2:2020-21 following the release of pent-up demand for goods, more than services. As many advanced economies faced hiccups in their journey to recovery, inflicted by the second wave of the virus and fear of more virulent strains, their household/ personal savings in July-September quarter remained far higher than the pre-pandemic levels. The household/personal savings rates in the US2, the UK3, Australia4 and Canada5, which moved up to more than 20 per cent mark in April-June 2020, corrected significantly in the next quarter but sustained at a much higher rate than the pre-pandemic levels. In contrast, financial savings of Indian households reverted closer to the pre-pandemic levels. It is also interesting to observe that the pre-pandemic seasonal patterns in household/personal savings in Australia and India are quite similar. In Canada, the spike in the April-June quarter was one of the sharpest considering a very low level of household/personal savings rate in the pre-pandemic phase. 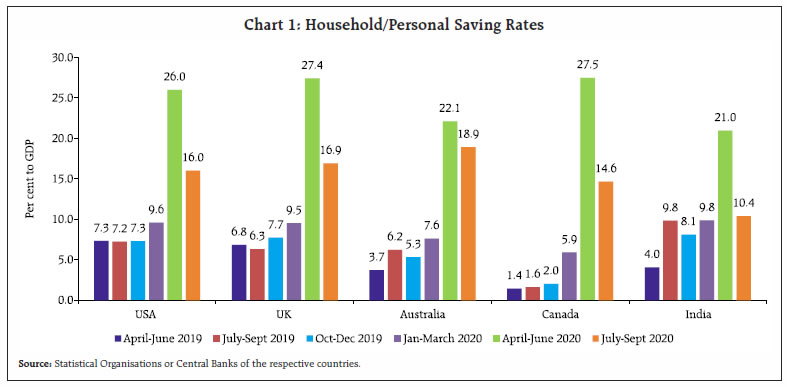 India appeared to be faster in raising spending probably on account of the approaching festive season demand along with the release of pent up demand, thereby reaching closer to the pre-pandemic levels of household financial savings in Q2:2020-21. Although the aggregate savings increased during the pandemic, it, however, might conceal the unequal impact in terms of household savings and consumption expenditures of non-essential items as several households in the unorganised sector suffered from loss of employment, income and borrowing opportunities. Moving forward, with the optimism on progress in mass vaccination, household financial savings are expected to recede further to the pre-pandemic levels in India as well as in other countries. III. Composition of Household Financial Portfolio and Debt-GDP Ratio Over the quarters, the share of different instruments in the household financial portfolio has remained stable with the banking sector dominating both on the assets and liabilities sides. Apart from the banking sector, life insurance and mutual funds are the two other major instruments held by households along with currency, whereas borrowings from non-banking financial companies (NBFCs) and housing finance companies (HFCs) constitute the other dominant portions of their liabilities. Borrowings of households from the corporate sector and general government remain negligible (Chart 2). Although, the share of various instruments on the asset side of household portfolio has broadly remained unchanged during Q1:2018-19 to Q2:2020-21, the share of currency holding, which increased during Q1:2020-21 - reflecting flight to cash under extreme uncertainty - has reversed to its pre-pandemic levels with the resumption of economic activity in Q2. On the liabilities side, the share of household liabilities from the banking and HFCs sector have come down while that of NBFCs has increased from Q1:2020-21 onwards. The shift in favour of NBFCs in times of economic crisis and pessimism on future stream of income flow could be attributed to the increased risk aversion and tighter eligibility criteria for bank loans vis-à-vis NBFCs. 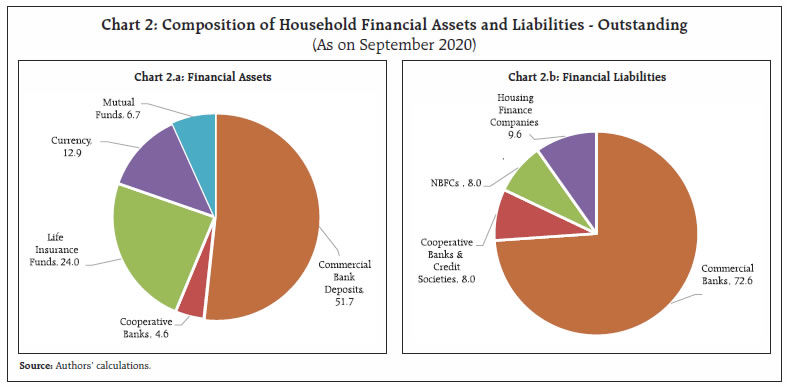 Household debt6 to GDP ratio, which has been steadily increasing since Q1:2018-19 rose sharply to 37.1 per cent in Q2:2020-21 from 35.4 per cent in Q1:2020-21. Data for India’s household debt, presented here, however, do not capture their indebtedness towards the non-institutional sector. A Bank for International Settlements (BIS) study based on the level and trend of household debt (as a ratio to GDP) since the global financial crisis has classified countries into four categories: i) high and rising, ii) high and flat/falling, iii) low and rising, iv) low and flat/falling (Zabai, 2017). As per the study, India is in the fourth group of countries along with Euro Area, Japan, Germany, Italy and Mexico. More recently, comparable data for 2019 from the International Monetary Fund (IMF) also show that in terms of household debt to GDP ratio, comprising of loans and debt securities, India is positioned in the bottom group (Chart 3). Aggregate bank deposits with scheduled commercial banks (SCBs) in India steadily rose and touched ₹142.6 lakh crore at end-September 2020 - an increase of ₹4.0 lakh crore since end-June 2020. In contrast, bank advances at ₹102.7 lakh crore at end-September displayed a pick up by 0.2 per cent on a q-o-q basis as against a contraction of 1.2 per cent in June 2020, reflecting some pick-up in economic activity. The reduced gap between the credit extended to and deposits mobilised from households during the July-September quarter of 2020, contributed towards moderation in net financial savings of households. IV. Household Financial Savings: Sectors and Instruments In search of micro-foundation, the varied behaviour of the household asset/liability flows in Q2:2020-21 is examined in terms of sectors and instruments as under (Chart 4). -
The moderation in household financial savings has taken place despite an increase in their financial assets, as the flow of financial liabilities has returned to positive territory in Q2:2020-21. The flow of household financial assets has increased led by their deposits with banks, despite a significant drop in their holding of currency and mutual funds (Annex I). -
The flow of household financial assets as per cent to GDP has, however, moderated from 19.0 per cent in Q1:2020-21 to 15.8 per cent in Q2:2020-21. Currency holding of households has moderated to 0.4 per cent of GDP in Q2:2020-21 from 5.3 per cent in Q1:2020-21. Household investment in mutual fund products is estimated to have declined to 0.3 per cent from 1.7 per cent over the same period. Similarly, savings in the form of insurance products moderated to 3.0 per cent from 3.2 per cent in the previous quarter (Chart 5a and Annex I). -
Household financial savings in the form of deposits with banks increased during Q2:2020-21, reflecting restoration of their safe haven status as India’s banking system faced the pandemic with relatively sound capital and liquidity buffers built assiduously in the aftermath of the global financial crisis and nudged by various prudential regulatory measures (RBI, 2020; RBI, 2021). Banks’ performance and stability improved on the back of regulatory reliefs and concessions. However, household deposits with non-banks declined during the period. 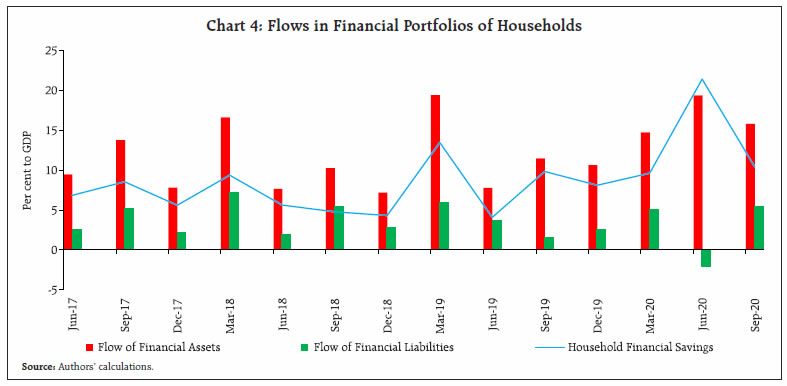 -
The reduction in cash holding rate of households mainly reflected the lower uncertainty with the unlocking of the economy and resumption of economic activity. The process was also facilitated by greater use of digital modes for conducting transactions in the wake of the pandemic (RBI, 2021). - Despite moderation in accretion, subscription rate to insurance funds by households remained high, reflecting the pandemic led increased awareness of life insurance amongst the households in Q2:2020-21. From being an instrument purchased for tax-saving, insurance policies have, thus, become a part of the lifestyle of households in these times of a health emergency.
-
Subscription rate to pension and provident funds also remained elevated despite some moderation in Q2:2020-21, reflecting the intensification of efforts towards expanding the coverage of unorganised sector and the low-income groups under the pension net by the Government of India. Enrolment as well as assets under management (AUM) of the National Pension System (NPS) and Atal Pension Yojana (APY) increased on a y-o-y basis at end-September 2020 (RBI, 2021). -
Household savings in mutual funds, however, declined during Q2:2020-21 as the sharp recovery in stock markets led to possible direct investment by individuals in equities instead of mutual funds, as reflected in 34 lakh new dematerialised or demat accounts opened during the quarter ending September as against 23 lakh opened during April-June quarter. A recent regulatory move on mutual fund8 also reportedly contributed to redemption pressure on the multi-cap mutual funds. -
Household investment in shares declined during Q2:2020-21 in comparison to the previous quarter as there was one mega rights issue of ₹53,125 crore in Q1:2020-21. 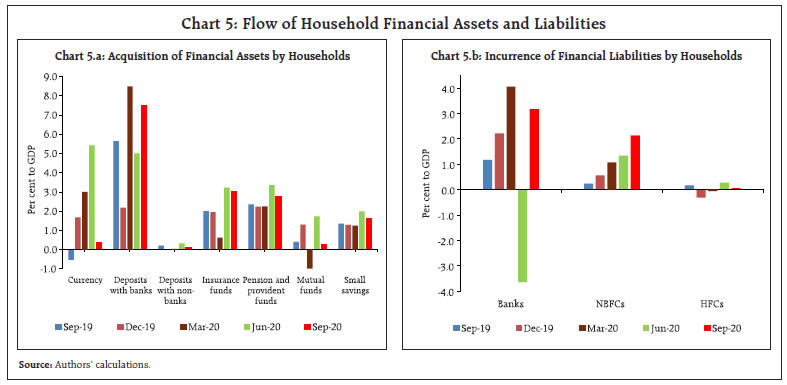 -
The flow in financial liabilities of households is estimated to have entered the positive territory on the back of loans from banks and NBFCs. The pick-up is a reflection of the rebound in economic activity in Q2:2020-21, quicker than expected, as also of the positive outlook after the nationwide lockdown was gradually lifted (Chart 5b). -
Credit flows in personal loans of scheduled commercial banks (SCBs), vehicle loans, consumer durables and credit cards turned the corner by posting positive growth in Q2:2020-21 as against a contraction in the previous quarter. The credit growth for housing strengthened further to 1.3 per cent in Q2:2020-21 from 0.4 per cent in Q1. -
The significant pick-up in household loans, juxtaposed with a tepid growth in aggregate bank credit was reflected in the increase in household share in total credit by 1.3 percentage points to 51.5 per cent in Q2:2020-21 from the previous quarter. In alignment with the banking sector, credit flow from NBFCs to households witnessed an increase in Q2:2020-21 even though their overall credit growth took a beating in Q2 vis-à-vis Q1. V. The Way Ahead With the gradual reopening/unlocking of the economy, households have switched from an ‘essentials only’ approach to discretionary spending, which is also reflected in the reduced pace of contraction in private consumption to 11.3 per cent compared with 26.3 per cent contraction in Q1:2020-21, leading to the moderation of household financial savings from the peak in the previous quarter. The reversal in the Indian context has been sharper in contrast to many of the European countries faced with the second wave of the virus including that of more virulent strains. The reversal in India’s household financial savings also intensified in light of the release of pent-up demand for goods and to some extent, for services. The COVID-19 pandemic has impacted the insurance sector globally. In the wake of rising claims, the International Association of Insurance Supervisors (IAIS) in a statement highlighted the limits on the protection that the insurance sector by itself could be expected to provide. In view of the multifarious risks arising in the wake of the pandemic, the Insurance Regulatory and Development Authority of India (IRDAI) constituted a Working Group to explore the possibility of addressing these risks through the mechanism of a “Pandemic Risk Pool” (RBI, 2021). Going forward, the rising awareness about insurance funds may attract more households to these products. In the wake of lower returns on bank deposits, and growing awareness about the competing instruments, particularly insurance and mutual funds, the pre-pandemic trend of diversification of household financial assets may accentuate further. Household financial savings have moderated despite an increase in the savings in the form of deposits as household borrowings from banks and NBFCs have picked up. On January 22, 2021, the Reserve Bank proposed a revised regulatory framework for NBFCs based on a four layered structure that would allow big NBFCs to be regulated like banks. When implemented, this may impact the distribution of household portfolio between banks and non-banks. A significant decline in household savings in the form of currency and mutual funds has also contributed to the moderation in household financial savings. Savings in the form of insurance funds have remained elevated, despite moderation in accretion in Q2:2020-21. Going forward, optimism on account of mass vaccination is expected to further boost consumption demand and work further towards restoration of the pre-pandemic spending and saving pattern. The Reserve Bank’s consumer confidence survey of November 2020 round showed a marginal improvement over the all-time low recorded in the September 2020 round, indicating scope for further moderation in household financial saving, going forward. Additionally, SCBs advances at end-December displayed a significant pick up of 2.7 per cent on a q-o-q basis from a tepid growth of 0.2 per cent in the previous quarter while deposits moderated to 1.5 per cent as against 2.9 per cent over the same period. This could be symptomatic of a further moderation in household financial savings rate during Q3:2020-21, though buoyant stock markets may provide some offset by portfolio re-balancing by households through investments in shares and debentures, including units of mutual funds. References: Levanon, Gad and Lynn Franco (2011), “The Great Recession and Household Savings”, The Conference Board, February 2011. Mody, A., Ohnsorge, F., & Sandri, D. (2012), ‘‘Precautionary savings in the great recession’’, IMF Economic Review, 60 (1), 114-138. RBI (2020), Report on Trend and Progress of Banking in India 2019-20, Reserve Bank of India. RBI (2021), Financial Stability Report , Issue No. 22, January, Reserve Bank of India. Zabai, Anna (2017), “Household debt: recent developments and challenges”, BIS Quarterly Review, December 2017.
Annex I
Financial Assets of Households: Gross Flows (Contd.) | | (₹ Crore) | | Item | 2018-19 | | Q1 | Q2 | Q3 | Q4 | Annual | | Financial Assets | 3,48,568.2 | 4,77,165.0 | 3,46,489.3 | 9,61,845.5 | 21,34,068.0 | | of which: | | | | | | | 1. Total Deposits (a)+(b) | -55,939.4 | 3,01,417.0 | 21,884.7 | 5,42,776.4 | 8,10,138.7 | | (a) Bank Deposits | -65,261.8 | 2,92,618.3 | 13,121.4 | 5,39,472.8 | 7,79,950.6 | | i. Commercial Bank Deposits | -62,126.9 | 2,89,468.1 | 10,634.6 | 4,90,680.6 | 7,28,656.4 | | ii. Cooperative Banks | -3,134.9 | 3,150.2 | 2,486.8 | 48,792.1 | 51,294.2 | | (b) Non-Bank Deposits | 9,322.4 | 8,798.7 | 8,763.3 | 3,303.6 | 30,188.1 | | 2. Life Insurance Funds | 63,747.6 | 95,463.2 | 47,456.3 | 1,50,854.6 | 3,57,521.6 | | 3. Provident and Pension Funds (including PPF) | 98,461.4 | 97,964.4 | 99,515.4 | 10,3367.4 | 3,99,308.5 | | 4. Currency | 1,11,589.6 | -32,134.4 | 1,02,656.5 | 95,760.4 | 2,77,872.1 | | 5. Investments | 78,397.2 | -37,856.9 | 22,664.7 | 16,774.9 | 79,979.8 | | of which | | | | | | | i. Mutual Funds | 69,897.4 | -46,008.0 | 21,369.6 | 12,342.5 | 57,601.4 | | ii. Equity | 2,001.2 | 3,054.4 | 471.0 | 855.8 | 6,382.4 | | 6. Small Savings (excluding PPF) | 51,259.6 | 51,259.6 | 51,259.6 | 51,259.6 | 2,05,038.3 | | As per cent to GDP | | Financial Assets | 7.6 | 10.3 | 7.1 | 20.0 | 11.2 | | of which: | | | | | | | 1. Total Deposits (a)+(b) | -1.2 | 6.5 | 0.4 | 11.3 | 4.3 | | (a) Bank Deposits | -1.4 | 6.3 | 0.3 | 11.2 | 4.1 | | i. Commercial Bank Deposits | -1.4 | 6.2 | 0.2 | 10.2 | 3.8 | | ii. Cooperative Banks | -0.1 | 0.1 | 0.1 | 1.0 | 0.3 | | (b) Non-Bank Deposits | 0.2 | 0.2 | 0.2 | 0.1 | 0.2 | | 2. Life Insurance Funds | 1.4 | 2.1 | 1.0 | 3.1 | 1.9 | | 3. Provident and Pension Funds (including PPF) | 2.2 | 2.1 | 2.0 | 2.2 | 2.1 | | 4. Currency | 2.4 | -0.7 | 2.1 | 2.0 | 1.5 | | 5. Investments | 1.7 | -0.8 | 0.5 | 0.3 | 0.4 | | of which | | | | | | | i. Mutual Funds | 1.5 | -1.0 | 0.4 | 0.3 | 0.3 | | ii. Equity | … | 0.1 | … | … | … | | 6. Small Savings (excluding PPF) | 1.1 | 1.1 | 1.1 | 1.1 | 1.1 | ... : Negligible.
Source : Authors’ calculations. |
Annex I
Financial Assets of Households: Gross Flows (Concld.) | | (₹ Crore) | | Item | 2019-20 | 2020-21 | | Q1 | Q2 | Q3 | Q4 | Annual | Q1 | Q2 | | Financial Assets | 3,83,124.6 | 5,64,598.2 | 5,50,679.8 | 7,86,160.4 | 22,84,563.0 | 7,38,208.1 | 7,46,821.4 | | of which: | | | | | | | | | 1. Total Deposits (a)+(b) | 7,811.9 | 2,88,775.0 | 1,13,439.5 | 4,55,464.1 | 8,65,490.5 | 1,25,848.6 | 3,67,264.2 | | (a) Bank Deposits | -7,074.1 | 2,78,084.6 | 1,13,314.3 | 4,52,959.0 | 8,37,283.8 | 1,13,327.7 | 3,62,343.5 | | i. Commercial Bank Deposits | -13293.8 | 2,69,475.5 | 63,997.5 | 4,48,586.5 | 7,68,765.7 | 1,17,962.1 | 3,51,860.2 | | ii. Cooperative Banks | 6,219.7 | 8,609.1 | 49,316.8 | 4,372.4 | 68,518.1 | -4,634.4 | 10,483.3 | | (b) Non-Bank Deposits | 14,886.0 | 10,690.4 | 125.3 | 2,505.1 | 28,206.8 | 12,521.0 | 4,920.7 | | 2. Life Insurance Funds | 1,08,873.1 | 99,209.1 | 1,01,373.7 | 33,549.3 | 3,43,005.2 | 1,23,324.5 | 1,42,422.5 | | 3. Provident and Pension Funds (including PPF) | 106969.6 | 1,09,961.6 | 1,10,044.6 | 1,13,602.6 | 4,40,578.3 | 1,19,308.7 | 1,21,831.7 | | 4. Currency | 61,637.1 | -26,104.8 | 86,843.5 | 1,60,255.1 | 2,82,630.8 | 2,06,889.6 | 17,225.3 | | 5. Investments | 29,703.1 | 24,627.5 | 70,848.6 | -44,840.5 | 80,338.6 | 85,893.1 | 21,134.2 | | of which | | | | | | | | | i. Mutual Funds | 8,578.0 | 20,198.4 | 67,521.1 | -51,926.1 | 44,371.5 | 66,195.3 | 11,909.0 | | ii. Equity | 18,644.7 | 2,172.4 | 936.2 | 4,980.4 | 26,733.7 | 18,599.2 | 8,291.5 | | 6. Small Savings (excluding PPF) | 67,065.7 | 67,065.7 | 67,065.7 | 67,065.7 | 2,68,262.9 | 75,879.4 | 75,879.4 | | As per cent to GDP | | Financial Assets | 7.7 | 11.4 | 10.6 | 15.1 | 11.2 | 19.0 | 15.8 | | of which: | | | | | | | | | 1. Total Deposits (a)+(b) | 0.2 | 5.8 | 2.2 | 8.7 | 4.3 | 3.2 | 7.8 | | (a) Bank Deposits | -0.1 | 5.6 | 2.2 | 8.7 | 4.1 | 2.9 | 7.6 | | i. Commercial Bank Deposits | -0.3 | 5.5 | 1.2 | 8.6 | 3.8 | 3.0 | 7.4 | | ii. Cooperative Banks | 0.1 | 0.2 | 1.0 | 0.1 | 0.3 | -0.1 | 0.2 | | (b) Non-Bank Deposits | 0.3 | 0.2 | … | … | 0.1 | 0.3 | 0.1 | | 2. Life Insurance Funds | 2.2 | 2.0 | 2.0 | 0.6 | 1.7 | 3.2 | 3.0 | | 3. Provident and Pension Funds (including PPF) | 2.1 | 2.2 | 2.1 | 2.2 | 2.2 | 3.1 | 2.6 | | 4. Currency | 1.2 | -0.5 | 1.7 | 3.1 | 1.4 | 5.3 | 0.4 | | 5. Investments, of which | 0.6 | 0.5 | 1.4 | -0.9 | 0.4 | 2.2 | 0.4 | | of which | | | | | | | | | i. Mutual Funds | 0.2 | 0.4 | 1.3 | -1.0 | 0.2 | 1.7 | 0.3 | | ii. Equity | 0.4 | … | … | 0.1 | 0.1 | 0.5 | 0.2 | | 6. Small Savings (excluding PPF) | 1.3 | 1.4 | 1.3 | 1.3 | 1.3 | 1.9 | 1.6 | ... : Negligible.
Source : Authors’ calculations. |
Annex II
Financial Liabilities of Households: Gross Flows (Contd.) | | (₹ Crore) | | Item | 2018-19 | | Q1 | Q2 | Q3 | Q4 | Annual | | Financial Liabilities | 91,404.7 | 25,4518.4 | 1,38,159.7 | 2,94,278.0 | 7,78,360.8 | | Loans (Borrowings) from | | | | | | | A. Financial Corporations (i+ii) | 91,217.9 | 2,54,331.7 | 1,37,973.0 | 2,94,091.3 | 7,77,613.9 | | (i) Banking Sector | 47,825.7 | 1,70,950.3 | 1,40,677.9 | 2,49,387.0 | 6,08,840.8 | | of which: | | | | | | | Commercial banks | 39,856.4 | 1,69,638.4 | 1,41,334.6 | 2,23,609.8 | 5,74,439.2 | | (ii) Other Financial Institutions | 43,392.3 | 83,381.4 | -2,704.9 | 44,704.3 | 1,68,773.0 | | (a) Non-Banking Financial Companies | 15,260.0 | 52,605.2 | -3,755.8 | 28,952.6 | 93,062.0 | | (b) Housing Finance Companies | 23,560.2 | 28,328.8 | -786.8 | 14,118.7 | 65,220.9 | | (c) Insurance Companies | 4,572.1 | 2,447.4 | 1,837.7 | 1,633.0 | 10,490.1 | | B. Non-Financial Corporations (Private Corporate Business) | 49.0 | 49.0 | 49.0 | 49.0 | 196.1 | | C. General Government | 137.7 | 137.7 | 137.7 | 137.7 | 550.7 | | As per cent to GDP | | Financial Liabilities | 2.0 | 5.5 | 2.8 | 6.1 | 4.1 | | Loans (Borrowings) from | | | | | | | A. Financial Corporations (i+ii) | 2.0 | 5.5 | 2.8 | 6.1 | 4.1 | | (i) Banking Sector | 1.0 | 3.7 | 2.9 | 5.2 | 3.2 | | of which: | | | | | | | Commercial banks | 0.9 | 3.6 | 2.9 | 4.7 | 3.0 | | (ii) Other Financial Institutions | 1.0 | 1.8 | -0.1 | 0.9 | 0.9 | | (a) Non-Banking Financial Companies | 0.3 | 1.1 | -0.1 | 0.6 | 0.5 | | (b) Housing Finance Companies | 0.5 | 0.6 | ... | 0.3 | 0.3 | | (c) Insurance Companies | 0.1 | 0.1 | ... | ... | 0.1 | | B. Non-Financial Corporations (Private Corporate Business) | ... | ... | ... | ... | ... | | C. General Government | ... | ... | ... | ... | ... | ... : Negligible.
Source : Authors’ calculations. |
Annex II
Financial Liabilities of Households: Gross Flows (Concld.) | | (₹ Crore) | | Item | 2019-20 | 2020-21 | | Q1 | Q2 | Q3 | Q4 | Annual | Q1 | Q2 | | Financial Liabilities | 1,81,090.7 | 79,839.0 | 1,30,840.9 | 2,72,337.1 | 66,4107.7 | -77,678.5 | 2,54,915.2 | | Loans (Borrowings) from | | | | | | | | | A. Financial Corporations (i+ii) | 1,81,011.8 | 79,760.1 | 1,30,762.0 | 2,72,258.2 | 6,63,792.1 | -77,757.5 | 2,54,836.2 | | (i) Banking Sector | 1,61,317.2 | 57,886.0 | 1,15,246.1 | 2,16,572.4 | 5,51,021.7 | -1,38,472.5 | 1,49,880.3 | | of which: | | | | | | | | | Commercial banks | 1,35,575.1 | 56,900.7 | 85,897.8 | 2,05,938.4 | 4,84,311.9 | -1,30,636.5 | 1,35,587.1 | | (ii) Other Financial Institutions | 19,694.6 | 21,874.1 | 15,515.9 | 55,685.8 | 1,12,770.4 | 60,715.0 | 1,04,955.9 | | (a) Non-Banking Financial Companies | -519.7 | 11,651.3 | 29,216.9 | 57,511.4 | 97,860.0 | 51,035.5 | 1,01,056.9 | | (b) Housing Finance Companies | 17,033.0 | 8,093.1 | -15,710.4 | -3,093.1 | 6,322.6 | 10,516.6 | 2,875.1 | | (c) Insurance Companies | 3,181.3 | 2,129.7 | 2,009.4 | 1,267.4 | 8,587.8 | -837.1 | 1,023.9 | | B. Non-Financial Corporations (Private Corporate Business) | 49.0 | 49.0 | 49.0 | 49.0 | 196.1 | 49.2 | 49.2 | | C. General Government | 29.9 | 29.9 | 29.9 | 29.9 | 119.4 | 29.9 | 29.9 | | As per cent to GDP | | Financial Liabilities | 3.6 | 1.6 | 2.5 | 5.2 | 3.3 | -2.0 | 5.4 | | Loans (Borrowings) from | | | | | | | | | A. Financial Corporations (i+ii) | 3.6 | 1.6 | 2.5 | 5.2 | 3.3 | -2.0 | 5.4 | | (i) Banking Sector | 3.2 | 1.2 | 2.2 | 4.1 | 2.7 | -3.6 | 3.2 | | of which: | | | | | | | | | Commercial banks | 2.7 | 1.2 | 1.7 | 3.9 | 2.4 | -3.4 | 2.9 | | (ii) Other Financial Institutions | 0.4 | 0.4 | 0.3 | 1.1 | 0.6 | 1.6 | 2.2 | | (a) Non-Banking Financial Companies | 0.0 | 0.2 | 0.6 | 1.1 | 0.5 | 1.3 | 2.1 | | (b) Housing Finance Companies | 0.3 | 0.2 | -0.3 | -0.1 | ... | 0.3 | 0.1 | | (c) Insurance Companies | 0.1 | ... | ... | ... | ... | ... | ... | | B. Non-Financial Corporations (Private Corporate Business) | ... | ... | ... | ... | ... | ... | ... | | C. General Government | ... | ... | ... | ... | ... | ... | ... | ... : Negligible.
Source : Authors’ calculations. |
Annex III
Assets and Liabilities of Households: Select Instruments (Contd.) | | (₹ Crore) | | Item | 2018-19 | | Q1 | Q2 | Q3 | Q4 | | Gross Financial Assets | | of which: | | | | | | a. Bank Deposits (i+ii) | 80,16,804.2 | 83,09,422.5 | 83,22,543.8 | 88,62,016.6 | | i. Commercial Bank deposits | 73,54,053.7 | 76,43,521.8 | 76,54,156.4 | 81,44,837.0 | | ii. Cooperative Banks | 6,62,750.5 | 6,65,900.7 | 6,68,387.4 | 7,17,179.6 | | b. Life Insurance Funds | 34,83,772.7 | 35,77,442.2 | 36,61,493.5 | 37,85,298.5 | | c. Currency | 17,82,923.3 | 17,50,788.9 | 18,53,445.4 | 19,49,205.8 | | d. Mutual fund | 11,93,500.8 | 11,50,708.8 | 11,93,246.1 | 12,42,184.1 | | Total (a+b+c+d) | 1,44,77,001.0 | 1,47,88,362.4 | 1,50,30,728.8 | 1,58,38,705.0 | | As per cent to GDP | | a. Bank Deposits (i+ii) | 45.4 | 45.8 | 44.6 | 46.9 | | i. Commercial Bank deposits | 41.7 | 42.1 | 41.0 | 43.1 | | ii. Cooperative Banks | 3.8 | 3.7 | 3.6 | 3.8 | | b. Life Insurance Funds | 19.7 | 19.7 | 19.6 | 20.0 | | c. Currency | 10.1 | 9.7 | 9.9 | 10.3 | | d. Mutual fund | 6.8 | 6.3 | 6.4 | 6.6 | | Total (a+b+c+d) | 82.0 | 81.5 | 80.5 | 83.9 | | Financial Liabilities | | A. Financial Corporations (i+ii) | 55,38,093.5 | 57,92,425.2 | 59,30,398.2 | 62,24,489.4 | | (i) Banking Sector | 44,38,575.4 | 46,09,525.8 | 47,50,203.7 | 49,99,590.6 | | of which: | | | | | | Commercial Banks | 39,79,179.8 | 41,48,818.2 | 42,90,152.8 | 45,13,762.6 | | Cooperative Banks & Credit Societies | 4,58,988.3 | 4,60,294.8 | 4,59,632.6 | 4,85,404.3 | | (ii) Other Financial Institutions | 10,99,518.0 | 11,82,899.4 | 11,80,194.5 | 12,24,898.8 | | of which: | | | | | | (a) Non-Banking Financial Companies | 3,74,640.0 | 4,27,245.2 | 4,23,489.4 | 4,52,442.0 | | (b) Housing Finance Companies | 6,14,618.4 | 6,42,947.2 | 6,42,160.4 | 6,56,279.2 | | As per cent to GDP | | A. Financial Corporations (i+ii) | 31.4 | 31.9 | 31.8 | 33.0 | | (i) Banking Sector | 25.2 | 25.4 | 25.4 | 26.5 | | of which: | | | | | | Commercial Banks | 22.5 | 22.9 | 23.0 | 23.9 | | Cooperative Banks & Credit Societies | 2.6 | 2.5 | 2.5 | 2.6 | | (ii) Other Financial Institutions | 6.2 | 6.5 | 6.3 | 6.5 | | of which: | | | | | | (a) Non-Banking Financial Companies | 2.1 | 2.4 | 2.3 | 2.4 | | (b) Housing Finance Companies | 3.5 | 3.5 | 3.4 | 3.5 | | Source : Authors’ calculations. |
Annex III
Assets and Liabilities of Households: Select Instruments (Concld.) | | (₹ Crore) | | Item | 2019-20 | 2020-21 | | Q1 | Q2 | Q3 | Q4 | Q1 | Q2 | | Gross Financial Assets | | of which: | | | | | | | | a. Bank Deposits (i+ii) | 88,54,942.5 | 91,33,027.1 | 92,46,341.4 | 96,99,300.4 | 98,12,628.0 | 1,01,74,971.5 | | i. Commercial Bank deposits | 81,31,543.2 | 84,01,018.7 | 84,65,016.2 | 89,13,602.7 | 90,31,564.8 | 93,83,425.0 | | ii. Cooperative Banks | 7,23,399.3 | 7,32,008.4 | 7,81,325.2 | 7,85,697.6 | 7,81,063.2 | 7,91,546.5 | | b. Life Insurance Funds | 38,99,633.0 | 40,03,691.7 | 41,10,052.2 | 41,44,294.2 | 42,74,225.4 | 44,24,463.7 | | c. Currency | 20,10,842.9 | 19,84,738.1 | 20,71,581.5 | 22,31,836.6 | 24,38,726.3 | 24,55,951.6 | | d. Mutual fund | 12,65,870.9 | 12,79,310.8 | 13,85,427.2 | 11,62,077.9 | 13,30,498.9 | 14,02,082.6 | | Total (a+b+c+d) | 1,60,31,289.3 | 1,64,00,767.8 | 1,68,13,402.3 | 1,72,37,509.1 | 1,78,56,078.6 | 1,84,57,469.3 | | As per cent to GDP | | a. Bank Deposits (i+ii) | 45.8 | 46.6 | 46.4 | 47.7 | 51.0 | 53.5 | | i. Commercial Bank deposits | 42.1 | 42.8 | 42.5 | 43.8 | 46.9 | 49.3 | | ii. Cooperative Banks | 3.7 | 3.7 | 3.9 | 3.9 | 4.1 | 4.2 | | b. Life Insurance Funds | 20.2 | 20.4 | 20.6 | 20.4 | 22.2 | 23.2 | | c. Currency | 10.4 | 10.1 | 10.4 | 11.0 | 12.7 | 12.9 | | d. Mutual fund | 6.6 | 6.5 | 7.0 | 5.7 | 6.9 | 7.4 | | Total (a+b+c+d) | 83.0 | 83.6 | 84.4 | 84.7 | 92.8 | 97.0 | | Financial Liabilities | | A. Financial Corporations (i+ii) | 64,05,501.2 | 64,85,261.3 | 66,16,023.3 | 68,88,281.5 | 68,10,523.9 | 70,65,360.1 | | (i) Banking Sector | 51,60,907.8 | 52,18,793.8 | 53,34,039.9 | 55,50,612.3 | 54,12,139.7 | 55,62,020.1 | | of which: | | | | | | | | Commercial Banks | 46,49,337.7 | 47,06,238.4 | 47,92,136.2 | 49,98,074.6 | 48,67,438.1 | 50,03,025.3 | | Cooperative Banks & Credit Societies | 5,10,908.4 | 5,11,655.8 | 5,40,766.1 | 5,51,158.9 | 5,42,978.8 | 5,56,804.4 | | (ii) Other Financial Institutions | 12,44,593.4 | 12,66,467.5 | 12,81,983.4 | 13,37,669.2 | 13,98,384.2 | 15,03,340.1 | | of which: | | | | | | | | (a) Non-Banking Financial Companies | 4,51,922.3 | 4,63,573.6 | 4,92,790.6 | 5,50,302.0 | 6,01,337.5 | 7,02,394.4 | | (b) Housing Finance Companies | 6,73,312.1 | 6,81,405.2 | 6,65,694.8 | 6,62,601.7 | 6,73,118.3 | 6,75,993.4 | | As per cent to GDP | | A. Financial Corporations (i+ii) | 33.1 | 33.1 | 33.2 | 33.8 | 35.4 | 37.1 | | (i) Banking Sector | 26.7 | 26.6 | 26.8 | 27.3 | 28.1 | 29.2 | | of which: | | | | | | | | Commercial Banks | 24.1 | 24.0 | 24.0 | 24.6 | 25.3 | 26.3 | | Cooperative Banks & Credit Societies | 2.6 | 2.6 | 2.7 | 2.7 | 2.8 | 2.9 | | (ii) Other Financial Institutions | 6.4 | 6.5 | 6.4 | 6.6 | 7.3 | 7.9 | | of which: | | | | | | | | (a) Non-Banking Financial Companies | 2.3 | 2.4 | 2.5 | 2.7 | 3.1 | 3.7 | | (b) Housing Finance Companies | 3.5 | 3.5 | 3.3 | 3.3 | 3.5 | 3.6 | | Source : Authors’ calculations. |
|