ACKNOWLEDGEMENT The Committee would like to thank the State Finance Secretaries/ other Officials of State Governments and Ministry of Finance, Government of India for their valuable suggestions and participation in the meetings. The Committee is grateful to Shri. R. Gurumurthy, Chief General Manager (CGM), Internal Debt Management Department (IDMD) for his guidance and support. The Committee also thanks Shri. T.K. Rajan, former CGM of IDMD for giving his insights. The Committee appreciates the contributions made by Shri. Neeraj Kumar, Assistant Adviser, Smt. Sangita E, Assistant General Manager, Shri. Sourit Das, Research Officer, Shri. Prashant Chandawat, Assistant Manager and Shri. Avinash Deo, Assistant Manager of IDMD. The Committee recognises the suggestions received from Smt. Latha Vishwanath and Dr.Sudarsana Sahoo, General Managers of IDMD. The Committee is also thankful to all other Officers and Staff of IDMD for their assistance during various stages of preparation of this report. The Committee acknowledges the support received from Officers of Central Accounts Section and Public Debt Office, RBI. The Committee is also thankful to Shri. Deba Prasad Rath, Officer-in-Charge, Department of Economic Policy and Research (DEPR), Shri. Rajiv Ranjan, Adviser-in-Charge, Monetary Policy Department (MPD), Shri. Indranil Bhattacharya, Director, MPD, Smt. Sangita Misra, Director, DEPR, Shri. S. Suraj, Assistant Adviser, Shri Bichitrananda Seth, Assistant Adviser and Shri Rahul Agarwal, Manager for giving their inputs. The Committee immensely benefitted from the overall guidance of Shri B.P. Kanungo, Deputy Governor and Shri. R. Subramanian, Executive Director of the Reserve Bank of India.
EXECUTIVE SUMMARY Ways and Means Advances (WMA) Scheme of States is periodically reviewed after assessing the evolving economic and fiscal situation as well as the implications for monetary policy objectives. The 31st Conference of State Finance Secretaries held on March 18, 2019 had decided to set up a Committee to review the WMA scheme. Accordingly, the Reserve Bank had set up the Advisory Committee on WMA to State Governments in August 2019. The Committee comprised of nine members including the Chairman, Finance Secretaries of five State Governments representing each zone of Indian States, one member from PF-S, Ministry of Finance (MoF), Government of India (GoI), and an academic expert from National Institute of Public Finance and Policy (NIPFP). Secretarial assistance and research support was provided to the Committee by Internal Debt Management Department of Reserve Bank of India. The Committee adopted a consultative approach and finalised its recommendations, based on discussions held with member as also non-member States and fiscal/ monetary policy experts. Revision of WMA limits and review of Consolidated Sinking Fund (CSF) / Guarantee Redemption Fund (GRF) were also deliberated upon during the meetings of Executive Committee to State Finance Secretaries. The Committee had resorted to technology-based alternatives for holding virtual discussions, as physical meetings were rendered impossible due to the Covid-19 pandemic. Recommendations 1. The States have been able to manage the fiscal stress caused by COVID-19, primarily through a mix of expenditure compression and additional open market borrowings and financial accommodation provided by the Reserve Bank through Special Drawing Facility (SDF), WMA and Overdraft (OD). The Committee calculated WMA limits based on the total expenditure of State Governments. The rationale for adopting expenditure-based methodology was to revise the limit according to the fiscal size of States. The formula-based revised limit, thus arrived, works out to ₹47,010 crore. As the effect of pandemic is still prevalent, and the formula-based revised WMA limit arrived at by the Committee is lower than the interim limit, the Committee is of the view that the interim WMA limit of ₹51,560 crore may continue for 6 months i.e., up to September 30, 2021. Thereafter, depending on the course of the pandemic and its impact on the economy, Reserve Bank may review the limit, either based on the methodology suggested by the Committee or as may be necessary, after assessing the then requirement of States. 2.The Committee also recommends that the prevailing interest rate on SDF/ WMA/ OD may be retained. 3.The Committee proposes that the OD Regulations1 may continue and the interim relaxations2 on OD may cease to exist by March 31, 2021. 4. The Committee recommends that the operating limit of SDF should continue to be calculated against the collateral of investments in G-sec/ ATBs and the annual incremental investments in CSF and GRF, without any upper limit, and the usual haircut margin of 5 per cent shall be applied. 5. The Committee recommends that the limitation3 on availing SDF against investment in 91-day Treasury Bills (T-bills) may be removed and States be allowed to invest in 91-day T-bills without the restriction of 90 days, provided the SDF/ WMA availed prior to such investment is fully repaid. Likewise, prevailing condition of permitting States to invest their cash surplus in Auction Treasury Bills (ATBs)4 only when they have not availed WMA in the immediately preceding period of 90 consecutive days, may also be removed. However, States may take care to not avail SDF after investing their cash balances in 91-day T-bills. If such instances prevail, the Reserve Bank may take measures as deemed necessary to curtail such activities. 6.The Committee underscores that CSF and GRF are reserve funds, constituted voluntarily by States for a specific purpose, and need to be built up substantially. Hence, the Committee urges the remaining States to join CSF/ GRF schemes, which would facilitate them to withdraw from the Fund to repay liabilities in times of need, and also to avail SDF for managing temporary cash flow mismatches. 7.The Committee recommends that a minimum corpus be built by States in CSF and GRF, within the next 5 years, and be maintained on a rolling basis thereafter. States may build a minimum corpus of at least 5 per cent of the total liabilities/ guarantees outstanding at the end of previous Financial Year (FY). 8. Regarding lock-in period for withdrawal from CSF, the Committee recommends that withdrawal be allowed after a lock-in period of 2 years from constituting the Fund, in place of the prevailing lock-in period of 5 years. 9.The prevailing condition in CSF scheme which limits the quantum of withdrawal from CSF to the amount of redemption due for that year towards market borrowing, may be removed. States may be allowed to use the total quantum of interest accrued and accumulated in the Fund (up to the end of previous financial year) for repayment of outstanding liabilities5. 10.On building the minimum corpus as stated above, States may be allowed to withdraw from CSF6, any sum in excess of the minimum corpus of 5 per cent. This will enable States to use the funds invested in excess of the minimum requirement, for repayment of outstanding liabilities. 11.In case of CSF, States will continue to have the existing option of withdrawing from the interest accrued and accumulated in the Fund, and can exercise either one of the withdrawal option, at a single instance. 12.The prevailing provision in CSF/ GRF schemes which necessitate consultation with State Governments for selection of securities in case of premature disinvestment from CSF/ GRF, may be removed, in view of operational convenience. Reserve Bank may be allowed to decide on the securities to be liquidated, provided the securities chosen for disinvestment are in profit at the time of sale. 13. The States may, accordingly, amend their CSF and GRF Schemes and notify the same in their Official Gazette, to avail the benefit of above-mentioned relaxations in the CSF and GRF Schemes. 14. The Committee recommends that the minimum balance fixed for States may not be revised at present and the system of having differential minimum balance for each State/ UT can continue as it has been working fine so far (Annex 2). The Committee believes that raising the minimum cash balance does not serve any purpose and runs contrary to the objective, considering WMA limit is being revised upwards periodically in line with cash flows/ budgetary transactions of States. Next Review of the WMA Scheme As recommended, the interim WMA limit of ₹51,560 crore may continue for 6 months i.e., up to September 30, 2021 and revision in the WMA limit thereafter may be decided by the Reserve Bank after assessing the requirement of States. Next Committee-based revision of the WMA Scheme may be carried out after the release of 16th Finance Commission (FC) report so that the fiscal road map proposed by the FC, and the then requirement of States, may be taken in to consideration.
I. INTRODUCTION 1.1 The Reserve Bank of India (RBI) acts as the debt manager and banker for 27 State Governments and the Union Territories of Puducherry and Jammu and Kashmir (J&K), while being a debt manager for the Government of Sikkim7, in terms of the States’ agreement with RBI under Section 21 A of the Reserve Bank of India Act, 1934. As per this Section, the Reserve Bank may, by agreement with the Government of any State, shall undertake all money, remittance, exchange and banking transactions in India, including in particular, the deposit, free of interest, of all its cash balances with the Bank; and the management of public debt of, and the issue of any new loans by that State. 1.2 In terms of Section 17 (5) of the RBI Act, the Reserve Bank makes advances to State Governments to tide over temporary mismatches in the cash flows of their receipts and payments. Such advances are termed as Ways and Means Advances (WMA) and are defined by the Act as ‘advances repayable in each case not later than three months from the date of the making of the advance’. The Reserve Bank has been extending WMA to State Governments since 1937. The maximum amount of WMA granted by the Reserve Bank and the interest charged thereon are regulated by agreements with the State Governments as also based on the recommendations of various Committees/ Groups constituted. 1.3 In January 2016, the WMA limits of State Governments was revised by the Advisory Committee headed by Shri Sumit Bose. The Committee had suggested that the next revision of WMA scheme may be effected in 2020-21 taking into account the then fiscal position of the States and the road map likely to be deliberated in the 15th FC report. Accordingly, an Advisory Committee was constituted in August 2019 under the Chairmanship of Shri Sudhir Shrivastava. 1.4 Initial composition8 of the Committee was as under: 1)Shri Sudhir Shrivastava, Former Additional Chief Secretary, Maharashtra - Chairman 2)Shri Sanjiv Mittal, Additional Chief Secretary (Finance), Uttar Pradesh - Member 3) Shri Arvind Agarwal, Additional Chief Secretary (Finance), Gujarat - Member 4)Shri Rajiv Bora, Additional Chief Secretary (Finance), Assam - Member 5)Shri K Ramakrishna Rao, Principal Secretary (Finance), Telangana - Member 6)Shri A K K Meena, Principal Secretary (Finance), Odisha - Member 7)Shri Suraj Kumar Pradhan, Joint Director, PF-S, MoF, GoI - Member 8)Shri N R Bhanumurthy, Professor, National Institute of Public Finance and Policy (NIPFP)9 -Member 9) Shri Brijesh P, Director, IDMD, RBI – Convenor & Member Secretary Terms of Reference 1.5 The Terms of reference (ToR) given to the Committee broadly cover the following: a)To review the existing WMA scheme for State Governments, particularly the formula for fixation of limits, and recommend modifications, if necessary, in light of the recommendations of the Fifteenth Finance Commission (15th FC); b)To examine the existing Overdraft (OD) regulations for the State Governments; c)To examine the scheme of Special Drawing Facility (SDF) of the State Governments; and its linkage with the CSF/GRF scheme. d) Any other issues germane to the subject. Structure of the Report 1.6 Against the framework given in the ToR, the Report is structured into thirteen Sections. Evolution of the WMA scheme, and a brief on various Advisory Committees constituted for reviewing the scheme over the years, is covered in Section II. Trend in State finances and implications of the recommendations by 15th FC is elaborated in Section III. Impact of the revised WMA limits on money supply is examined in Section IV. WMA and Cash balance management by State Governments are explored in Section V. In this context, Section VI discusses the fiscal marksmanship of Indian States. Trends in utilisation of SDF/ WMA/ OD is analysed in Section VII. Methodology used for revising the WMA limit of State Governments is elaborated in Section VIII. Section IX examines the existing Overdraft (OD) regulations of State Governments while Section X discusses the scheme of SDF and its linkage with the CSF/GRF schemes. The existing features of CSF and GRF schemes are reviewed in Section XI with a view to encourage the States to augment their corpus in CSF and GRF. Minimum cash balance to be maintained by the State Governments is reviewed in Section XII. Recommendations of the Committee have been summarised in Section XIII. II. EVOLUTION OF WAYS AND MEANS ADVANCES SCHEME 2.1 As indicated earlier, the Reserve Bank provides financial accommodation to States banking with it through agreement, in the form of WMA, to help the States tide over temporary mismatches in the cash flow of their receipts and payments. Such financial assistance is intended to aid the States in carrying out their essential activities and normal financial operations. WMA provided by Reserve Bank to the States is governed by Section 17(5) of the Reserve Bank of India (RBI) Act, 1934. There are two types of WMA, viz., (i) Normal WMA or clean advance, which was introduced in 1937; and (ii) Special WMA instituted in 1953, which is a secured advance provided against the collateral of GoI securities. As requested by State Governments in the SFS conference held in May 2013, the nomenclature of Special WMA was changed to Special Drawing Facility (SDF) since June 23, 2014, by amending the agreement with respective State Governments. In addition to WMA, OD facility is also provided whenever financial accommodation to a State exceeds its SDF and WMA limits. Maximum amount of such advances by Reserve Bank and the interest charged thereon are, however, not specified in the RBI Act but are regulated by voluntary agreements with the State Governments as also based on the economic environment and recommendations of various Committees. 2.2 As a banker to State Governments, the Reserve Bank is not entitled to any remuneration for conduct of ordinary banking business, other than the advantages which may accrue to it from holding of States’ cash balances, free of obligation to pay interest thereon. State Governments are required to maintain minimum balances not below the amount as may be agreed upon between the Government and the Bank from time to time. 2.3 The WMA Scheme has been periodically reviewed, keeping in view the States’ requirements, the evolving fiscal, financial and institutional developments, as well as the objectives of monetary and fiscal management. When WMA was introduced in 1937, the limit was kept equal to the minimum balance of respective State Government. Thereafter, WMA limit of States was revised periodically10 and fixed as a multiple of their respective minimum balance. A major change in principle adopted for working out WMA limits occurred in 1999, consequent to the recommendations made by an Informal Advisory Committee (IAC). Since 1999, the limits are being fixed based on the recommendations of Advisory Committees set up periodically by the Reserve Bank (Annex 1). 2.4 Advances granted to the State Governments by way of SDF, WMA and OD attract interest on the outstanding. Interest rates on such advances are fixed by the Reserve Bank and have witnessed periodic revisions. Prior to May 1976, the interest rate on WMA did not exceed the Bank Rate. From May 1976 to August 1996, a graduated scale of charges based on the duration of the advance was introduced to discourage the States from using the facility as a normal budgetary resource. Since then, a single rate of interest is being applied on WMA. At present, the Interest rate charged on WMA, SDF and OD is linked to the Repo Rate as indicated in Table 1 below: | Table 1: Interest Rates on SDF, WMA and OD | | Scheme | Limit | Rate of Interest | | SDF | If availed against net annual incremental investment in CSF and GRF | Repo rate minus
2 per cent | | If availed against investment in G-sec/ ATBs | Repo rate minus
1 per cent | | WMA | If outstanding up to 3 months from the date of making the advance | Repo rate | | If outstanding beyond three months from the date of making the advance | Repo rate plus
1 per cent | | OD | If availed up to 100 per cent of WMA limit | Repo rate plus 2 per cent | | If exceeds 100 per cent of WMA limit | Repo rate plus 5 per cent | | Historical trend on interest rates of SDF/ WMA/ OD is summarised in Annex 3. | Advisory Committees Constituted by RBI 2.5 The WMA scheme was reviewed in the past by five advisory committees, including an informal Group of State Finance Secretaries (GSFS) set up by the Reserve Bank. Each Committee was headed by a renowned civil servant/ expert with experience in State finances (Table 2). Advisory Committee Constituted in 2015
(Chairman: Shri Sumit Bose) 2.6 The WMA limits of State Governments/ UT of Puducherry were last revised in January 2016 as recommended by the Advisory Committee set up in 2015 under the chairmanship of Shri Sumit Bose. The Committee had used a formula based on total expenditure of States, which reflected distribution of limit to all States as per their fiscal size. It was felt that the increase in quantum of WMA should be in tandem with the growth in total expenditure. Consequently, the Committee had recommended that WMA limit will be set on the basis of total expenditure adjusted for lottery expenditure. The WMA quantum, thus revised, worked out to ₹32,225 crore for all the States/ UT (effective since February 2016 onwards). 2.7 The Committee had suggested that the limits may continue up to December 2017 after which a review may be undertaken to decide the quantum for 2018-20. Accordingly, the limits were reviewed in March 2018 and it was decided to retain the existing limits. The Committee had further recommended that the next revision of WMA Scheme may be effected in 2020-21 taking into account the then fiscal positions of the States and the road map likely to be deliberated in the 15th FC report. | Table 2: Advisory Committees Constituted by RBI | | S. No. | Year | Chairman | | 1 | 1998 | B.P.R. Vithal | | 2 | 2000 | Informal Group of State Finance Secretaries | | 3 | 2003 | C. Ramachandran | | 4 | 2005 | M. P. Bezbaruah | | 5 | 2015 | Sumit Bose | Advisory Committee Constituted in 2019
(Chairman: Shri Sudhir Shrivastava) 2.8 As suggested by the Sumit Bose Committee, and as decided in the 31st conference of SFS (held on March 18, 2019), a new Committee was constituted in August 2019, with members comprising of Finance Secretaries representing select States, representative from Department of Expenditure, GoI and an academic expert, under the chairmanship of Shri Sudhir Shrivastava, former Additional Chief Secretary, Maharashtra. 2.9 First meeting of the Committee was held on October 14, 2019. Various methodologies that can be used for arriving at the revised WMA limit of State Governments was deliberated during the meeting and it was decided that expenditure-based methodology may be adopted for devising the formula for revision of limits. 2.10 The Committee was required to consider the recommendations of 15th FC, before finalisation of its report. However, due to COVID-19 pandemic, the 15th FC had come out with an interim report for the Year 2020-21 and had indicated that the report would be finalised after the figures on key macro variables were made available to the FC. Pending submission of the Committee Report, the Reserve Bank had taken interim measures to relax WMA/ OD in response to the fiscal stress caused by the COVID-19 pandemic. On April 1, 2020, the WMA limit for all States / UTs was increased by 30 per cent to ₹41,900 crore, over the existing level of ₹32,225 crore. Subsequently, on April 17, 2020, the WMA limit was increased to ₹51,560 crore for all States/ UTs, which was 60 per cent over the limit prevalent on March 31, 2020 (₹32,225 crore). These measures were initially kept valid till September 30, 2020 but were eventually extended up to March 31, 2021. 2.11 Further, to provide greater flexibility to State Governments to tide over their cash flow mismatches, the Reserve Bank relaxed the OD regulation of States, effective from April 7, 2020 to Sep 30, 2020, wherein a State/ UT can be in OD continuously for 21 working days as against the existing 14 working days, and can remain in OD for a maximum of 50 working days in a quarter as against the existing 36 working days. These relaxations were eventually extended up to March 31, 2021. 2.12 Second meeting of the Committee was held on July 10, 2020 through video conference, in view of the nation-wide lock down imposed for containing the spread of COVID-19 pandemic. Member States had welcomed the interim measures taken by the Reserve Bank and stated that States have been able to manage the fiscal stress caused by COVID-19 through additional market borrowings and financial accommodation provided by the Reserve Bank. As the pandemic was still not contained, the Committee suggested that the interim WMA limit (i.e., ₹51,560 crore) may continue for a while and any further revision in the interim limit can be decided by the Reserve Bank after assessing the evolving situation. It was decided that the Committee recommendations may be concluded after the final report of 15th FC is released, so that the fiscal roadmap recommended by the FC for States can be taken into consideration while setting the new WMA limits. 2.13 Third meeting of the Committee was held on February 26, 2021. The draft report prepared based on the deliberations of the Committee and suggestions received from States, was taken up for discussion. The Committee agreed to retain the current interim limit of ₹51,560 crore for six months in the ensuing financial year (FY 2021-22) i.e., up to September 30, 2021, as the formula-based WMA limit arrived at by the Committee (₹47,010 crore) was lower than the interim limit. The Committee proposed that the Reserve Bank may review the WMA limits thereafter, after assessing the course of the pandemic, then macroeconomic situation and the requirement of States. The Committee also reviewed the suggestions received from States on the items included in the ToR viz. SDF/ WMA/ OD and CSF/ GRF schemes. It was also decided that the importance of accurate and timely reporting of data on contingent liabilities, including that of guarantees issued by States, needs to be underscored in the Report. Revision of WMA limit was also placed for discussion among States during the 13th Meeting of the Executive Committee (EC) to State Finance Secretaries, held on June 19, 2020. III. IMPLICATIONS OF THE RECOMMENDATIONS BY 15th FINANCE COMMISSION ON STATE FINANCES 3.1 Large transfers to State Governments recommended by Finance Commissions (FC), particularly the 14th FC that increased the share of tax devolution from 32 to 42 per cent of the divisible pool, were essentially meant to address some of the vertical imbalances, while giving greater leeway to States in deciding on the usage of untied transfers. Mirroring this, States’ receipt pattern exhibits an increasing share of revenue receipts coming from Central transfers, while States’ own tax revenues, as a proportion of the States’ GDP, have broadly stagnated, resulting in a reduction in the gap between States’ own revenue and Central transfers that constituted around 7 per cent and 4 per cent of GDP, respectively, during 2000-05. Both have started converging since 2014, initially through higher transfers and more recently through higher grants (Chart 1a). Thus, central transfers have played an important role in bridging the resource gap arising on account of growing State expenditure (Reddy, 2018). Committed expenditure of States, however, has been on a rise, accounting for one third of total expenditure (Chart 1b). States have managed to meet FRL- prescribed fiscal deficit targets by cutting down their capital outlay plans, by almost 0.5 per cent of GDP vis-à-vis budgeted, on an average, lending States’ fiscal policy a pro-cyclical bias (Charts 1c and 1d). A similar tendency relative to BE can be expected in 2020-21, particularly since States have not been able to undertake much capex in this fiscal so far, because of lockdown, monsoons and social distancing norms. 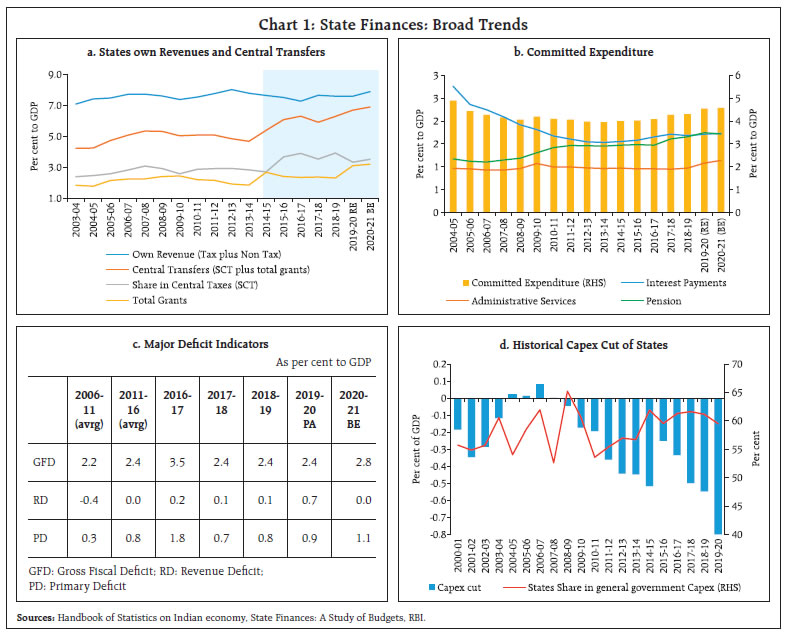 Recommendations of the 15th FC Vertical Devolution 3.2 Report of the 15th FC, which covers five financial years from 2021-22 to 2025-26, was released on February 1, 2021. It has placed the vertical tax devolution from the Centre to the States for the years 2021-26 at 41 per cent of the divisible pool, slightly reducing the share mandated by the 14th FC (42 per cent), but retaining the share recommended in its Interim Report given for the year 2020-21. Marginal reduction in share of States is primarily because of elimination of the share which used to be allocated to the erstwhile state of Jammu and Kashmir (0.8 per cent of the divisible pool in 2018-19) (Table 3a). 3.3 The FC is also entrusted with determination of criteria and formula for inter se distribution of taxes amongst States, with the objective of aiding minimum government services to all citizens while addressing varying revenue raising capacities of States owing to the disparity in their income level. The 15th FC has done away with the 1971 population census, as governed by its ToR and has graduated to using 2011 census as a criterion for the inter se distribution of taxes among States. To reward States that have successfully brought down population growth between 1971 and 2011, which may otherwise get penalised because of this shift, a new criterion of demographic performance has been introduced – product of the inverse of total fertility rate as per 2011 population census, and a State’s population in 1971 (Table 3b). The other major change is re-introduction of the criterion for tax effort that was used by 10th, 11th and 12th FCs but was done away by the 13th and 14th FCs. This has been done to incentivise States’ tax collection efforts and address concerns regarding fiscal consolidation. The weightage for forest and ecology has been increased while that of income distance has been reduced, though it continues to be the predominant criterion for tax devolution. Grants-in-aid 3.4 Other than tax devolution, the FC also recommends specific transfers to States in the form of grants under Article 280 of the Constitution. Purpose of these grants has varied considerably over successive FCs, though the share of devolution to local bodies has increased considerably since the passage of 73rd and 74th amendments to the Constitution in 1992 that mandated federal transfers to local bodies. While devolution to local bodies commands the major share in 15th FC grants, the Commission has also recommended a significant increase in grants for bridging revenue deficit and disaster management. 15th FC has also made recommendations on two new grants - Sector-specific grants and State-specific grants. Sector-specific grants are performance based (except for health sector grants) and are recommended for three areas: (1) Social sector - health, education; (2) Rural economy - agriculture reforms, rural roads, and (3) Governance - judiciary, statistics and aspirational districts and blocks (Table 4). | Table 3: Devolution Criteria | | a. Vertical Devolution Criteria (per cent) | | Finance Commission | Tax Devolution Pattern
(per cent of divisible pool) | States’ Share/ Gross Tax revenue | | FC-Xl (2000-2005) | 29.5 | 26.6 | | FC-XII (2005-2010) | 30.5 | 25.9 | | FC-XIII (2010-2015) | 32 | 27.9 | | FC-XIV (2015-2020) | 42 | 34.4 | | FC-XV (I) (2020-2021) | 41 | 32.4 | | FC-XV (F) (2021-2026) | 41 | | | b. Horizontal Sharing Criteria (per cent) | | Criteria | FC-XIV | FC-XV | | Population - 1971 | 17.5 | | | Population - 2011 | 10 | 15 | | Area | 15 | 15 | | Forest and Ecology | 7.5 | 10 | | Income Distance | 50 | 45 | | Demographic Performance | | 12.5 | | Tax and fiscal efforts | | 2.5 | | Total | 100 | 100 |
| Table 4: Grants-in-aid | | (Amount in ₹ crore) | | S. No. | Components | Annual | Full award period | | 2021-22 | 2022-23 | 2023-24 | 2024-25 | 2025-26 | 2021-26 | % Share in total grants-in-aid | | 1 | Revenue Deficit grants | 1,18,452 | 86,201 | 51,673 | 24,483 | 13,705 | 2,94,514 | 28.5 | | 2 | Local governments grants | 80,297 | 84,703 | 87,181 | 92,087 | 92,093 | 4,36,361 | 42.2 | | 3 | Disaster management grants | 22,184 | 23,294 | 24,466 | 25,688 | 26,969 | 1,22,601 | 11.9 | | 4 | Sector-specific grants | 12,346 | 23,729 | 24,773 | 33,062 | 36,077 | 1,29,987 | 12.6 | | 5 | State-specific grants | - | 9,919 | 9,919 | 14,883 | 14,878 | 49,599 | 4.8 | | Total | 2,33,279 | 2,27,846 | 1,98,012 | 1,90,203 | 1,83,722 | 10,33,062 | 100.0 | | Source: Finance Commission Report | Implications on State Finances 3.5 On the issue of tax devolution, recommendations of 15th FC may not significantly alter the resource transfer from Centre. Maintaining the devolution share at 41 per cent of divisible pool adds predictability and stability to the transfer of resources. Notwithstanding this, the significant decrease in tax devolution since 2019-20, that continued in 2020-21, is primarily driven by shrinking tax divisible pool owing to contraction in economic activities as well as increasing share of cesses and surcharges that are kept outside the divisible pool. 15th FC has tried to compensate this by increasing grants, particularly revenue deficit grants, since 2020-21. The increasing share of grants in overall pool of transfers, which are assigned in terms of a fixed amount rather than a percentage of divisible pool, adds predictability to the quantum and timing of fund flow, thus reducing the revenue uncertainty. A detailed note on this subject is given in Annex-11. IV. INCREASE IN WMA LIMIT – IMPACT ON MONETARY POLICY 4.1 As indicated earlier, the Reserve Bank, by agreement, acts as a banker and debt manager to State Governments and, in its role as a banker, provides temporary advances to State Governments in the form of SDF/ WMA/ OD to help them tide over temporary cash flow mismatches. Once WMA limits are decided, these advances act as a standing facility for States. Consequently, funds availed under the scheme become an autonomous driver of liquidity. 4.2 In practice, given their temporary nature, WMA to State Governments is not a major driver of systemic liquidity, although it can pose challenges for short-term liquidity forecasting and liquidity management of the Reserve Bank. Moreover, States have different temporal patterns of liquidity gaps and all States typically do not avail the facility simultaneously. On an incremental basis, during 2019-20, increase in the net Reserve Bank credit to State Governments accounted for only 0.4 per cent of accretion to reserve money, as compared to a negative contribution of 0.1 per cent in 2018-19. Reserve Bank credit to State Governments accounted for (-)0.2 per cent of incremental reserve money during 2020-21 (up to March 26, 2021). If, however, all States are simultaneously in WMA, and WMA limits are required to be increased because of an unanticipated protracted shock like Covid-19, it can have significant implications for liquidity management. 4.3 In view of the above, the WMA limit needs to be revised taking into account the need for discipline in cash management, fiscal prudence and implications for monetary and liquidity management. V. WMA MANAGEMENT – CONTEXT AND ISSUES 5.1 The factors driving State Governments’ revenue receipts are quite different from those that drive expenditure, and operate largely autonomous of each other. It is, therefore, natural that timing mismatch exist between receipt of revenues and outgo of expenses. Payment of salaries, pensions and repayment/ servicing of GoI loans generally happens during the first week of the month, resulting in substantial withdrawal of cash balances. The Goods and Services Tax (GST) revenue, which is one of the most important source of States’ revenue, usually accrues in the third or fourth week of the month, leading to a build-up of cash balances (Chart 2). The State Governments, hence, either need cash buffers or access to short-term borrowings, or both, while also having avenues to park their temporary surplus. Reserve Bank, as a banker to State Governments, has devised the scheme of WMA precisely for this purpose. 5.2 One of the major item of receipts in States’ budget is transfers from Government of India (GoI). States generally point out that uncertainties in transfers from GoI, including transfers relating to the GST, put significant pressure on States’ finances which constrains them to maintain higher level of cash balance as a precautionary measure. Surplus cash balance of State Governments is automatically invested in Intermediate Treasury Bills (ITBs) of the GoI (Annex 4). Revenue loss to the States in this regard is evident from the difference in the interest rate on ITBs (return) and market rate on borrowings by States (cost). Many States have expressed concern on this negative carry. On the other hand, investment by States in ITBs are very volatile and unpredictable, thereby imparting volatility to the cash balance of the GoI that in turn affect the liquidity management of the Reserve Bank. While it is necessary for the States to keep adequate cash balances to cover uncertainties, maintaining excess cash balance than what is necessary, in the form of investment in ITBs/ ATBs should be avoided (Annex 5 and 6). States should have an idea of the optimal level of cash balance required by them and preferably utilise their excess cash balance before resorting to borrowings from the market at auction-determined rate. To achieve the same, cash-flow statement may be prepared and updated by States on a regular basis to plan and forecast their immediate cash requirement. Going forward, incentivising States with better cash management practices viz. adoption of information technology and online information system, may be deliberated. 
Box 1: Cash Management Practice and WMA Williams (2010), briefly explains what constitutes good practice in government cash management. It is indicated that, centralisation of government cash balances and establishment of a Treasury Single Account (TSA)11 and modern systems, including reliance on electronic transactions, modern banking, payment and settlement systems, are essential pre-requisites for good cash management. Further, ability to make accurate projection of short-term cash inflows and outflows; information sharing between cash managers, revenue-collecting agencies and spending ministries; strong coordination of debt and cash management etc., are also required (Pessoa and Williams, 2012). Any unexpected economic development may lead to deviation from expected revenue/ expenditure. In this context, in India, WMA is a facility to meet temporary mismatch between receipts and expenditure and is expected to help the States to meet the revenue gap. WMA is to be seen in the larger context of budget, expenditure, debt and liquidity management. Utilisation of WMA to a great extent also depends on the efficacy in cash management of States and fiscal marksmanship (accuracy in estimating receipts and expenditure). If a State is within its WMA limit and is availing WMA only to meet temporary mismatches, then it can be said that utilisation of WMA is optimum. On the other hand, if a State is continuously in WMA, even slipping in to OD on a frequent basis, then this needs to be seen as part of a larger problem of unbalanced budget and issues in accurate projection of cash flows need to be adequately addressed. In short, WMA management is like inventory management. There is a cost to holding cash (especially if it is excess) while, on the other hand, there is a risk of running out of cash with attendant consequences. References: 1.Williams, Mike (2010), “Government Cash Management Its Interaction with Other Financial Policies”, Fiscal Affairs Department, IMF Technical Notes and Manuals, July. 2. Pessoa, Mario and Mike Williams (2012), “Government Cash Management: Relationship between the Treasury and the Central Bank”, Fiscal Affairs Department, IMF Technical Notes and Manuals, November. | 5.3 There is a substantial body of literature which deals with the subject of cash management by Governments. The main objectives of good cash management are to ensure availability of adequate cash to meet expenditure, to borrow only when needed, to minimise borrowing costs and to maximise returns on idle cash, while managing the risks associated with the investment (Box 1). 5.4 The issue of ways and means management, thus has to be seen in the larger context of budget, expenditure, debt and liquidity management. It is clear that a balanced budget is a sine qua non to ensure that a State Government does not continually rely on WMA and eventually slip into OD. The budgets, as presented, are obviously balanced. However, quite often, the budgets are not comprehensive enough to accommodate all the expenditure, as there could be unforeseen expenditure too. The revenue estimates could be overly optimistic, when there could be unforeseen shortfalls in the actual revenue. All of this reflects on the fiscal marksmanship of a State and eventually will have a bearing on their WMA management. In this regard, next section attempts to provide a brief overview of fiscal marksmanship in Indian States. VI. FISCAL MARKSMANSHIP OF STATES Background 6.1 In the parlance of fiscal policy, fiscal marksmanship refers to the precision or accuracy of a Government’s forecasts or estimates of fiscal indicators in a budgetary exercise. Government budgets typically consist of three set of numbers – Budget Estimates (BE) for the next year, Revised Estimates (RE) of the current year lapsed and Actuals of the previous year. Good fiscal marksmanship entails high forecast accuracy of Government estimates, typically measured through deviation of Actuals from BE and RE. While it is natural for budgetary forecasts to deviate from actual values, the nature of deviation (or errors) needs to be looked through, to determine the credibility of budgetary forecasts. Fiscal marksmanship of Indian States: A Brief 6.2 A few recent studies have examined the forecast accuracy of State Government budgets in India. State Finances: A Study of Budgets 2014-15 (RBI, 2015) carried out an analysis of State Governments’ forecasting performance for the period from 2001-02 to 2012-13. The analysis found that both BE and RE overestimate the revenue receipts and revenue expenditure, while the extent of overestimation was more for the latter. Chakraborty, Chakraborty and Shrestha (2020) had analysed the fiscal forecasting errors of 28 Indian states (excluding Telangana) for the period 2011-16. The study found overestimation in both revenue receipts and revenue expenditure, both in BE and RE, with the overestimation more for the former. The magnitude of overestimation was found to be significantly higher in grants from the Centre than States’ own revenue and share of central taxes. Srinivasan and Misra (2020) had analysed the fiscal marksmanship of State Government revenues and observed that while overestimation of State Government revenues has been increasing over time, errors in forecasting of central grants (State plan schemes and centrally sponsored schemes) dominate overestimation of revenue. 6.3 An analysis of the fiscal marksmanship of major fiscal indicators of State Governments for the period of 2004-05 to 2018-19 (the latest year for which actual values are available) was done with 29 States and 2 Union Territories with legislature (Delhi and Puducherry). The deviation in Actuals from both BE and RE for receipts, expenditure and deficits was considered. Receipts budget 6.4 Revenue receipts for all States taken together have been consistently overestimated12 in BE since 2011-12 and in RE since 2004-05. Further, the extent of overestimation has increased significantly since 2012-13 (Chart 3a). On capital account, the deviations are much larger, and the errors have fluctuated between overestimation and underestimation over the years (Chart 3b). Expenditure budget 6.5 Revenue expenditure for all States taken together have been consistently overestimated in BE and RE since 2004-05, though the extent of overestimation has risen sharply since 2011-12. Further, RE have consistently performed poorer in forecasting revenue expenditure than BE (Chart 4a). Overestimation on capital account has also increased in recent years, except in 2015-16 and 2016-17 where UDAY related capital expenditure increased the actual capital expenditure to levels higher than the BE (Chart 4b). Deficits 6.6 Deficits are in effect derived indicators, and therefore, their deviation from forecasts is determined by the underlying deviation in receipts and expenditure. On a comparative basis, revenue deficits show much larger deviation from BE and RE compared to gross fiscal deficit. The proximate cause for this is possibly the limits imposed on States’ borrowing in Fiscal Responsibility Legislations (FRLs), which forces them to adjust their capital expenditure to meet the fiscal deficit targets. VII. TRENDS IN UTILISATION OF SDF/ WMA/ OD 7.1 Dependence of States on financial accommodation through WMA/ OD/ SDF has seen an increase over the years, especially in the context of Covid-19 pandemic (Table 5). Number of States availing financial accommodation has doubled/ more than doubled between 2010-11 and 2020-21 (till end-February 2021). Few States have been using WMA/ OD regularly while some States have done so occasionally. Regular use of WMA/ OD facility indicates a persisting imbalance in the receipts and expenditure of States and requires focused attention. Developments Post COVID-19 7.2 In response to the fiscal stress caused to States by the Covid-19 pandemic, the Reserve Bank had increased the prevailing WMA limits in the interim. Further, in order to facilitate State Governments to tide over their cashflow mismatches, the number of days permissible for OD was also relaxed, effective from April 7, 2020 to March 31, 2021. 7.3 Since April 2020, the number of States/ UTs availing WMA and the duration of utilisation of increased limits have shown a significant increase, along with an increase in the overall utilisation, due to the stressed economic situation. In the current FY 2020-21, out of the fifteen States/ UT that have availed WMA, 8 States/ UT have breached the limit and gone into OD so far. | Table 5: Utilisation of SDF, WMA and OD by States/ UTs (No. of States/ UTs) | | Year | SDF | WMA | OD | | 2010-11 | 8 | 6 | 4 | | 2011-12 | 8 | 9 | 6 | | 2012-13 | 10 | 9 | 8 | | 2013-14 | 13 | 13 | 8 | | 2014-15 | 13 | 12 | 10 | | 2015-16 | 12 | 12 | 9 | | 2016-17 | 12 | 14 | 6 | | 2017-18 | 11 | 13 | 7 | | 2018-19 | 9 | 14 | 10 | | 2019-20 | 16 | 13 | 9 | | 2020-21 (till end-February 2021) | 17 | 15 | 8 | | Source: RBI records. | Utilisation of SDF/ WMA and OD by States 7.4 Average utilisation of WMA by all States against the total WMA limit, stood at 4.14 per cent in 2016-17, but increased to 6.51 per cent in 2019-20 and further to 8 per cent for the current fiscal 2020-21 (till end-February 2021) (Table 6). Average utilisation of WMA and OD by States has increased nearly three times, from ₹1,843.39 crore in 2016-17 to ₹5,379.32 crore in 2020-21 (till end-Feb, 2021). In brief, utilisation of SDF/ WMA/ OD by States has increased significantly during 2020-21 (Annex 7). | Table 6: Utilisation of SDF, WMA and OD by States | | (Amount in ₹ crore) | | Year | SDF | WMA | OD | | Peak Utilisation | Average Utilisation | Peak Utilisation | Average Utilisation | Utilisation as percentage to total Limits | Peak Utilisation | Average Utilisation | | 2015-16 | 2665.81 | 981.57 | 2226.61 | 689.17 | 2.14 | 1068.09 | 230.01 | | 2016-17 | 2232.04 | 697.42 | 4045.97 | 1332.73 | 4.14 | 2113.08 | 510.66 | | 2017-18 | 3583.74 | 847.61 | 6305.6 | 1407.14 | 4.37 | 2508.61 | 639.24 | | 2018-19 | 3819.76 | 824.06 | 6806.0 | 2266.86 | 7.03 | 5717.1 | 725.56 | | 2019-20 | 7837.86 | 2223.96 | 6460.71 | 2097.12 | 6.51 | 5788.37 | 747.02 | | 2020-21 (till end-February) | 17241.71 | 4210.97 | 10793.56 | 4121.11 | 8.00 | 4059.07 | 1258.21 | | Source: RBI records. | VIII. WMA LIMITS - REVISION AND METHODOLOGY 8.1 The Committee deliberated on various formulas13 but decided to continue with the expenditure-based method for arriving at the revised WMA limit for State Governments. The Committee avoided wide variation in inter-state distribution of WMA limits to ensure that all States get benefitted. It is pertinent to note that the previous Advisory Committee had also adopted the total expenditure of States as the base for calculation of WMA limit, as it was a surrogate for cash flows and facilitated distribution of WMA limit in proportion to the fiscal size of States. Accordingly, this Committee has studied the growth in expenditure of States from 2016-17 to 2018-19 (using only accounts level data) to arrive at the revised WMA limit. 8.2 The Committee decided that the increase in total quantum of WMA limit should not be lower than the CAGR of 9.0 per cent recorded in the total expenditure (Capital and Revenue Expenditure, excluding ad hoc and volatile expenditure like lottery expenditure, natural calamities etc.), during the 3-year period of 2016-17 to 2018-19. Taking into consideration the special developmental needs of Himalayan States and North Eastern States (HS & NES)14, the quantum of WMA limit is distributed among the States in terms of a formula. The quantum of WMA is bifurcated between HS & NES and other States based on the average base15 arrived at for HS & NES and other States. Thereafter, State-wise WMA limit for HS & NES and other States is obtained by applying the ratio16 of 2 per cent and 1.75 per cent (after rounding off), respectively, to the average base. However, in order to avoid wide variation in the growth rate of WMA limit, the Committee limited the growth rate of WMA within a range, based on the average growth. Accordingly, the Committee fixed a lower bound of 19.30 per cent and upper bound of 60 per cent growth over the limits set by the previous Advisory Committee17. Thus, the total quantum of formula-based WMA limit of States/UTs stand at ₹47,010 crore (Annex 8), with an overall increase of 45.9 per cent over the limit of ₹32,225 crore recommended by the Sumit Bose Committee. The distribution ratio between HS & NES and other States works out to 11:89. A limit of this order is expected to be sufficient to cover the temporary mismatches that could arise from any unexpected shortfall in revenue flows. 8.3 Requirement of WMA is not only dependent on the extent of temporary mismatch between revenue and expenditure streams, but also on the initial cash buffer maintained by it. The limits so proposed above take care of a substantial portion of the mismatch that exists. Hence, to ensure that the States do not draw beyond the WMA limits available, it is necessary that they start the monthly receipts-expenditure cycle with a suitable positive cash balance. The Committee reiterates that WMA facility is meant to finance the temporary mismatch in cash flows and should not be seen as a facility to finance durable needs of States. Recommendations 8.4 State Governments have been able to manage the fiscal stress caused by COVID-19, primarily through market borrowings and financial accommodation provided by the Reserve Bank through Special Drawing Facility (SDF), WMA and Overdraft (OD). As the effect of pandemic is still prevalent, and the formula-based revised WMA limit is lower than the interim limit, the Committee is of the view that the interim WMA limit of ₹51,560 crore may continue for 6 months i.e., up to September 30, 2021 (Table 7). Thereafter, depending on the course of the pandemic and its economic and fiscal impact, Reserve Bank may revise the limit, either based on the formula suggested by the Committee or as may be necessary, after assessing the then requirement of States. Revised State-wise WMA limits arrived by this Committee is set out in Annex-8 of this report. | Table 7: Proposed WMA Limits | | (Amount in ₹ crore) | | S. No. | State | Existing Limit
(Shri Sumit Bose Committee) | Limit Recommended18 up to September 30, 2021 | S. No. | State | Existing Limit
(Shri Sumit Bose Committee) | Limit Recommended18 up to September 30, 2021 | | I. Other States (Non- HS & NES) | II. HS&NES | | 1 | Andhra Pradesh | 1510 | 2416 | 19 | Arunachal Pradesh | 195 | 312 | | 2 | Bihar | 1420 | 2272 | 20 | Assam | 940 | 1504 | | 3 | Chhattisgarh | 660 | 1056 | 21 | Himachal Pradesh | 550 | 880 | | 4 | Goa | 170 | 272 | 22 | Manipur | 195 | 312 | | 5 | Gujarat | 1915 | 3064 | 23 | Meghalaya | 175 | 280 | | 6 | Haryana | 915 | 1464 | 24 | Mizoram | 160 | 256 | | 7 | Jharkhand | 720 | 1152 | 25 | Nagaland | 205 | 328 | | 8 | Karnataka | 1985 | 3176 | 26 | Tripura | 255 | 408 | | 9 | Kerala | 1215 | 1944 | 27 | Uttarakhand | 505 | 808 | | 10 | Madhya Pradesh | 1600 | 2560 | Sub-total (II) | 3,180 | 5,088 | | 11 | Maharashtra | 3385 | 5416 | | 12 | Odisha | 985 | 1576 | 28 | Jammu and Kashmir | 880 | 1408 | | 13 | Punjab | 925 | 1480 | 29 | Puducherry | 130 | 208 | | 14 | Rajasthan | 1630 | 2608 | Total (All States/UTs) | 32,225 | 51,560 | | 15 | Tamil Nadu | 2475 | 3960 | | 16 | Telangana | 1080 | 1728 | | 17 | Uttar Pradesh | 3550 | 5680 | | 18 | West Bengal | 1895 | 3032 | | Sub-total (I) | 28,035 | 44,856 | IX. OVERDRAFT FACILITY (OD) 9.1 When advances to State Governments exceed their SDF and WMA limits, OD facility is being provided. Historical evolution of OD facility as summarised by the Sumit Bose Committee indicates that the limit on number of days was initially fixed at 7 consecutive working days but was subsequently increased based on representations from few State Governments. Accordingly, the Reserve Bank introduced some flexibility in the Scheme by enhancing the period for which a State Government could run on OD, from 7 to 10 consecutive working days, with effect from November 1, 1993. As per the recommendations made by IAC, in 1998, the Reserve Bank imposed a ceiling on the OD amount at 100 per cent of the WMA limit with the provision that OD over 100 per cent of the WMA limit had to be cleared within three working days. Subsequently in 2001, based on the recommendations of the informal GSFS constituted by the Reserve Bank, the limit of 10 consecutive working days was extended to 12 consecutive working days and the restriction for bringing down the OD level within the level of 100 per cent of the WMA limit was relaxed to five consecutive working days. The Committee observed that even with the enhancement in WMA, resort to OD has not declined and that frequent resort to OD was seen as a manifestation of structural imbalance or bad cash management. The Ramachandran Committee observed that greater resort to OD was a clear indication of fiscal imbalance and unless regulated in time, it would lead to a situation where the corrections would become costly and difficult. However, the total number of days that a State can remain in OD had been extended to 14 consecutive working days by the Ramachandran Committee. The Bezbaruah Committee decided not to modify the existing time limits for OD and continued with the norms that if the OD exceeds beyond 14 consecutive working days, the RBI and its agencies shall stop payments in respect of the concerned State Government; if the WMA limit is exceeded continuously for 5 consecutive working days for the first time in a financial year, the State will be advised by the Reserve Bank to bring down the OD level and if such irregularity persists on a second or subsequent occasion in the financial year, the Reserve Bank will stop payments, notwithstanding the provision of permitting OD up to 14 days. In a quarter, the OD availed should not exceed 36 days irrespective of 14 days & 5 days rules. The Sumit Bose Committee had also retained the above OD regulations. Interim Relaxation to Manage COVID-19 9.2 In order to provide greater flexibility to State Governments to tide over their cashflow mismatches caused by COVID-19, Reserve Bank, as an interim measure, had decided in April 2020 to a) increase the number of days for which a State/ UT can be in OD continuously to 21 working days, from the current stipulation of 14 working days. b) increase the number of days for which a State/ UT can be in OD in a quarter to 50 working days, from the current stipulation of 36 working days. The above relaxation is valid up to March 31, 2021. Recommendations 9.3 The Committee suggests that the above-mentioned interim relaxation may be discontinued w.e.f. April 1, 2021 and the existing OD Regulations as elaborated below may continue: (i) A State can be in OD for 14 consecutive working days. In case the OD continues in the State’s account beyond 14 consecutive working days, the Reserve Bank and its agencies shall stop payments in respect of the concerned State Government. (ii) If the OD exceeds 100 per cent of the WMA limit for five consecutive working days for the first time in a financial year, Reserve Bank will advise the State to bring down the OD level within the 100 per cent of WMA limit. If, however, such irregularity occurs on a second or subsequent occasion in the financial year, the Reserve Bank will stop payments notwithstanding clause (i) above, which permits the State OD up to 14 consecutive working days. (iii)No State Government will be allowed to be in OD for more than 36 working days in a quarter. If this is not adhered to, payments will be stopped, irrespective of clauses (i) and (ii)above. (iv)The rate of interest on OD will be as under: a)OD up to 100 per cent of WMA limit -two per cent above the Repo rate; b) OD exceeding 100 per cent of the WMA limit - five per cent above the Repo rate. X. SPECIAL DRAWING FACILITY 10.1 In addition to WMA, Special Drawing Facility19 (SDF) is being provided to State Governments since April 1, 1953 against the collateral of their investments in marketable securities issued by the Government of India. Initially, a uniform limit of ₹2 crore was fixed for each State Government. Between March 1967 to Feb 1999, the limits were linked to the minimum balance fixed for each State, and revised periodically. In 1999, the IAC on WMA to State Governments recommended that the limits should be delinked from minimum balances and that States be allowed to draw Special WMA freely against their holdings of GoI securities, subject to margin. 10.2 In 2005, the Bezbaruah Committee had recommended that the net incremental (i.e. new investment less redemption/ liquidation) annual investment of States in CSF/ GRF may also be made eligible for availing Special WMA, with the quantum restricted to their Normal WMA limit. The Committee felt that this would encourage the States to continually add to their CSF/GRF balances while they also build a reserve fund for meeting their redemption liabilities. The Sumit Bose Committee, in 2016, had liberalised this facility further, by allowing the States to avail SDF against net incremental annual investments in CSF/ GRF without any upper limit. At present, a uniform hair cut margin of 5 per cent is applied on the market value of the securities for determining the operating limit of SDF on a daily basis. 10.3 Historically, the rate of interest charged on SDF was initially linked to the Bank Rate and later to the Repo Rate. While SDF against holdings of GoI securities continues to be granted at Repo Rate minus one per cent, the rate of interest on SDF availed against the incremental investments in CSF/ GRF was brought down to Repo Rate minus two per cent, w.e.f. August 10, 2018, in order to encourage the States to build their corpus in CSF/ GRF. Liberalisation of SDF 10.4 Since its inception, SDF was being granted against the collateral of investments by State Governments in Central Government dated securities and Auction Treasury Bills, after applying suitable margin. 10.5 The Ramachandran Committee (2003) had noted that the reserves of Central Government securities built by States can be leveraged to raise collateralised funds from the Reserve Bank and therefore, to encourage the States, the Committee liberalised the scheme with some safeguards. While the margins applied earlier where ranging between ten to fifteen per cent, the Committee recommended application of a uniform haircut margin of five per cent on the market value of securities. The rate of interest was brought down from Bank Rate to Bank Rate minus one per cent and the States were allowed to utilise the Normal WMA only after having fully availed the Special WMA. Availing of SDF against Investments in CSF/ GRF 10.6 The Ramachandran Committee had suggested that the securities eligible for SDF should be kept unencumbered and should not include those which are covered under the CSF, the GRF or any other such special schemes, to prevent ‘double mortgage’ of CSF/ GRF balances. The Bezbaruah Committee decided to permit investments in the CSF and GRF as eligible collateral to avail SDF, in the context of expected improvement in the fiscal environment over the medium term. However, a ceiling equivalent to the Normal WMA limit was prescribed for each State. The Sumit Bose Committee revisited the request of States for liberalising the Scheme further and recommended that the entire incremental investments in CSF and GRF be made eligible for SDF without any limit, in line with dated securities and ATB investments. However, to avoid double mortgage issues, the Committee suggested that SDF eligibility be decided on a daily basis. At present, the operating limits of SDF are being calculated automatically by the System on a daily basis while the securities are revalued every quarter. 10.7 The Bezbaruah Committee, while permitting the States to avail Special WMA against net annual increments in CSF and GRF, observed that permitting States to invest temporary cash surpluses in dated GoI securities and allowing them to avail Special WMA thereafter, was not in accordance with sound financial principles. Hence, in order to discourage States from making investments in GoI securities unless they have ‘durable surplus’, the Committee had recommended that States may be permitted to invest their cash surplus in dated GoI securities, provided that they have not availed WMA in the immediate preceding period of 90 consecutive days. The minimum specified period of 90 days was kept consistent with the tenure of WMA to help obviate any possible incentive to utilise short-term accommodation from Reserve Bank for purposes of longer-term investment. Recommendations 10.8 The Committee observed that, since liberalising the operating limit of SDF in 2016, the utilisation of SDF had not increased substantially, with fewer States availing SDF, though the incremental investment in CSF/ GRF has been increasing. However, with the onset of COVID-19 pandemic in March 2020, utilisation of SDF by States went up significantly, indicating the usefulness of the facility in times of financial stress. 10.9 Some States requested that SDF should be granted against the entire principal corpus of CSF/ GRF. However, the Committee feels that, if States were to be allowed to avail SDF against the collateral of principal corpus, they may not be able to liquidate their investments in CSF/ GRF should the need arise. This would defeat the purpose of maintaining CSF and GRF as reserve funds. In view of this, the Committee recommends that the present system of deciding the operating limit of SDF based on the net annual incremental investments in CSF and GRF should continue, without any upper limit. 10.10 The Committee underscores that CSF and GRF are reserve funds constituted for a specific purpose and needs to be built up substantially. However, as the existing provision bars investment in dated GoI securities for 90 days if a State has availed SDF/ WMA, States may not be able to invest in CSF & GRF for such period, even after repaying their SDF/ WMA. Hence, in order to remove ambiguity, if any, the Committee clarifies that the restrictions20 on investment in government securities shall not apply to investments of State Governments in CSF and GRF. Availing SDF against Investments in ATBs 10.11 The Sumit Bose Committee had suggested that, since ATBs are also government securities, it would be advisable for States to invest in ATBs only when they have not availed SDF for the previous 90 days, similar to the restriction implemented for investments in dated GoI securities. To encourage prudent cash management practices of State Governments, the Sumit Bose Committee had recommended that, if a State avails SDF against investment in 91-day T-bills, in the first occasion, this arbitrage activity may be allowed for a limited period, but the State will not be allowed to invest further in 91-day T-bills for the next 90 days. However, if such practices of availing SDF and subsequent investment in 91-day T-bills continue in the second and subsequent occasions during the financial year, such SDF availed would be treated as WMA after the first occasion. The Committee had urged States to adhere to prudent cash management and avoid borrowing from Reserve Bank while their surplus is invested in ATBs. Recommendations 10.12 At present, State Governments invest in GoI dated securities only through their investments in CSF and GRF. They continue to invest their durable cash surplus in ATBs (91-day, 182-days and 364-days). However, the Committee observed that very few States that have been investing continuously in ATBs, have not availed SDF against these investments, except for rare occasions when States have gone into SDF due to unanticipated expenditure. Further, the prevailing condition is unfavorable for States as they have limited options for short-term investment of their surplus balance viz. investment in ATBs & 14-day ITBs. If investment in 91-day T-bills is barred for 90 days, surplus of States will automatically get invested in 14-day ITBs which yield a very low return of Reverse Repo minus 2 per cent (1.35% at present). In view of this, the Committee feels that the restrictions21 on availing SDF against investment in 91-day T-bills may be removed and States may be allowed to invest in 91-day T-bills without the restriction of 90 days, provided the SDF availed prior to such investment is fully repaid. However, as earlier Committees had noted, States may adhere to prudent cash management and avoid borrowing from the Reserve Bank while their surplus is invested in ATBs. If such instances prevail, the Reserve Bank may take action as deemed necessary to curtail such arbitrage activities. XI. CONSOLIDATED SINKING FUND & GUARANTEE REDEMPTION FUND Introduction 11.1 The Reserve Bank of India (RBI) manages two reserve funds on behalf of State Governments for meeting their contingent liabilities; the Consolidated Sinking Fund (CSF) and the Guarantee Redemption Fund (GRF). These funds are built from contributions made by the State Governments. CSF is an amortisation fund created to meet repayment obligations of the Government. The interest accrued and accumulated in the Fund is utilised towards redemption of outstanding liabilities of the Government. GRF is constituted by the State Governments for meeting their obligations arising out of guarantees issued on behalf of State level bodies. Accretions to the Fund can be utilised only towards payment of guarantees issued by the Government (and invoked by the beneficiary) in respect of bonds issued/ other borrowings by their State level undertakings/ other bodies. Background Consolidated Sinking Fund 11.2 In 1999, the Reserve Bank had prepared a model CSF Scheme at the request of State Governments and circulated it amongst them for adoption/ consideration. Subsequently, the Twelfth Finance Commission had recommended that the CSF may cover repayments in respect of all the loans of State Governments (and not just open market borrowings). Against this backdrop, the Reserve Bank had circulated a revised model scheme of CSF amongst the State Governments in May 2006. In October 2012, a Working Group (WG) set up to examine various avenues for investment of CSF, to make the Fund viable, had submitted its report. Major recommendations of the WG, inter alia, included building up a minimum corpus of 3-5 per cent of State liabilities within 5 years and maintaining it on a rolling basis thereafter. As on date, 24 States and the UT of Puducherry have set up CSF. The total corpus built up to March 31, 2020 amounts to ₹1,30,431.38 crore. Guarantee Redemption Fund 11.3 Based on recommendations of the ‘Technical Committee on State Government Guarantees’ (February 1999), many States had taken initiatives to fix a ceiling on guarantees issued by them. Further, a Group of State Finance Secretaries constituted to assess the Fiscal Risk of State Government Guarantees (2002) underlined the importance of according appropriate risk weights in respect of devolvement of guarantees and suggested estimation of risk weighted guarantees so as to make adequate budgetary provisions for honouring these guarantees, if they devolve on the States. The Report of the Fiscal Responsibility Legislation (FRL) at the State Level (2005) recommended fixing a limit on annual incremental risk-weighted guarantees in relation to their GSDP/ total revenue receipts. Many States have incorporated this recommendation in their FRL. In 2003, the Reserve Bank had circulated a draft scheme on GRF amongst the State Governments, for voluntary adoption. As on March 31, 2020, 18 State Governments have joined the GRF and have invested a sum of ₹7,486 crore. Measures taken by the Reserve Bank to encourage building of Reserve Funds 11.4 The Advisory Committees constituted in 2005 and 2015 had permitted the use of incremental investments in CSF and GRF as collateral for availing SDF, to encourage the State Governments to invest in CSF and GRF liberally. In June 2018, the rate of interest on SDF (availed against investments in CSF and GRF) was lowered from Repo Rate minus one per cent to Repo Rate minus two per cent, to further incentivise and encourage States to build the corpus in CSF and GRF. 11.5 Key features of CSF and GRF | Features | CSF | GRF | | Contributions to the Fund | The Government shall commence contribution to the Fund on a modest scale of at least 0.5 per cent of the outstanding liabilities as at the end of the previous year and make efforts to raise the minimum contribution every year. There is no ceiling on such contributions to the Fund in terms of number of times of making contributions in a year. | The Fund shall be set up by the Government with an initial contribution of minimum 1 per cent of outstanding guarantees at the end of the previous year and thereafter minimum 0.5 per cent every year to achieve a minimum level of 3 per cent in next five years. The Fund shall be gradually increased to a desirable level of 5 per cent. If guarantees have been invoked or are likely to be invoked, additional Funds (over and above 5%) shall be maintained. | | Withdrawal from the Fund | Permissible only for repayment of Outstanding liabilities which includes internal debt and Public Account liabilities of the Government. | Permissible only for meeting the payment obligations arising out of guarantees issued by the Government and invoked by the beneficiaries. | | Withdrawal Limit | Withdrawal is allowed from the interest income accrued and accumulated in the Fund up to the end of previous financial year.
The amount shall not exceed the amount of redemption due for that year in respect of open market borrowings. | Withdrawals allowed from out of the balance accumulated in the Fund up to the date towards redemption of the guarantees invoked and to be paid by the Government, as per its directions or Government shall have the option to withdraw excess fund over 5 per cent of outstanding guarantees of the previous year. | | Lock-in Period | 5 years | - | | Facility to avail SDF | The net incremental annual investmentof States (i.e. outstanding balance overand above the level in the correspondingperiod of the previous year) is eligible foravailing SDF. | The net incremental annual investment of States (i.e. outstanding balance over and above the level in the corresponding period of the previous year) is eligible for availing SDF. | Advantages of Maintaining CSF/ GRF 11.6 The Committee deliberated on the various advantages that accrue to State Governments by maintaining CSF and GRF, as elaborated below: a)CSF can act as a buffer fund for repayment of redemption dues, in the absence of which, States may have to resort to market borrowings. b)Availability of a buffer fund increases the investors’ confidence in a State’s issuance, which may in turn have a positive impact on the borrowing cost of the State. c) CSF can cushion the impact on States’ Finances in times of economic stress. d) Similarly, GRF can be used to meet the contingent liabilities created by States through issuance of guarantees, thus averting an adverse impact on States’ finances. e) The semi-annual coupons (interest) earned out of investments in CSF/ GRF, and the redemption proceeds received on maturity, gets reinvested in the Fund. This builds up a sizeable corpus over a period of time. f) State Governments also benefit by using the incremental investment in CSF and GRF to avail SDF at a lower rate of interest22 i.e., at Repo minus two per cent. Limitations in CSF and GRF Schemes 11.7 While States benefit at large by maintaining reserve funds in the form of CSF and GRF, some of the States had indicated below-mentioned factors that act as constraints in maintaining CSF/ GRF: a) Contributing to Reserve funds using funds raised through market borrowing entails a cost to the State Governments. If States avail SDF against these investments, the cost may be mitigated to a limited extent (as SDF is granted at a concessional rate). b) Under the prevailing CSF scheme, the principal contribution gets locked up as the States can withdraw only the interest accrued and accumulated in the Fund and not the principal corpus. Also, a State is allowed to withdraw after a lock-in period of 5 years, and only to meet the redemption requirements in the year of withdrawal. Likewise, under the GRF scheme, funds can be withdrawn only to meet the payment obligations arising out of guarantees invoked, irrespective of the size of the corpus. The Committee believes that these restrictive features may act as a disincentive for maintaining/ contributing to the Fund. Why States should continue to maintain CSF and GRF 11.8 From the pros and cons listed above, it is evident that the advantages of maintaining the buffer funds far outweigh the disadvantages. The outbreak of Covid-19 pandemic has also proven that, at times of financial stress, the buffer funds maintained by States largely assist them in meeting their redemption liabilities. The Committee also noticed that issuance of guarantee by States on behalf of their State level undertakings has increased considerably over the years making it necessary for States to maintain GRF, to meet such contingent liabilities. 11.9 Hence, it is felt that the States should continue to build their CSF and GRF to the desirable level of 5 per cent of their total outstanding liabilities/ guarantees. To aid the same, the Committee is of the opinion that the terms and conditions of CSF and GRF may be liberalised further. The Committee also urges the remaining States to join the CSF/ GRF Schemes, which would facilitate the States to withdraw from the fund to repay liabilities at times of need and also avail SDF at times of temporary cash flow mismatches. Recommendations 11.10 In order to address the issues raised by States and to encourage building up of the corpus in CSF and GRF, the Committee proposes the following measures: | Feature | Existing Provision | Changes Recommended | | Minimum corpus in CSF/ GRF | The Government may contribute to the Fund on a modest scale of at least 0.5 per cent of the outstanding liabilities as at the end of the previous year beginning with the year of inception and shall make efforts to raise the minimum contribution every year. | Minimum corpus to be
a) at least 5 per cent of total outstanding liabilities/ guarantees, as applicable;
b) built within 5 years;
c) maintained on a rolling basis, thereafter. | | Withdrawal from CSF | a) Withdrawal is permitted after a lock-in period of 5 years from constitution of CSF. | Withdrawal to be allowed after a lock-in period of 2 years from constitution of CSF. | b) Withdrawal is allowed from the interest income accrued and accumulated in the Fund up to the end of previous financial year.
c) Permissible only for repayment of outstanding liabilities which includes internal debt and public account liabilities of the Government. | Till Minimum corpus is built | No change in existing terms | | After achieving Minimum corpus of 5% of total outstanding liabilities | Withdraw from the balance outstanding (including Principal) in excess of the Minimum corpus, for repayment of outstanding liabilities23;
(OR)
Withdraw from the interest accrued and accumulated in the Fund, for repayment of outstanding liabilities, as per the existing norms.
(States will be allowed to choose only one of the above options at a single instance) | | | d) The amount withdrawn shall not exceed the amount of redemption due for that year in respect of open market borrowings. | This condition of limiting the quantum of withdrawal to the amount of market borrowing redemption due for that year, can be removed.
States may be allowed to use the total quantum of interest accrued and accumulated in the Fund (up to the end of previous financial year) for repayment of outstanding liabilities, which includes internal debt and public account liabilities of the Government. | 11.11 The prevailing provision in CSF/ GRF Scheme necessitates consultation with State Governments for selection of securities to be liquidated, in case of premature disinvestment from CSF/ GRF. The Committee proposes that this condition may be removed in view of operational convenience and the Reserve Bank may be allowed to decide on the securities to be liquidated, provided the securities chosen for disinvestment are in profit, at the time of sale. Accordingly, the CSF and GRF Schemes may be amended. 11.12 The Committee observed that States need to ensure accuracy of data on contingent liabilities, including that of guarantees. They also need to strengthen data collection, disclosure and improve reporting of data on sector-wise guarantees. Interim Liberalisation owing to COVID-19 11.13 In response to the COVID-19 pandemic, States had to take unprecedented measures to contain the spread of the epidemic which entailed a heavy cost to the State Governments. Hence, in order to ease the financial constraints faced by State Governments, the Reserve Bank had reviewed the CSF Scheme and had decided to temporarily relax the rules governing withdrawal from CSF. Accordingly, States were permitted to withdraw a portion of their total balance outstanding at the end of March 2020 (including both Principal and Interest accrued), while ensuring that a minimum balance is retained in the Fund. The relaxation had made available additional funds to the States for repaying their redemption dues. This additional sum, together with the normally permissible withdrawal limit under CSF, was expected to aid the States in meeting 45 per cent of the redemption of their market borrowings, due in 2020-21. This interim change in withdrawal norms came into force on May 22, 2020 and remain valid till March 31, 2021. XII. REVIEW OF MINIMUM CASH BALANCE OF STATE GOVERNMENTS 12.1 The Committee reviewed the requirements of minimum cash balance to be maintained by State Governments. The Committee concluded that raising minimum cash balance does not serve any purpose as surplus cash maintained over the minimum balance automatically gets invested in ITBs, thereby generating returns for the States. Accordingly, the Committee recommends that the total minimum balance set for States/ UTs may be retained at ₹42.33 crore. A brief on the subject is given in the Annex-2. XIII. RECOMMENDATIONS 1.The States have been able to manage the fiscal stress caused by COVID-19, primarily through a mix of expenditure compression and additional open market borrowings and financial accommodation provided by the Reserve Bank through SDF, WMA and OD. The Committee calculated WMA limits based on the total expenditure of State Governments. The rationale for adopting expenditure-based methodology was to revise the limit according to the fiscal size of States. The formula-based revised limit, thus arrived, works out to ₹47,010 crore. As the effect of pandemic is still prevalent, and the formula-based revised WMA limit arrived at by the Committee is lower than the interim limit, the Committee is of the view that the interim WMA limit of ₹51,560 crore may continue for 6 months i.e., up to September 30, 2021. Thereafter, depending on the course of the pandemic and its impact on the economy, Reserve Bank may review the limit, either based on the methodology suggested by the Committee or as may be necessary, after assessing the then requirement of States. 2.The Committee also recommends that the prevailing interest rate on SDF/ WMA/ OD may be retained. 3.The Committee proposes that the OD Regulations24 may continue and the interim relaxations25 on OD may cease to exist by March 31, 2021. 4. The Committee recommends that the operating limit of SDF should continue to be calculated against the collateral of investments in G-sec/ ATBs and the net annual incremental investments in CSF and GRF, without any upper limit, and the usual haircut margin of 5 per cent shall be applied. 5. The Committee recommends that the limitation26 on availing SDF against investment in 91-day T-bills may be removed and States be allowed to invest in 91-day T-bills without the restriction of 90 days, provided the SDF/ WMA availed prior to such investment is fully repaid. Likewise, prevailing condition of permitting States to invest their cash surplus in ATBs27 only when they have not availed WMA in the immediately preceding period of 90 consecutive days, may also be removed. However, States may take care to not avail SDF after investing their cash balances in 91-day T-bills. If such instances prevail, the Reserve Bank may take measures as deemed necessary to curtail such activities. 6.The Committee underscores that CSF and GRF are reserve funds, constituted voluntarily by States for a specific purpose, and need to be built up substantially. Hence, the Committee urges the remaining States to join CSF/ GRF schemes, which would facilitate them to withdraw from the Fund to repay liabilities in times of need, and also to avail SDF for managing temporary cash flow mismatches. 7. The Committee recommends that a minimum corpus be built by States in CSF and GRF, within the next 5 years, and maintained on a rolling basis thereafter. States may build a minimum corpus of at least 5 per cent of the total liabilities/ guarantees outstanding at the end of previous FY. 8.Regarding lock-in period for withdrawal from CSF, the Committee recommends that withdrawal be allowed after a lock-in period of 2 years from constituting the Fund, in place of the prevailing lock-in period of 5 years. 9. The prevailing condition in CSF scheme which limits the quantum of withdrawal from CSF to the amount of redemption due for that year towards market borrowing, may be removed. States may be allowed to use the total quantum of interest accrued and accumulated in the Fund (up to the end of previous FY) for repayment of outstanding liabilities28. 10. On building the minimum corpus as stated above, States may be allowed to withdraw from CSF29, any sum in excess of the minimum corpus of 5 per cent. This will enable States to use the funds invested in excess of the minimum requirement, for repayment of outstanding liabilities. 11. In case of CSF, States will continue to have the existing option of withdrawing from the interest accrued and accumulated in the Fund, and can exercise either one of the withdrawal option, at a single instance. 12. The prevailing provision in CSF/ GRF schemes which necessitate consultation with State Governments for selection of securities in case of premature disinvestment from CSF/ GRF, may be removed, in view of operational convenience. Reserve Bank may be allowed to decide on the securities to be liquidated, provided the securities chosen for disinvestment are in profit at the time of sale. 13. The States may, accordingly, amend their CSF and GRF Schemes and notify the same in their Official Gazette, to avail the benefit of above-mentioned relaxations in the CSF and GRF Schemes. 14. The Committee recommends that the minimum balance fixed for States may not be revised at present and the system of having differential minimum balance for each State/ UT can continue as it has been working fine so far (Annex 2). The Committee believes that raising the minimum cash balance does not serve any purpose and runs contrary to the objective, considering WMA limit is being revised upwards periodically in line with cash flows/ budgetary transactions of States.
Annex 1: Revision of WMA – Recommendation by Previous Committees (Contd.) | (Amount in ₹ crore) | | Items | Just Prior to the Vithal Committee | Vithal Committee | Group of State Finance Secretaries | Ramachandran Committee | Bezbaruah Committee | Sumit Bose | | Normal WMA | | Methodology for Computation of WMA Limit | Expressed 168 times the minimum balances of the States. | Average of revenue receipts and capital expenditure of the latest three years multiplied by a ratio of 2.25% for non-special category States and 2.75% for special category States | Average of revenue receipts and capital expenditure of the latest three years multiplied by a ratio of 2.4% for non-special category and 2.9% for special category States | Average of only revenue receipts of latest three years multiplied by a ratio of 3.19% for non-special category and 3.84% for special category States. | Average of revenue expenditure and capital expenditure of the latest three years adjusted for ad hoc expenditure and multiplied by a ratio of 3.1% for non-special category and 4.1% for special category States | Average of total expenditure (revenue expenditure plus capital expenditure) excluding lottery expenditure of the States. The State- wise WMA limits for HS&NES and other States were obtained by applying the ratio of 2.78 per cent and 2.03 per cent. | | Aggregate WMA Limits | 2,234 | 3,941 | 5,283 | 7,170 | 9,875 | 32,225 | | i) Non-Special Category | 2,033 | 3,589 | 4,794 | 6,445 | 8,820 | 28,035 | | ii) Special Category | 202 | 352 | 489 | 725 | 1,055 | 4,190 | | Special Drawing Facility (SDF) | | Computation of limits (Margin) | Limits were placed at 64 times the minimum balances | Invst. In Gsec
15 %*
10 %** | Invst. In Gsec
15 %*
10 %** | Investment in G-Secs 5 per cent uniformly | Investments in GoI securities plus incremental investment of CSF and GRF subject to a maximum of NWMA limit. | A uniform hair cut margin of 5 per cent to be applied on the market value of securities for determining the operating limit of SDF.
Accordingly, SDF limit for States will undergo changes based on the market value of outstanding securities. | | Use of SDF | Availed of after Normal WMA | Availed of after Normal WMA | Availed of after Normal WMA | To be availed of before utilising Normal WMA limit. | To be availed of before utilising Normal WMA limit | To be availed of before utilising Normal WMA limit | | Overdraft (OD) | | No. of consecutive working Days | 10 | 10 | 12 | 14 | 14 | 14 | | No. of days in a quarter | - | - | - | 36 | 36 | 36 | | No. of consecutive working days in excess of NWMA limit | - | 3 | 5 | 5 | 5 | 5 | * For securities with residual maturity of more than 10 years.
** For securities with residual maturity of less than 10 years.
Source: Report of the Sumit Bose Committee |
Annex 2: Minimum Cash Balance of State Governments: A Review In terms of the agreement between the Reserve Bank and State Governments under Section 21A of the RBI Act 1934, States have to maintain with the Reserve Bank such minimum cash balances as may be agreed upon from time to time, and the Reserve Bank grants WMA to State Governments up to certain limits. The minimum balances were fixed for the first time on April 1, 1937 (effective only from April 1, 1938) based on the ratio of total revenue and expenditure of the concerned provincial Government to the total revenue and expenditure of the pre-provincial autonomy Central Government (based on data of previous 3 years). The minimum balances so fixed also represented the limits up to which States could avail WMA from the Reserve Bank. In the subsequent years, minimum balance for States was reviewed and liberalised30 as it was found inadequate with respect to the revenue and expenditure of State Governments. The minimum cash balance, as and when revised, formed the basis of revision of WMA limit of States as it was fixed as a multiple of minimum balance. In addition to Normal WMA, SDF has also been in operation since April 1953. A comprehensive review of cash balance and WMA limit was done by Vithal Committee in 1998. Prior to Vithal Committee, WMA limit was equivalent to 168 times the minimum balance of States. The Vithal Committee observed that fixing the WMA limit as a multiple of an unchanged minimum balance, as in the past, does not capture the differing needs of States in line with the growth in their budgetary transactions. Hence, the Committee proposed linking the normal WMA limit to cash flows of the State and suggested total expenditure (i.e., revenue plus capital) less revenue deficit, as the proxy for cash flows. As per the Vithal Committee, the minimum balance worked out to ₹41.04 crore for all States. (₹.37.97 crore for the non-special category States and ₹3.08 crore are for the special category States). Subsequent to joining of UTs of Puducherry and Jammu and Kashmir, the minimum balance went up by ₹0.15 crore (on December 17, 2007) and ₹1.14 crore (on April 1, 2011) to ₹41.19 crore and ₹42.33 crore, respectively. Minimum balance of States has remained unchanged since Vithal Committee (1999). At present, it stands fixed at ₹42.33 crore for all States – bifurcated into ₹4.38 crore for HS & NES, including Jammu and Kashmir, and ₹37.95 crore for Other States. Excluding the UT of Jammu and Kashmir, effective minimum cash balance stands at ₹41.19 crore – ₹ 3.24 crore for NE & HS and ₹37.95 crore for other States. State Governments are required to maintain a minimum balance with the Reserve Bank, which varies from State to State depending on the size of States’ budget and economic activity. Accordingly, the differential minimum balance for States has last been set in 1999 according to their budget size (expenditure and revenue of individual States) relative to total expenditure and revenue, and linked to the same base as for WMA, to reflect the differing needs of States. The differential minimum balance has not been changed since then because the methodology for computing WMA limits had undergone a change and was based on cash flow data of receipts and expenditure as against the earlier methodology wherein WMA limit was derived as a multiple of minimum balance. Moreover, with the funding sources of States’ GFD progressively tilted towards market borrowings, there was no requirement of keeping minimum cash balance as most of the States started having surplus cash which automatically gets invested in ITBs/ ATBs of Central Government. The Committee deliberated on revising the minimum balance and concluded that raising minimum cash balance does not serve any purpose as surplus cash maintained over the minimum balance is automatically getting invested in ITBs, thereby generating returns for the States. Accordingly, it is decided that the total minimum balance set for States/ UTs may be kept unchanged at ₹42.33 crore (Table 8). | Table 8: Minimum Cash Balance and WMA Limit for State/ UT Governments | | (Amount in ₹ crore) | | S. No. | Date of Revision | Minimum Balance
(Total for all States) | Normal WMA Limits
(In multiples of Minimum Balance) | SDF
(Special WMA) | | 1 | April 1, 1937 (effective April 1, 1938) (Provincial Government/Part A States) | 1.95 | 1 (1.95) | * | | 2 | April 1, 1953 (Part A/Part B States) | a) 3.94 on Friday
b) 3.38 on day other than Friday
c) 4.50 before repayment of WMA | 2 (7.88) | 2.00 for each State | | 3 | March 1, 1967 | 6.25 | 3 (18.75) | 6 (37.50) | | 4 | May 1, 1972 | 6.50 + | 12 (78.0) | 6 (42.66) | | 5 | May 1, 1976 | 13 | 10 (130.0) | 10 (130.0) | | 6 | October 1, 1978 | 13 | 20 (260.0) | 10 (130.0) | | 7 | July 1, 1982 | 13 | 40 (520.0) | 20 (260.0) | | 8 | October 1, 1986 | | | | | | a) April-September | 13 | 52 (676.0) | 20 (260.0) | | | b) October-March | 13 | 48 (624.0) | 20 (260.0) | | 9 | March 1, 1988 | 13.30 ## | 56 (744.80) | 20 (266.0) | | 10 | November 1, 1993 | 13.3 | 84 (1,117.20) | 32 (425.60) | | 11 | August 1, 1996 | 13.3 | 168 (2,234.40) | 64 (852.20) | | 12 | March 1, 1999 | 41.04 ** | 3,941.00 # | ++ | | 13 | February 1, 2001 | 41.04 | 5,283.00 | ++ | | 14 | April 1, 2002 | 41.04 | 6,035.00 | ++ | | 15 | April 1, 2003 | 41.04 | 7,170.00 | ++ | | 16 | April 1, 2005 | 41.04 | 8,935.00 | ++ | | 17 | April 1, 2006 | 41.04 | 9,875.00 | ++ | | 18 | December 17, 2007 | 41.19 *** | 9,925.00 | ++ | | 19 | April 1, 2011 | 42.33 **** | 10,240.00 | ++ | | 20 | November 11, 2013 | 42.33 | 15,360.00 | ++ | | 21 | November 20, 2015 | 42.33 | 32,225.00 | ++ | | 22 | March 26, 2018 | 42.33 | 32,225.00 | ++ | * Secured Ways and Means Advances were occasionally granted on an ad-hoc basis.
+ The increase of ₹0.25 crore over the figure for 1967 was due to the fixation of minimum balance for four States viz. Himachal Pradesh, Manipur, Meghalaya and Tripura. There was no revision for other States.
** The minimum balance revised upwards linking it to the same base as for WMA.
++ The limits for special WMA liberalised, no upper limit on Special WMA, which is being provided against the actual holdings of Central Government Securities subject to margin.
# The aggregate amount applicable in March 1999 was ₹3,685 crore on the basis of the recommendation of IAC. On bifurcation of Bihar, Madhya Pradesh and Uttar Pradesh, interim limits were granted to the six recognised States effective November 2000.
## Joining of Goa raised the minimum balance by ₹0.30 crore.
*** Joining of UT of Puducherry raised the minimum balance by ₹0.15 crore.
* Joining of Jammu & Kashmir raised the minimum balance by ₹1.14 crore.
Source: Report of the Sumit Bose Committee |
Annex 3: Interest Rate on WMA, SDF and OD – Historical Trend (Contd.) | S. No. | Period | Normal WMA | SDF (Special WMA) | OD | | 1 | 2 | 3 | 4 | 5 | | 1. | Prior to March 1967 | 1% below Bank Rate | i) Up to ₹50 lakh - 0.25% below Bank Rate
ii) ₹51 lakh to ₹125 lakh - ½% below Bank Rate on the entire amount
iii) Over ₹125 lakh – Bank rate on the entire amount | Bank rate | | 2. | March 1967 to April 1976 | 1% below Bank Rate | 1% below Bank Rate | Bank Rate | | 3. | May 1976 to August 1996 | i) First 90 days - 1% below Bank Rate
ii) 91-180 days - 1% above bank Rate
iii) Beyond 180 days - 2% above Bank Rate | i) First 90 days - 1% below Bank Rate
ii) 91-180 days - 1% above bank Rate
iii) Beyond 180 days - 2% above Bank Rate | i) For 7 days - Bank Rate
ii) From 8th day onwards - 3% above Bank Rate | | 4. | August 1996 to January 15, 1998 | Bank Rate | Bank Rate | Bank Rate plus 3% | | 5. | Jan 16, 1998 to March 18, 1998 | 2% below Bank Rate | 2% below Bank Rate | Bank Rate | | 6. | March 19, 1998 to April 2, 1998 | 1.5% below Bank Rate | 1.5% below Bank Rate | 0.5% above Bank Rate | | 7. | April 3 to April 28, 1998 | 1% below Bank Rate | 1% below Bank Rate | 1% above Bank Rate | | 8. | April 29, 1998 to November 1998 | Bank Rate | Bank Rate | 2% above Bank Rate | | 9. | Vithal Committee-November 1998 | Bank Rate | Bank Rate | Bank Rate plus 2% | | 10. | Group of State Finance Secretaries - January 2001 | Bank Rate | Bank Rate | Bank Rate plus 2% | | 11. | Ramachandran Committee - January 2003 | Bank Rate for the period of 1-90 days and 1% above Bank Rate for the period beyond 90 days. | 1% below Bank Rate. | OD up to 100% of NWMA at 3% above the Bank Rate and for OD exceeding 100% of NWMA at 6% above the Bank Rate. | | 12. | Bezbaruah Committee - October 2005 | Repo Rate for the period of 1-90 days and 1% above Repo Rate for the period beyond 90 days. | 1% below Repo Rate. | OD up to 100% of NWMA at 2% above Repo Rate and for OD exceeding 100% of NWMA at 5% above the Repo Rate. | | 13. | Sumit Bose Committee - January 2016 | Repo Rate for the period of 1-90 days and 1% above Repo Rate for the period beyond | 1% below Repo Rate | OD up to 100% of NWMA at 2% above Repo Rate and for OD exceeding 100% of NWMA at 5% above the Repo Rate. | | Source: Report of the Sumit Bose Committee |
Annex 4: Investments in ITBs and ATBs by States (end- March) | (Amount in ₹ crore) | | State | 2015-16 | 2016-17 | 2017-18 | 2018-19 | 2019-20 | 2020-21* | | ITBs | ATBs | ITBs | ATBs | ITBs | ATBs | ITBs | ATBs | ITBs | ATBs | ITBs | ATBs | | Andhra Pradesh | 2707 | 500 | 3703 | 0 | 0 | 0 | 0 | 0 | 5137 | 0 | 0 | 0 | | Arunachal Pradesh | 1201 | 0 | 277 | 0 | 313 | 0 | 673 | 0 | 1416 | 0 | 1840 | 0 | | Assam | 6135 | 1400 | 3802 | 1400 | 937 | 0 | 8324 | 0 | 2933 | 0 | 6079 | 0 | | Bihar | 8194 | | 12997 | 0 | 17391 | 0 | 14787 | 0 | 17584 | 0 | 11402 | 0 | | Chhattisgarh | 1858 | | 2514 | 0 | 4075 | 0 | 9773 | 0 | 5250 | 5000 | 4436 | 4550 | | Goa | 255 | 0 | 342 | 0 | 148 | 0 | 343 | 0 | 342 | 0 | 604 | 0 | | Gujarat | 7951 | | 11700 | 0 | 4137 | 0 | 5837 | 0 | 9289 | 0 | 10414 | 0 | | Haryana | 4089 | 0 | 2471 | 0 | 2001 | 0 | 638 | 0 | 2249 | 0 | 3025 | 0 | | Himachal Pradesh | 557 | 0 | 759 | 0 | 724 | 0 | 102 | 0 | 982 | 0 | 1601 | 3100 | | Jammu and Kashmir | 43 | 0 | 0 | 0 | 0 | 0 | 0 | 0 | 0 | 0 | 0 | 0 | | Jharkhand | 2102 | 0 | 1439 | 0 | 355 | 0 | 168 | 0 | 3071 | 0 | 2714 | 0 | | Karnataka | 16949 | | 24012 | 0 | 12674 | 0 | 5149 | 0 | 13652 | 0 | 33903 | 12000 | | Kerala | 1643 | 0 | 1950 | 0 | 887 | 0 | 188 | 0 | 0 | 0 | 0 | 0 | | Madhya Pradesh | 9503 | 0 | 10643 | 0 | 7423 | 0 | 8651 | 0 | 11280 | 0 | 21177 | 0 | | Maharashtra | 21529 | 15000 | 32344 | 12000 | 43446 | 15000 | 9371 | 26000 | 14120 | 0 | 21105 | 10000 | | Manipur | 0 | 0 | 0 | 0 | 0 | 0 | 0 | 0 | 58 | 0 | 0 | 0 | | Meghalaya | 273 | 0 | 1375 | 0 | 1686 | 0 | 1076 | 0 | 807 | 0 | 396 | 0 | | Mizoram | 155 | 0 | 443 | 0 | 461 | 0 | 163 | 0 | 295 | 0 | 15 | 0 | | Nagaland | 0 | 0 | 35 | 0 | 63 | 0 | 135 | 0 | 0 | 0 | 0 | 0 | | Odisha | 5786 | | 8685 | 0 | 13314 | 12050 | 8945 | 15100 | 8034 | 17370 | 11391 | 16665 | | Puducherry | 494 | 505 | 806 | 280 | 526 | 715 | 405 | 888 | 582 | 700 | 974 | 806 | | Punjab | 5180 | 0 | 0 | 0 | 0 | 0 | 469 | 0 | 804 | 0 | 864 | 0 | | Rajasthan | 2916 | 3000 | 5585 | 2517 | 6402 | 2974 | 2154 | 3792 | 5808 | 1800 | 3926 | 2000 | | Tamil Nadu | 9443 | 5569 | 15181 | 19306 | 11278 | 31369 | 11038 | 27347 | 10171 | 8634 | 11245 | 19762 | | Telangana | 2509 | 0 | 53 | 0 | 2281 | 0 | 1591 | 0 | 6911 | 0 | 0 | 0 | | Tripura | 1354 | 1300 | 804 | 1100 | 1207 | 0 | 432 | 800 | 933 | 0 | 1938 | 0 | | Uttar Pradesh | 615 | | 1205 | 0 | 10173 | 0 | 25435 | 0 | 19880 | 0 | 31383 | 0 | | Uttarakhand | 345 | 0 | 452 | 0 | 386 | 0 | 248 | 0 | 0 | 0 | 2354 | 0 | | West Bengal | 6794 | 0 | 12481 | 0 | 8584 | 0 | 5989 | 0 | 13170 | 0 | 5574 | 0 | | Total | 120582 | 27274 | 156059 | 36603 | 150871 | 62108 | 122084 | 73927 | 154757 | 33504 | 188360 | 68883 | *: as on end-February 2021
Source: RBI records |
Annex 5: Average Investment in ITBs | (Amount in ₹ crore) | | States | 2015-16 | 2016-17 | 2017-18 | 2018-19 | 2019-20 | 2020-21
(end-February 2021) | | Andhra Pradesh | 1288 | 1271 | 1443 | 1379 | 1959 | 2289 | | Arunachal Pradesh | 814 | 1263 | 1133 | 1865 | 1978 | 2394 | | Assam | 4644 | 7601 | 5361 | 4619 | 5035 | 4733 | | Bihar | 8691 | 14250 | 13504 | 18441 | 17371 | 12379 | | Chhattisgarh | 936 | 1947 | 3451 | 3538 | 2425 | 2243 | | Goa | 61 | 133 | 178 | 169 | 265 | 177 | | Gujarat | 6670 | 7778 | 9839 | 5866 | 6642 | 6695 | | Haryana | 3696 | 3478 | 2554 | 2424 | 2503 | 2637 | | Himachal Pradesh | 644 | 732 | 1440 | 1169 | 1101 | 792 | | Jammu and Kashmir | 528 | 431 | 447 | 533 | 568 | 1073 | | Jharkhand | 2054 | 2234 | 2093 | 989 | 2303 | 3249 | | Karnataka | 6354 | 7553 | 8355 | 7799 | 5983 | 14558 | | Kerala | 1146 | 1828 | 1109 | 1234 | 919 | 1148 | | Madhya Pradesh | 5083 | 9286 | 12678 | 4072 | 4557 | 9432 | | Maharashtra | 7328 | 13367 | 16919 | 14361 | 13438 | 11299 | | Manipur | 402 | 245 | 385 | 450 | 271 | 208 | | Meghalaya | 651 | 795 | 1158 | 1300 | 738 | 490 | | Mizoram | 260 | 541 | 649 | 732 | 347 | 200 | | Nagaland | 139 | 148 | 223 | 193 | 181 | 91 | | Odisha | 4693 | 6043 | 10567 | 9177 | 9121 | 11737 | | Puducherry | 267 | 255 | 366 | 322 | 383 | 395 | | Punjab | 507 | 990 | 399 | 470 | 586 | 1043 | | Rajasthan | 3526 | 4362 | 5514 | 4802 | 2649 | 2655 | | Tamil Nadu | 9035 | 11141 | 10256 | 10757 | 9610 | 16412 | | Telangana | 2035 | 1286 | 1030 | 1171 | 1157 | 2665 | | Tripura | 1047 | 779 | 961 | 960 | 569 | 1133 | | Uttar Pradesh | 2819 | 5239 | 11684 | 19393 | 17878 | 14672 | | Uttarakhand | 759 | 651 | 545 | 493 | 939 | 1024 | | West Bengal | 1982 | 5043 | 7272 | 3115 | 3464 | 3763 | | Total | 78059 | 110670 | 131513 | 121793 | 114940 | 131586 | | Source: RBI records. |
Annex 6: Average Investment in ATBs | (Amount in ₹ crore) | | States | 2015-16 | 2016-17 | 2017-18 | 2018-19 | 2019-20 | 2020-21
(end-February, 2021) | | Andhra Pradesh | 1645 | 2122 | 811 | 0 | 0 | 0 | | Arunachal Pradesh | 0 | 0 | 0 | 0 | 0 | 0 | | Assam | 1400 | 1400 | 1400 | 3151 | 3537 | 0 | | Bihar | 400 | 5944 | 8193 | 9167 | 11837 | 0 | | Chhattisgarh | 0 | 0 | 0 | 217 | 5418 | 4499 | | Goa | 0 | 0 | 0 | 0 | 0 | 0 | | Gujarat | 3694 | 2036 | 3435 | 0 | 0 | 0 | | Haryana | 0 | 0 | 0 | 0 | 0 | 0 | | Himachal Pradesh | 0 | 500 | 646 | 602 | 1200 | 2324 | | Jammu and Kashmir | 0 | 0 | 0 | 0 | 0 | 0 | | Jharkhand | 0 | 0 | 0 | 0 | 0 | 0 | | Karnataka | 10528 | 12261 | 13829 | 11146 | 7569 | 18742 | | Kerala | 0 | 0 | 0 | 0 | 0 | 0 | | Madhya Pradesh | 0 | 0 | 0 | 0 | 0 | 0 | | Maharashtra | 23905 | 24219 | 32333 | 39193 | 18364 | 18834 | | Manipur | 0 | 0 | 0 | 0 | 0 | 0 | | Meghalaya | 0 | 0 | 0 | 0 | 0 | 0 | | Mizoram | 0 | 0 | 0 | 0 | 0 | 0 | | Nagaland | 0 | 0 | 0 | 0 | 0 | 0 | | Odisha | 2084 | 2688 | 5228 | 19861 | 21319 | 18254 | | Puducherry | 361 | 484 | 635 | 935 | 876 | 908 | | Punjab | 0 | 0 | 0 | 0 | 0 | 0 | | Rajasthan | 6577 | 6525 | 5538 | 5220 | 2013 | 1921 | | Tamil Nadu | 9155 | 14835 | 25386 | 29158 | 14419 | 11964 | | Telangana | 0 | 0 | 0 | 0 | 0 | 0 | | Tripura | 2004 | 1615 | 1167 | 800 | 800 | 0 | | Uttar Pradesh | 0 | 0 | 0 | 0 | 0 | 0 | | Uttarakhand | 0 | 0 | 0 | 0 | 0 | 0 | | West Bengal | 0 | 0 | 5000 | 3000 | 0 | 0 | | Total | 61753 | 74629 | 103601 | 122450 | 87352 | 77446 | | Source: RBI records |
Annex 7: Monthly Average Position of SDF/ WMA/ OD availed by State Governments/ UTs | (Amount in ₹ crore) | | Month | SDF | WMA | OD | Total | | Dec-17 | 27.77 | 44.82 | 11.04 | 83.64 | | Jan-18 | 42.29 | 73.21 | 17.02 | 132.53 | | Feb-18 | 24.02 | 68.26 | 21.1 | 113.39 | | Mar-18 | 33.97 | 55.64 | 11.83 | 101.45 | | Apr-18 | 9.92 | 42.31 | 4.92 | 57.16 | | May-18 | 16.16 | 43.88 | 9.09 | 69.14 | | Jun-18 | 33.22 | 41.22 | 3.24 | 77.69 | | Jul-18 | 46.1 | 35.78 | 3.06 | 84.95 | | Aug-18 | 12.08 | 40.39 | 10.07 | 62.65 | | Sep-18 | 20.62 | 42.77 | 0.21 | 63.61 | | Oct-18 | 30.74 | 120.64 | 18.03 | 169.42 | | Nov-18 | 22.21 | 76.83 | 5.12 | 104.17 | | Dec-18 | 27.08 | 131.95 | 22.08 | 181.12 | | Jan-19 | 21.25 | 88.22 | 15.21 | 124.69 | | Feb-19 | 24.19 | 98.98 | 18.81 | 141.98 | | Mar-19 | 27.41 | 69.59 | 13.82 | 110.84 | | Apr-19 | 25.75 | 93.73 | 42.42 | 161.91 | | May-19 | 17.99 | 66.9 | 9.93 | 94.83 | | Jun-19 | 48.19 | 99.53 | 28.1 | 175.83 | | Jul-19 | 94.03 | 42.85 | 2.58 | 139.47 | | Aug-19 | 47.64 | 22.24 | 0 | 69.88 | | Sep-19 | 19.22 | 20.67 | 2.34 | 42.24 | | Oct-19 | 102.88 | 69.77 | 6.37 | 179.02 | | Nov-19 | 86.48 | 87.77 | 13.01 | 187.28 | | Dec-19 | 112.61 | 77.9 | 9.85 | 200.36 | | Jan-20 | 83.33 | 70.05 | 21.79 | 175.18 | | Feb-20 | 139.46 | 70.5 | 10.61 | 220.58 | | Mar-20 | 90.17 | 76.09 | 17.45 | 183.71 | | Apr-20 | 14.14 | 24.28 | 0.11 | 38.44 | | May-20 | 91.72 | 93.9 | 10.53 | 196.15 | | Jun-20 | 140.08 | 80.66 | 12.06 | 232.81 | | Jul-20 | 130.19 | 126.69 | 4.81 | 261.7 | | Aug-20 | 151.64 | 167.58 | 19.87 | 339.1 | | Sep-20 | 312.65 | 244.67 | 59.62 | 616.95 | | Oct-20 | 145.52 | 196.23 | 37.44 | 379.19 | | Nov-20 | 220.91 | 160.97 | 35.27 | 417.15 | | Dec-20 | 153.1 | 115.59 | 20.52 | 289.21 | | Jan-21 | 83.98 | 125.91 | 30.07 | 239.96 | | Feb-21 | 85.11 | 143.87 | 60.36 | 289.34 | | Source: RBI records |
Annex 8: Expenditure-based WMA Limit | | Capital Expenditure | Revenue Expenditure | Total Expenditure adjusted for Volatile items | Average Base | Formula- based WMA
Limit | | 2016-17 | 2017-18 | 2018-19 | 2016-17 | 2017-18 | 2018-19 | 2016-17 | 2017-18 | 2018-19 | | 1 | 2 | 3 | 4 | 5 | 6 | 7 | 8 | 9 | 10 | 11 | | I. Other States (Non- HS&NES) | | Andhra Pradesh | 15745 | 16271 | 21820 | 116178 | 121214 | 128569 | 101562 | 135562 | 148931 | 128685 | 2252 | | Bihar | 27322 | 29150 | 22529 | 94765 | 102624 | 124897 | 121266 | 128305 | 145818 | 131796 | 2272 | | Chhattisgarh | 9743 | 10370 | 9144 | 48165 | 56230 | 64411 | 57347 | 66339 | 73233 | 65640 | 1056 | | Goa | 1642 | 2128 | 2163 | 8866 | 10543 | 11083 | 8717 | 11509 | 10782 | 10336 | 203 | | Gujarat | 22833 | 26944 | 29793 | 103895 | 118060 | 132790 | 125937 | 143871 | 161840 | 143882 | 2518 | | Haryana | 11378 | 14933 | 16062 | 68403 | 73257 | 77156 | 78758 | 87599 | 92304 | 86220 | 1464 | | Jharkhand | 12113 | 13804 | 12196 | 45086 | 50950 | 50255 | 56745 | 64343 | 61859 | 60982 | 1067 | | Karnataka | 30085 | 35759 | 39147 | 131921 | 142482 | 164300 | 158968 | 176996 | 201817 | 179261 | 3137 | | Kerala | 11286 | 10289 | 9753 | 91096 | 99948 | 110316 | 93263 | 95899 | 99419 | 96193 | 1683 | | Madhya Pradesh | 32229 | 32463 | 30514 | 119537 | 130246 | 141577 | 150669 | 161578 | 167281 | 159843 | 2560 | | Maharashtra | 31826 | 27821 | 36594 | 213229 | 241571 | 267022 | 241872 | 266571 | 294897 | 267780 | 4686 | | Odisha | 18900 | 22984 | 24652 | 65041 | 71837 | 85356 | 81953 | 93791 | 108732 | 94825 | 1576 | | Punjab | 45710 | 3112 | 3773 | 55296 | 62465 | 75404 | 71890 | 37757 | 49536 | 53061 | 1104 | | Rajasthan | 29945 | 21957 | 20751 | 127140 | 145842 | 166773 | 154930 | 166274 | 185470 | 168891 | 2608 | | Tamil Nadu | 46756 | 26720 | 30789 | 153195 | 167874 | 197201 | 197587 | 194058 | 225751 | 205799 | 3601 | | Telangana | 36773 | 30111 | 31347 | 81432 | 85365 | 97083 | 105503 | 92494 | 106309 | 101435 | 1728 | | Uttar Pradesh | 76530 | 40597 | 68766 | 236592 | 266224 | 301728 | 301595 | 303140 | 369895 | 324877 | 5680 | | West Bengal | 12534 | 19338 | 24583 | 133918 | 141077 | 156374 | 143923 | 154401 | 154468 | 150931 | 2641 | | Sub-Total (I) | 473350 | 384753 | 434377 | 1893755 | 2087808 | 2352295 | 2252486 | 2380487 | 2658343 | 2430439 | 41837 | | II. HS&NES | | Arunachal Pradesh | 1550 | 3193 | 5748 | 9395 | 10900 | 12429 | 10816 | 13979 | 18008 | 14268 | 285 | | Assam | 6001 | 7947 | 11362 | 49363 | 55481 | 56899 | 53633 | 65134 | 67736 | 62168 | 1243 | | Himachal Pradesh | 6789 | 4258 | 5052 | 25344 | 27053 | 29429 | 30132 | 30587 | 32479 | 31066 | 656 | | Manipur | 1494 | 1432 | 1731 | 8185 | 9274 | 9749 | 8766 | 10381 | 8774 | 9307 | 233 | | Meghalaya | 1321 | 1005 | 1507 | 8337 | 8423 | 10256 | 9629 | 9398 | 11745 | 10258 | 209 | | Mizoram | 938 | 2041 | 1909 | 6230 | 6881 | 7506 | 7156 | 8688 | 9401 | 8415 | 191 | | Nagaland | 1075 | 1275 | 1601 | 8664 | 10191 | 10920 | 5148 | 7520 | 10350 | 7673 | 245 | | Tripura | 3318 | 1784 | 1482 | 8748 | 10357 | 11889 | 12029 | 12106 | 13313 | 12482 | 304 | | Uttarakhand | 5119 | 5991 | 6368 | 25271 | 29083 | 32196 | 25074 | 28624 | 29988 | 27895 | 602 | | Sub-total(II) | 27605 | 28927 | 36759 | 149536 | 167643 | 181273 | 162383 | 186418 | 201794 | 183532 | 3968 | | Jammu and Kashmir | 8362 | 10378 | 8418 | 39812 | 40916 | 56090 | 32954 | 31953 | 46215 | 37040 | 1050 | | Puducherry | 447 | 395 | 316 | 5458 | 5807 | 6387 | 5903 | 6174 | 6682 | 6253 | 155 | | Total (All States) | 509764 | 424453 | 479870 | 2088562 | 2302175 | 2596044 | 2453725 | 2605031 | 2913034 | 2657263 | 47010 | | Source: RBI records. |
Annex 9: Trend in Interest Rate (Contd.) | | 2015-16 | 2016-17 | 2017-18 | | Q1 | Q2 | Q3 | Q4 | Q1 | Q2 | Q3 | Q4 | Q1 | Q2 | Q3 | Q4 | | Repo Rate (end of the quarter) | 7.25 | 6.75 | 6.75 | 6.75 | 6.5 | 6.5 | 6.25 | 6.25 | 6.25 | 6 | 6 | 6 | | Bank Rate (end of the quarter) | 8.25 | 7.75 | 8.25 | 7.75 | 7 | 7 | 6.75 | 6.75 | 6.5 | 6.25 | 6.25 | 6.25 | | Treasury Bills (Weighted Average) | | | | | | | | | | | | | | 91 | 7.82 | 7.45 | 7.15 | 7.28 | 6.81 | 6.55 | 6.18 | 6.1 | 6.19 | 6.13 | 6.12 | 6.29 | | 182 | 7.86 | 7.53 | 7.19 | 7.22 | 6.91 | 6.66 | 6.28 | 6.19 | 6.33 | 6.24 | 6.23 | 6.45 | | 364 | 7.82 | 7.56 | 7.21 | 7.2 | 6.93 | 6.69 | 6.26 | 6.22 | 6.4 | 6.27 | 6.27 | 6.58 | | Weighted Average GoI dated securities (Primary Auctions) | 7.91 | 7.95 | 7.77 | 7.88 | 7.63 | 7.19 | 6.75 | 6.74 | 6.98 | 6.77 | 7.07 | 7.32 | | Average of 10 years Benchmark GoI Securities (Secondary Markets) | 7.84 | 7.78 | 7.67 | 7.8 | 7.46 | 7.15 | 6.56 | 6.65 | 6.58 | 6.52 | 6.97 | 7.66 | | 14 Day- ITBs | 5 | 5 | 5 | 5 | 5 | 5 | 5 | 5 | 4 | 3.75 | 3.75 | 3.75 | | Weighted Average Yields (SDLs) | 8.17 | 8.26 | 8.12 | 8.47 | 8.01 | 7.52 | 7.15 | 7.56 | 7.43 | 7.31 | 7.65 | 8.09 | | *: till end February 2021 |
| Annex 9: Trend in Interest Rate (Concld.) | | | 2018-19 | 2019-20 | 2020-21 | | Q1 | Q2 | Q3 | Q4 | Q1 | Q2 | Q3 | Q4 | Q1 | Q2 | Q3 | Q4 | | Repo Rate (end of the quarter) | 6.25 | 6.5 | 6.5 | 6.25 | 5.75 | 5.4 | 5.15 | 4.4 | 4 | 4 | 4 | 4 | | Bank Rate (end of the quarter) | 6.5 | 6.75 | 6.75 | 6.5 | 6 | 5.65 | 5.4 | 4.65 | 4.25 | 4.25 | 4.25 | 4.25 | | Treasury Bills (Weighted Average) | | | | | | | | | | | | | | 91 | 6.3 | 6.76 | 6.85 | 6.51 | 6.26 | 5.51 | 5.04 | 4.99 | 3.49 | 3.24 | 3.22 | 3.26 * | | 182 | 6.63 | 7.05 | 7.11 | 6.58 | 6.32 | 5.73 | 5.2 | 5.23 | 3.64 | 3.43 | 3.37 | 3.50* | | 364 | 6.81 | 7.38 | 7.32 | 6.65 | 6.34 | 5.82 | 5.26 | 5.22 | 3.71 | 3.54 | 3.46 | 3.65 * | | Weighted Average GoI dated securities (Primary Auctions) | 7.78 | 8.03 | 7.83 | 7.48 | 7.22 | 6.65 | 6.71 | 6.71 | 5.87 | 5.77 | 5.73 | 5.76* | | Average of 10 years Benchmark GoI Securities (Secondary Markets) | 7.73 | 7.9 | 7.7 | 7.52 | 7.2 | 6.56 | 6.54 | 6.42 | 5.8 | 5.97 | 5.9 | 5.9* | | 14 Day- ITBs | 4 | 4.25 | 4.25 | 4.25 | 3.5 | 3.15 | 2.9 | 2 | 1.35 | 1.35 | 1.35 | 1.35 | | Weighted Average Yields (SDLs) | 8.14 | 8.55 | 8.41 | 8.23 | 7.84 | 7.15 | 7.15 | 7.14 | 6.58 | 6.29 | 6.49 | 6.51* | | *: till end February 2021 |
Annex 10: Operating Procedure of Monetary Policy - Liquidity Management Framework of RBI The main features of the revised liquidity management framework implemented on February 14, 2020 are as follows31: a) The Weighted Average Call Rate (WACR) was retained as the operating target of the Monetary Policy and the corridor continued to be defined by the Marginal Standing Facility (MSF) rate as its upper bound (ceiling) and the fixed rate reverse repo rate as the lower bound (floor); b) a 14-day term repo/ reverse repo operation at a variable rate and conducted to coincide with the Cash Reserve Ratio (CRR) maintenance cycle was adopted as the main liquidity management tool for managing frictional liquidity requirements; c) the daily fixed rate repo and four 14-day term repos conducted earlier every fortnight stood withdrawn; d) the main liquidity operation is supported by fine-tuning operations (overnight/ longer) to tide over any unanticipated liquidity changes during the reserve maintenance period; e) longer-term variable rate repo/ reverse repo operations of more than 14 days may be conducted, if required; f) Standalone Primary Dealers (SPDs) were allowed to participate directly in all overnight liquidity management operations; g)instruments of liquidity management include fixed and variable rate repo/reverse repo auctions, outright Open Market Operations (OMOs), forex swaps and other instruments to ensure that the system has adequate liquidity at all times; h) the daily Money Market Operations press release was modified to show both the daily flow as well as the stock impact of the Reserve Bank’s liquidity operations and a quantitative assessment of durable liquidity conditions of the banking system on a fortnightly basis is published with a lag of one fortnight. As liquidity forecasts assumes primacy in the revised framework, adherence to an indicative calendar of WMA for the Centre along with the States would aid liquidity management.
Annex 11: Implications of the Recommendations by 15th FC on State Finances On the issue of tax devolution, 15th FC’s recommendations may not significantly alter the resource transfer from Centre. Maintaining the devolution share at 41 per cent of divisible pool adds predictability and stability to the transfer of resources. Notwithstanding this, the significant decrease in tax devolution since 2019-20 that continued in 2020-21 is primarily driven by the shrinking tax divisible pool because of contraction in economic activities as well as increasing share of cesses and surcharges that are kept outside the divisible pool. The increase in proceeds from cesses and surcharges from 3 per cent of gross tax revenue in 2000-01 to 15 per cent in 2018-19 and further to 23.5 per cent in 2020-21 has reduced the divisible pool and thus has brought down the effective devolution share to about 30 per cent of gross tax revenue (Chart 5). 15th FC has tried to compensate for this by increasing grants, particularly revenue deficit grants since 2020-21. The increasing share of grants in overall pool of transfers, which are assigned in terms of a fixed amount rather than a percentage of divisible pool, adds predictability to the quantum and timing of fund flow, thus reducing the revenue uncertainty. The focus on incentive/ performance-based grants is unique and can be regarded as seeds of change for States. Given states’ revealed preference to borrow lesser than the borrowing space, incentive-based grants may be a preferred choice than incentive based additional borrowing. While the Government has said that these grants will be subsumed while restructuring the centrally sponsored and central sector schemes, some of the new ones suggested by FC-XV like the one on incentivising states on producing robust statistics, as in the case of Brazil, can go a long way in effective policy making in times to come. Data transparency on ‘below the line’ items may help financial markets accurately assess the financial position of the states and may in fact be rewarded by the markets, Centre being an example where enhanced transparency in the recent Budget was supported by markets. 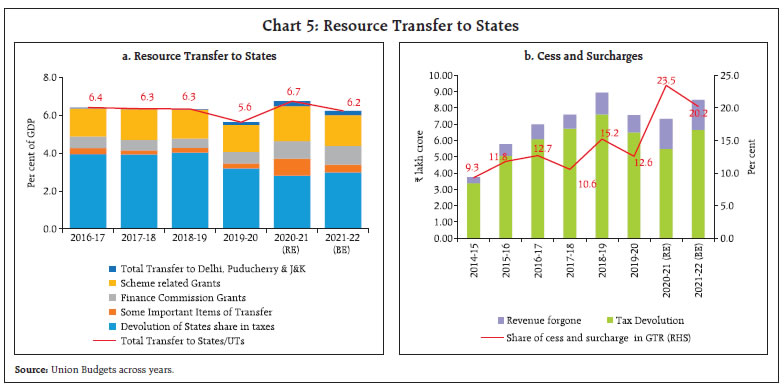 The fiscal roadmap as provided by 15th FC has given some flexibilities. As against the budgeted GFD-GDP ratio of 2.8 per cent for 2020-21, actual could be about 4.5 per cent of GDP, with states’ fiscal succumbing to the scissors’ effects of higher pandemic related expenditure coupled with lower revenues due to growth contraction. The relaxed FC XV fiscal roadmap of GFD-GDP ratio of 4.0 per cent and 3.5 per cent in 2021-22 and 2022-23, respectively, as accepted by the Union Budget, will help ensure that there is no sudden drop in resources. The return to 3.0 per cent target is only from 2023-24 onwards. Another important flexibility given by FC is that it has allowed states to utilise any utilised borrowing space across years within the award period, which the states should try and utilise towards capex push.
Annex 12: Revision of WMA limits of State Governments – Suggestions received from States/ CAS, Nagpur | Item Discussed | Existing Provision | Suggestion/ Comments | Remarks of IDMD | | WMA limit | Existing WMA limit - ₹32,225 crore
Existing limits have been calculated using the total expenditure of States as the base.
A ratio of 2.03% has been considered by the previous Advisory Committee for calculating the WMA limits. | 1. Facility of SDF/WMA/OD has become important as there are frequent cash imbalances on account of unpredictability and lower-than-expected resource transfers from the GoI.
2. The State Government is also facing a major strain on its resource availability due to the impact of the implementation of the 7th Central Pay Commission recommendations for its employees.
3. Dependence of the State on WMA/OD/SDL is likely to increase, and RBI should consider a liberal dose of WMA facility for the State.
4. WMA limits may be revised based on 1% of the GSDP of States.
5. Committee may consider allowing WMA for 120 days at Repo Rate instead of 90 days as prevalent.
6. Tax revenues are yet to recover while the State’s expenditure continues to see an uptick mostly on account of pandemic related expenditure.
7. Revision of limits based on total expenditure base seems to be reasonable.
9. However, the pandemic Induced slowdown has severely affected the finances of the States and the revival is expected to be rather slow.
10. Hence, while arriving at the new WMA limits of the states, ratio of 3% (instead of 2.03%) may be applied to the average total expenditure of states for the next 5 years or till all the States regain the growth trajectory. Or at least the existing ratio of 2.03% may be retained.
11. Annual expenditure for 2018- 19, 2019-20 & 2021-22 (BE) may be considered instead of 2020-21 (RE) as 2020-21 has been an exceptional year due to COVID-19 pandemic and expenditure of this year may not reflect the actual quantum of SDL required by States to meet their short-term cash crunch.
12. Multiplying factor for fixing the WMA limit may be reviewed at higher side. | The Committee has proposed that the interim limit of ₹51,560 crore may continue for six months in the FY 2021-22 i.e., up to September 30, 2021. Thereafter, RBI may review the limit after assessing the evolving economic situation and the requirement of States.
Sec 17(5) of the RBI Act defines WMA as advances repayable in each case not later than 3 months. Hence, a penal rate of Repo plus 1% is charged for WMA outstanding beyond 3 months.
The existing methodology has been retained after due deliberations by the Committee.
Based on the formula-based methodology adopted by the Committee, the ratio was working out to 1.3% for ‘other States’, which, however, was enhanced to 1.75% to provide a growth in the WMA limit. | | OD Regulations | Payments of the State stopped if
a) If a State continues to be in OD beyond 14 consecutive working days;
b) If a State continues to be in overdraft for more than 36 working days in a quarter.
c) If the OD exceeds 100 per cent of the WMA limit for 5 consecutive working days for the second/ subsequent time in a financial year
Interim Relaxation for FY 2020-21
a) No. of days for which a State/ UT can be in OD continuously - increased to 21 working days from the current stipulation of 14 working days.
b) No. of days for which a State/ UT can be in OD in a quarter - increased to 50 working days from the current stipulation of 36 working days. | 1. The interim measure may be made permanent as it appears reasonable.
2. However, the provision of stopping of payment may be suspended in case of Natural Calamities/Disasters of rare and severe nature as notified by Disaster Management Authorities and also at times of COVID-19 like pandemic.
3. The interim relaxation may be retained beyond the stipulated date of 31-03-2021 and for the full term of the recommendations of the 15th FC i.e. 2021-2026.
4. States may be allowed to remain in OD continuously for 21 days instead of the current limit of 14 days.
5. State may be allowed to avail OD in excess of its WMA limit, for at least 10 working days, instead of the prevailing limit of 5 working days.
6. The interim relaxation which allows States to be in OD continuously for 21 working days may be retained. | Interim relaxation provided by RBI for the FY 2020-21, wherein the limit has been extended to 21 working days. The relaxation will be available till March 31, 2021. | | SDF | Limitation on investment in G-sec/ ATBs
- States can invest their cash surplus in dated GoI securities, provided that they have not availed WMA in the immediately preceding period of 90 consecutive days.
| 1. Given the low rate of return on 14-day ITBs, above condition will amount to penalising States even in case of accidental availment of SDF for few days. Hence this condition about availment of SDF in the previous 90 days may be removed in the report.
2. Restriction on investment in CSF (G-sec) and availing SDF thereafter, limits further investments in CSF for 90 days. If removed, this will act as an incentive for States to invest in CSF.
3. Existing provision may be reviewed in view of the operational difficulties faced in implementing the restrictions. | Proposal included in the draft Report for removing this restriction. | Limitation on investment in ATBs after availing SDF
- When States avail SDF immediately after investing in 91-day TBs, they are not allowed to invest further in 91-day TBs for 90 days.
Other Issues | 1. Existing provision may be reviewed in view of the operational difficulties faced in implementing the restrictions.
2. Proposal to remove the condition is agreed to.
3. This condition may be relaxed, and the states may be allowed to avail SDF as per their requirement.
4. Committee may consider temporarily delinking SDF to the investment in CSF and GRF and allow the State to avail SDF at the rate of 50 per cent of the revised WMA for the full term of the recommendations of the 15th FC.
5. SDF limit - may be computed against entire balance in CSF & GRF.
6. Prevailing condition of calculating SDF limit against annual incremental investments in CSF & GRF implies that, a State with negligible holdings may get rewarded if they make fresh investment in a year, while States which continue to hold a sizeable corpus but not making incremental investment will get denied of SDF.
This would encourage States to maintain the corpus even at times of crisis.
7. Limit for SDF may be fixed on certain percentage of weighted average of outstanding balance of CSF and GRF as at the end of last FY plus incremental investment in CSF and GRF during the last FY taken together.
8. SDF limit may be changed on a monthly basis, instead of being calculated daily.
9. SDF should be provided against the total investment in CSF & GRF, instead of being provided only against the annual incremental investments. This will encourage States to invest in CSF/ GRF. | Proposal included in the draft Report for removing this restriction.
It is not feasible to implement the suggestion.
SDF is not a clean advance like WMA, but is granted against collateral i.e., State’s investment in G-sec (CSF & GRF)/ ATBs. Hence, it is linked to investments in CSF/ GRF which act as the collateral.
SDF limit is being calculated on a daily basis.
Coupon & redemption payments generated out of existing investments in CSF & GRF get REINVESTED into the Fund.
Reinvestments are also treated as incremental investments.
Hence, even when a State doesn’t make fresh investment in the Fund during a FY, it will continue to have an operating SDF limit.
However, fresh investments every year will get a higher SDF limit for States and also will help in building a sizeable corpus.
It is not feasible to implement the suggestion.
SDF limit has to be calculated every day as the value of collateral i.e., G-sec/ ATBs will change whenever there is investment/ disinvestment/ redemption of holdings.
It is not feasible to implement the suggestion.
SDF is a collateralised advance.
If a State is allowed to avail SDF against the total corpus in CSF/ GRF, till the advance is repaid, the State may not be able to disinvest if need arises, as the securities will remain mortgaged against SDF.
Hence, SDF limit is calculated only against annual incremental investments in CSF & GRF. | | CSF/GRF | Minimum Corpus – not prescribed in the prevailing Scheme. | 1. Agree to the proposed amendment.
2. CSF - may be fixed at a rate lower than 5% of outstanding liabilities, say 3 or 4%.
GRF - agree to the proposed minimum corpus. | Proposed Amendment – to build at least 5 per cent of total outstanding liabilities/ guarantees; to be achieved within 5 years & to be maintained thereafter on a rolling basis. | Withdrawal –
CSF - allowed after 5 years of constituting the Fund.
GRF – no lock-in period | 1. Agree to the recommendation.
However, there should be a provision for relaxation of the minimum corpus of 5% of the total outstanding liabilities at times of abnormal fiscal crisis like Natural Calamities of rare and severe nature and also at times of COVID-19 like pandemic in order to enable State Governments to take counter cyclical fiscal response.
In such situations withdrawal from accumulated balance may be allowed beyond 2.5% of the total outstanding liabilities for any purpose which can be recouped in a period of 3-5 years to the level of 5%.
2. Withdrawal should be allowed before 5 years, considering the significant redemption pressure on States in the next few years.
3. Interim relaxation by RBI is welcomed by the State due to the prevailing resource position. | Relaxation for withdrawal from accumulated balance can be allowed on case to case basis, whenever situation demands such response.
RBI has provided such interim relaxation in the current FY, in response to fiscal stress caused by COVID-19. States were allowed to withdraw up to 75% of the balance accumulated in their Fund. | | Minimum Cash Balance | Revision of Minimum Balance not required | Agree to the recommendation. | | | Any other Issues | Negative Carry - by holding surplus cash balance by State Government | 1. Interest rate on 14-day ITBs should be equivalent to interest rate on WMA chargeable to Central Government, as States are now getting an interest of only 1.35% (Reverse Repo Rate minus 200 bps) on 14-day ITBs.
2. The Ministry of Finance, GoI and RBI may thus introduce a scheme for allowing the State Governments to invest their short-term cash surpluses in short-term CMBs as non-competitive bidders. | |
Annex 13: Meetings held by the Advisory Committee First meeting of the Advisory Committee was held on October 14, 2019 at RBI, Mumbai. Following officials participated in the meeting: Chairman & Members 1 Shri. Sudhir Shrivastava, Chairman 2 Shri. N R Bhanumurthy, Professor, NIPFP 3 Shri. Sanjiv Mittal, Additional Chief Secretary (Finance), Uttar Pradesh 4 Shri. Arvind Agarwal, Additional Chief Secretary (Finance), Gujarat 5 Shri. K Ramakrishna Rao, Principal Secretary (Finance), Telangana 6 Shri. A K K Meena, Principal Secretary (Finance), Odisha. Ministry of Finance, GoI 7 Shri. Suraj Kumar Pradhan, Joint Director, PF-S Division, DoE, MoF, GoI Reserve Bank of India 8 Shri. B P Kanungo, Deputy Governor 9 Smt .Malvika Sinha, Executive Director 10 Shri. T.K. Rajan, Chief General Manager, IDMD 11 Ms. Sangeeta Lalvani, General Manager, IDMD 12 Shri. Brijesh P, Director/ Convenor, IDMD 13 Shri. S. Suraj, Assistant Adviser, IDMD 14 Smt Sangita E, Assistant General Manager, IDMD 15 Shri. Ashish Gupta, Assistant General Manager/ Dealer, IDMD 16 Shri. Arvind Ekka, Manager/ Dealer, IDMD 17 Shri. Sourit Das, Research Officer, IDMD 18 Shri. Prashant Chandawat, Assistant Manager, IDMD Second meeting of the Advisory Committee was held on July 10, 2020 through video conference, in view of the then prevailing lock down conditions. Following officials participated in the meeting: Chairman & Members 1 Shri. Sudhir Shrivastava, Chairman 2 Shri. N R Bhanumurthy, Professor, NIPFP 3 Shri. Sanjiv Mittal, Additional Chief Secretary (Finance), Uttar Pradesh 4 Shri. Pankaj Joshi, Additional Chief Secretary (Finance), Gujarat 5 Shri. K Ramakrishna Rao, Principal Secretary (Finance), Telangana 6 Shri. A K K Meena, Principal Secretary (Finance), Odisha. 7 Shri. Samir Kumar Sinha, Principal Secretary (Finance), Assam Ministry of Finance, GoI 8 Shri. Suraj Kumar Pradhan, Joint Director, PF-S Division, DoE, MoF, GoI Reserve Bank of India 9 Shri. T.K. Rajan, Chief General Manager, IDMD 10 Shri. Brijesh P, Director/ Convenor, IDMD 11 Shri. Neeraj Kumar, Assistant Adviser, IDMD 12 Smt. Sangita E, Assistant General Manager, IDMD 13 Shri. Sourit Das, Research Officer, IDMD 14 Shri. Prashant Chandawat, Assistant Manager, IDMD Third meeting of the Advisory Committee was held on February 26, 2021 through video conference. Following officials participated in the meeting: Chairman/ Members & other Officials 1 Shri. Sudhir Shrivastava, Chairman 2 Shri. N R Bhanumurthy, Professor, NIPFP 3 Smt. S. Radha Chauhan, Additional Chief Secretary (Finance), Uttar Pradesh 4 Shri. Pankaj Joshi, Additional Chief Secretary (Finance), Gujarat 5 Shri. K Ramakrishna Rao, Principal Secretary (Finance), Telangana 6 Shri. A. K. K. Meena, Principal Secretary (Finance), Odisha 7 Shri. Samir Kumar Sinha, Principal Secretary (Finance), Assam 8 Shri. Neel Ratan Kumar, Special Secretary (Finance), Uttar Pradesh 9 Shri Alok Dixit, Special Secretary (Finance), Uttar Pradesh Ministry of Finance, GoI 10 Shri. Suraj Kumar Pradhan, Joint Director, PF-S Division, DoE, MoF, GoI Reserve Bank of India 11 Shri. R. Subramanian, Executive Director 12 Shri. R. Gurumurthy, Chief General Manager, IDMD 13 Shri. Deba Prasad Rath, Officer-in-charge, DEPR 14 Shri. Rajiv Ranjan, Adviser-in-charge, MPD 15 Smt. Latha Vishwanath, General Manager, IDMD 16 Shri. Indranil Bhattacharya, Director, MPD 17 Smt. Sangita Misra, Director, DEPR 18 Shri Brijesh P, Director/ Convenor, IDMD 19 Shri. Neeraj Kumar, Assistant Adviser, IDMD 20 Smt. Sangita E, Assistant General Manager, IDMD 21 Shri. Sourit Das, Research Officer, IDMD 22 Shri. Avinash Deo, Assistant Manager, IDMD
References 1.Allan, C., M. (1965). “FISCAL MARKSMANSHIP, 1951–1963”. Oxford Economic Papers, Volume 17, Issue 2, July 1965, Pages 317–327, https://doi.org/10.1093/oxfordjournals.oep.a040992. 2. Chakraborty, L., Chakraborty, P., and Shrestha, R. (2020). “Budget Credibility of Subnational Governments: Analysing the Fiscal Forecasting Errors of 28 States in India”. Levi Economics Institute of Bard College, Working Paper No. 964. 3.Department of Economic Affairs (2013). “Economic Survey 2012-13”. 4.Department of Economic Affairs (2019). “Economic Survey 2018-19”. 5.Finance Commission of India (2021). “Report of the Fifteenth Finance Commission”. Retrieved from https://fincomindia.nic.in/ShowContent.aspx?uid1=3 &uid2=0&uid3=0&uid4=0 6. Nithin, K., and Roy, R. (2014). “Finance Commission of India’s Assessment: A Political Economy Contention between Expectations and Outcomes.” Applied Economics 48(2): 73–88. 7.Pessoa, Mario and Mike Williams (2012), “Government Cash Management: Relationship between the Treasury and the Central Bank”, Fiscal Affairs Department, IMF Technical Notes and Manuals, November. 8. Reddy Y.V and Reddy G.R (2019), “Indian Fiscal Federalism” Oxford University Press. 9.Reserve Bank of India (2016). “Report of the Advisory Committee on Ways and Means Advances to State Governments” (Chairman: Shri Sumit Bose). March. 10. Reserve Bank of India (2015). “State Finances” A study of Budgets of 2014-15”. 11. Reserve Bank of India (2018). “State Finances” A study of Budgets of 2017-18 and 2018-19”. 12. Srinivasan, S. and Misra, P. (2020). “Grants from Centre and States’ Fiscal Marksmanship”. IDFC Institute Working Paper 05. 13. Williams, Mike (2010), “Government Cash Management Its Interaction with Other Financial Policies”, Fiscal Affairs Department, IMF Technical Notes and Manuals, July.
|