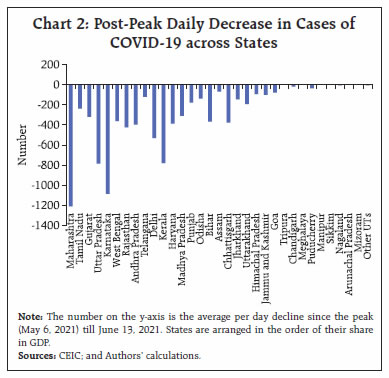
The Indian economy continues to wrestle with the second wave of the pandemic, though cautious optimism is returning. By current assessment, the second wave’s toll is mainly in terms of the hit to domestic demand. On the brighter side, several aspects of aggregate supply conditions - agriculture and contactless services are holding up, while industrial production and exports have surged amidst pandemic protocols. Going forward, the speed and scale of vaccination will shape the path of recovery. The economy has the resilience and the fundamentals to bounce back from the pandemic and unshackle itself from pre-existing cyclical and structural hindrances. Signs of the ebbing of the second wave of the pandemic are cautiously becoming evident. In fact, the data suggest that the second wave is rolling back almost as fast as it rolled in. On June 14, 2021 India’s daily cases fell to a seventh of their peak of 4,14,188 a month ago (May 6). The seven-day average, which smooths out daily fluctuations, also declined by a fifth from its peak of close to 4 lakhs. This is also reflected in the doubling rate1, which increased to 247 days from its trough of 34 days at the end of April (Chart 1). The daily positivity rate2, which had peaked at 22.7 per cent in early May, plummeted to 3.8 per cent, remaining below 10 per cent for the 14th consecutive day, and dipping even lower than the first wave’s peak of 11.7 per cent at end-August 2020. Recoveries outnumbered fresh cases for the 36th day, taking the total number of recoveries in India past 2.8 crore. This fortuitous configuration also prevails in 7 of the 12 states that had led the national infections trajectory at the outbreak3 of the second wave (Chart 2). Fatalities are undergoing revisions as states improve their reporting, but the slow pace of their reduction relative to infections is keeping the nation on edge. 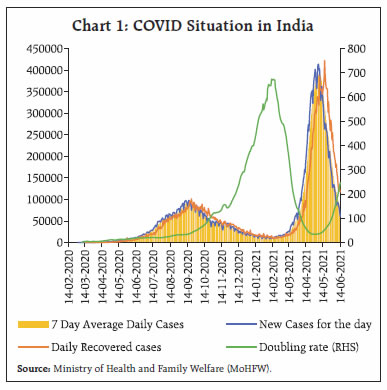
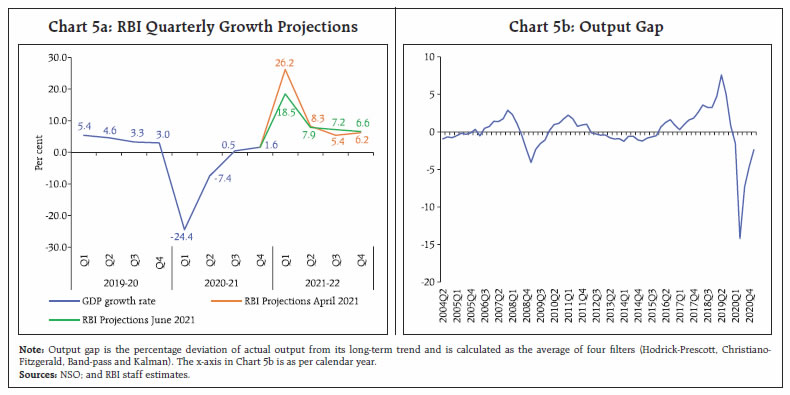
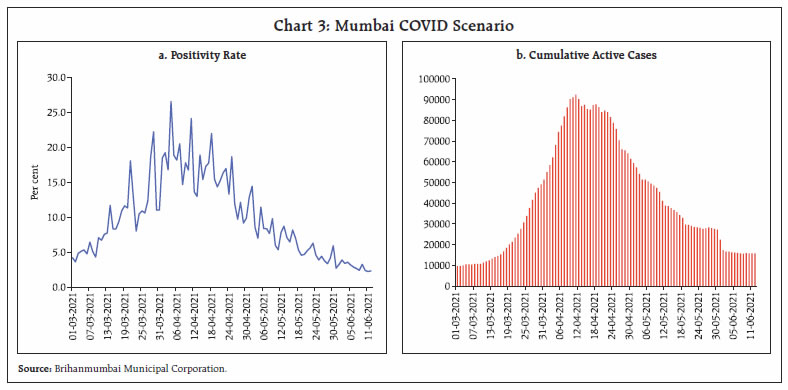 Mumbai, India’s financial capital and most densely populated city, has been battered by both waves of the pandemic and has, in fact, led each surge. But this time, the city pulled one back and emerged as an example of COVID management4 (Chart 3). It is based on five pillars: ward-level COVID command posts equipped with ambulances, doctors, telephone operators and basic infrastructure – the disaster control room, a solitary unit set up in the first wave, has been decentralised into these 24 command posts; contact tracing and medical aid sent to homes; integrated hospital bed management with maintenance of surplus medical capacity; oxygen management by building storage infrastructure, monitoring of cylinder refilling and hospital oxygen usage; and data-driven decision-making. Yet, forewarned is forearmed. Using historical data in mathematical and epidemiological models, scientists and virologists are debating predictions of a third wave, adding a war-room urgency to contingency planning. A variant detected in India, labelled ‘Delta” by the World Health Organization (WHO) and known by the scientific name B.1.617.2, is being regarded as highly transmissible and is categorised by it as a variant of concern (VOC). There is, therefore, no question of letting down the guard. India could see another wave, but it is assailable with a combination of social distancing, masking, ramping up of health infrastructure and most importantly, vaccination. In the context of the latter, prescient guidance on the way forward shines light amidst the encircling dark. The Ministry of Finance estimates that in order to achieve herd immunity and regain the momentum of the economic recovery, the target population to be vaccinated is 70 crore by September 2021 and around 113 crore more doses are needed; accordingly, around 93 lakh vaccinations are required per day to achieve the herd immunity. While the peak daily vaccination rate attained till date is 42.65 lakh, “doubling the shifts and possibly vaccinating 24x7 for a couple of months can enable the ambitious, but possible, throughput of 1 crore shots a day.” (GoI, May 20215). At a global level, the International Monetary Fund (IMF) has made a proposal to defeat the pandemic: (1) vaccinating at least 40 percent of the population in all countries by the end of 2021 and at least 60 per cent by the first half of 2022; (2) tracking and insuring against downside risks; and (3) ensuring widespread testing and tracing, maintaining adequate stocks of therapeutics, and enforcing public health measures in places where vaccine coverage is low (Chart 4). The benefits of such measures at about US$ 9 trillion far outweigh the costs, which are estimated to be around US$ 50 billion – of which US$35 billion should be paid by grants from donors and the residual by national governments potentially with the support of concessional financing from bilateral and multilateral agencies. The strategy requires global cooperation to secure upfront financing, upfront vaccine donations, and at-risk investment to insure against downside risks for the world (IMF, 20216). The G7’s pledge to ‘vaccinate the world’ imparts traction to these calculations. On May 31, the National Statistical Office (NSO) revised India’s real GDP for 2020-21, revealing a shallower contraction (-7.3 per cent) than earlier estimated, with the brighter outcome for the fourth quarter (January-March 2021) turning out to be the decisive swing factor. Private consumption emerged out of three successive quarters of contraction as pent-up demand was released with progressive unlocking after the first wave. Government spending surged back to save the blushes – excluding it, the growth of 1.6 per cent in the fourth quarter would have been reversed into a decline of 1.1 per cent and for the year as whole, there would have been a contraction of 8.5 per cent. Some of the public spending was also reflected in fixed capital formation. For 2021-22, the Reserve Bank has projected real GDP growth of 9.5 per cent on the assumption that the impact of the second wave will be contained in the first quarter of the year in which strong base effects from last year’s precipitous contraction will come into play. Real GDP may hence grow by 18.5 per cent in the first quarter, slowing to 7.9 per cent in the second quarter, 7.2 per cent in the third quarter and 6.6 per cent in the last quarter of the year as base effects slowly wane (Chart 5a). The impact of the second wave is hence estimated at about ₹2 lakh crore of lost 2021-22 output. By current assessment, the second wave’s toll is mainly in terms of the hit to domestic demand on account of regional and specific containment rather than a nation-wide lockdown. Moreover, this wave has fanned into smaller cities and villages, sapping rural demand. The support from government spending may also moderate from the extraordinary expansion undertaken last year. On the brighter side, several aspects of aggregate supply conditions such as agriculture and contactless services are holding up amidst pandemic protocols. Industrial production and exports have surged on strong base effects, but there is also evidence of positive momentum. At the cost of reiteration, it is vaccination which will shape the recovery. The economy has the resilience and the fundamentals to bounce back from the pandemic and unshackle itself from pre-existing cyclical and structural hindrances that have caused its trajectory of output to deviate from potential into a negative output gap since 2019-20Q4 (Chart 5b). 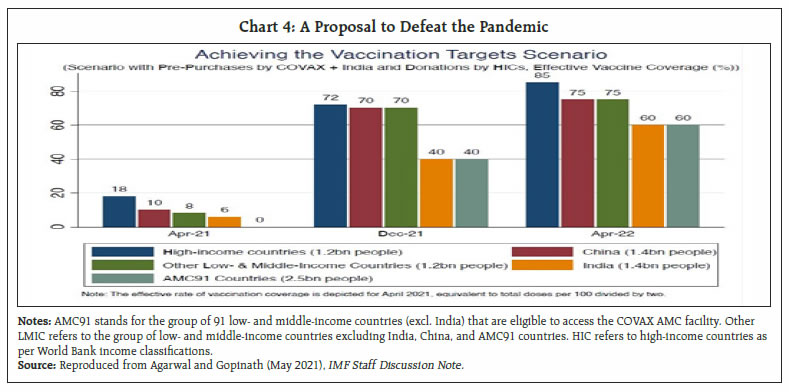
 Meanwhile, the Reserve Bank set about crafting and putting in place filaments of the financial safety net for the economy that was alluded to in last month’s article, pursuing its commitment to keep finance flowing through a panoply of channels in order to ease financial conditions further. As Governor Shri Shaktikanta Das pointed out, “With the second wave intensifying this financial year, the focus of the Reserve Bank is increasingly turning from systemic liquidity to its equitable distribution. In fact, the enduring lesson from the experience of the pandemic in the Indian context has been the deployment of unconventional monetary policy measures that distribute liquidity among all stakeholders…We shall continue with our proactive and pre-emptive approach, relying on market-based channels of transmission as we strive to mitigate the toll of the pandemic and return the economy to a path of high and durable growth….We will continue to think and act out of the box, planning for the worst and hoping for the best…..The need of the hour is not to be overwhelmed by the current situation, but to collectively overcome it.” On June 4, drawing on the decision of the monetary policy committee (MPC) to continue maintaining the policy rate at its all-time low of 4 per cent (unchanged since May 2020) and also to continue with an accommodative stance as long as necessary, the Reserve Bank announced another large purchase operation in June to complete its asset purchase initiative G-SAP 1.0. Of the quantum of ₹40,000 crore that was announced, ₹10,000 crore was reserved for state development loans (SDLs) with a view to compressing their spreads over corresponding central government securities. This, in turn, would work towards improving the appetite for ultra-long central government securities vis-à-vis SDLs, with the yields of the former becoming relatively attractive for buy-to-hold investors. A G-SAP 2.0 of ₹1.2 lakh crore was also announced for Q2:2021-22, coinciding with the peaking of volume of issuances planned for the year. It was also stressed that open market and forex operations other than the G-SAPs would continue, having conducted such operations of ₹37,955 crore already in the current financial year up to June 4. These measures will relieve market pressures, improve investor demand and help to place the government’s borrowing in the market at minimum costs and rollover risk (Chart 6). Expanding the financial safety net further, the Reserve Bank also announced a liquidity window of ₹15,000 crore to be made available on tap for fresh bank lending of up to 3 years tenor at the repo rate for services adversely impacted by the pandemic such as hotels and restaurants, tourism, aviation ancillary services and other contact-intensive services. As an incentive, banks can park amounts equivalent to their loan book under the window as fixed rate reverse repo with the Reserve Bank and earn 3.75 per cent as against the rate of 3.35 per cent offered under the liquidity adjustment facility (LAF). A special liquidity facility of ₹16,000 crore at the policy repo rate was extended to the Small Industries Development Bank of India (SIDBI) for on-lending to micro, small and medium enterprises (MSMEs), particularly smaller MSMEs and other businesses, including those in credit deficient and aspirational districts. The coverage of Resolution Framework 2.0 announced on May 5, 2021 for resolution of COVID-19 related stress among micro, small and medium enterprises (MSMEs) as well as non-MSME small businesses and individuals (for business purposes) was expanded by enhancing the maximum aggregate exposure threshold from ₹25 crore to ₹50 crore. Alongside, doing business was eased further by (i) allowing authorised dealer banks to place margins on behalf of their foreign portfolio investor clients for transactions in government securities; (ii) allowing regional rural banks to issue certificates of deposit (CDs) and all issuers of CDs to buy them back before maturity; and (iii) enabling the National Automated Clearing House (NACH), a bulk payment system that facilitates one-to-many and many-to-one credit transfers and collections as well as direct benefit transfers, to be made available on all days of the week. Thus, the Reserve Bank remains engaged in safeguarding the economy and its financial system, maintaining financial stability and congenial financing conditions for all stakeholders (Tables 1a and 1b). 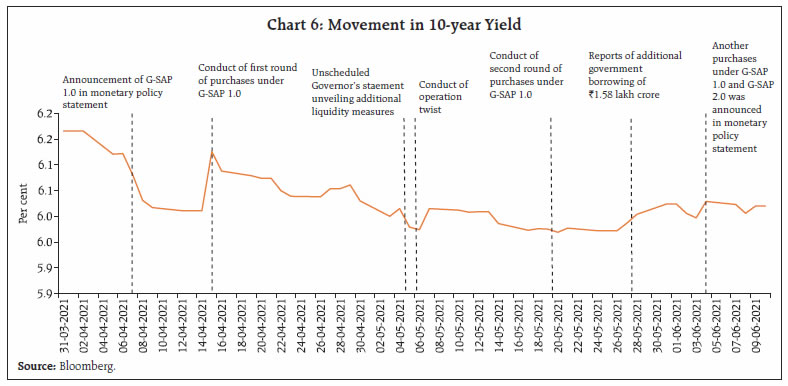 On May 27, the Reserve Bank released its Annual Report for the year 2020-21. Its candid and sobering messages went down as unbiased and professional7. In the assessment of the Reserve Bank, the pandemic produced a fusion of a broad-based aggregate demand shock and a lockdown-induced supply shock and delivered many lessons. It showed us how globalised we are, not only in our vulnerability to viral infections but also in the manner in which vaccines are produced and shared. A virtuous combination of public and private investment can ignite a shift towards investment and thereby to a trajectory of sustained growth. A collective global effort to fight the pandemic will surely bring better results than individual countries fighting on their own. The G20 goal of strong, sustainable and inclusive growth may yet be in sight and within reach. | Table 1a: Liquidity Measures since February 6, 2020 (Up to March 31, 2021) | | (₹ crore) | | Measures Announced | Announced amount | Availed amount | | LTRO | 2,00,000 | 1,25,117 | | Variable rate repo | 2,25,000 | 90,017 | | SLF for PDs | 7,200 | 6,000* | | CRR cut | 1,37,000 | 1,37,000 | | MSF (dip by additional 1% in SLR) | 1,37,000 | NIL# | | TLTRO | 1,00,000 | 1,00,050 | | TLTRO (2.0) | 50,000 | 12,850 | | Net OMO purchases | 1,50,000 | 3,56,265 | | Special Liquidity Facility for Mutual Funds | 50,000 | 2,430 | | Refinance to AIFIs (NABARD, SIDBI, NHB and EXIM Bank) | 75,000 | 48,514* | | Special liquidity scheme for NBFCs | 30,000 | 7,126 | | 56-day term repo | 1,00,000 | 1,000 | | On Tap TLTRO | 1,00,000 | 5,000 | | Total | 13,61,200 | 8,91,369 | | As per cent of nominal GDP for 2020-21 | 6.9 | 4.5 | Note: #: The MSF relaxation was announced on March 27, 2020. Banks, however, did not dip into their SLR holding below the originally permitted 2% of NDTL for borrowing under the MSF window, during the period.
*: Maximum during the period.
Source: RBI. | An aspect of the Annual Report that has raised considerable heat and dust in the media is the surplus transferred to the government. Mainly stemming from saving on balance sheet provisions and employees’ superannuation and other funds, the surplus constitutes just 0.44 per cent of GDP (which is taken as a measure of seigniorage8). In this context, it is worthwhile to note the findings of comprehensive research on central banking in developing countries (Fry, Goodhart and Almeida, 1996): “In flow terms, we can think of the central bank as the government’s golden goose. With an unimpaired balance sheet: -
The free-range goose conducting conservative monetary policy with a fair degree of independence produces golden eggs in the form of seigniorage worth 0.5 to 1 per cent of GDP; -
The battery farm goose, bred specially for intensive egg-laying, can produce golden eggs in the form of an inflation tax yielding 5 to 10 per cent of GDP; -
The force-fed goose can produce revenue of up to 25 per cent of GDP for a limited period before the inevitable demise of the goose and collapse of the economy. | Table 1b: Liquidity Measures during 2021-22 so far (Up to June 7) | | (₹ crore) | | Measures Announced | Announced amount | Availed amount | | G-SAP+ Regular OMOs through NDS-OM | 2,20,000 | 97,955* | | Liquidity Facility for AIFIs | 66,000 | Nil | | Special Long-Term Repo Operations (SLTRO) for Small Finance Banks (SFBs) | 10,000 | 400 | | Term Liquidity Facility to Ease Access to Emergency Health Services | 50,000 | Nil | | On-tap Liquidity Window for Contact-intensive sectors | 15,000 | Nil | | Total | 3,61,000 | 98,355 | | As per cent of nominal GDP for 2020-21 | 1.8 | 0.5 | Note: *: Up to June 4, 2021
Source: RBI. | All three forms of central bank geese have been sighted in recent years.” From the point of the surplus transfer alone, therefore, the Reserve Bank can be characterised as ‘free-ranging’ and conducting independent monetary policy, i.e., independent of fiscal dominance (Table 2). Another landmark that was quietly passed in early June was the level of foreign exchange reserves crossing US$ 600 billion. With this development, India is the 5th largest reserve holding country in the world9, the 12th largest foreign holder of US treasury securities10 and the 10th largest in terms of gold reserves. While foreign exchange reserves provide cushions against unforeseen external shocks, levels are often deceptive, and a better gauge of external vulnerability is an assessment of specific indicators. In terms of projected imports for 2021-22, the current level of reserves provides cover for less than 15 months, which is lower than for other major reserve holders – Switzerland (39 months); Japan (22 months); Russia (20 months); and China (16 months)11. Furthermore, India’s reserves co-exist with a net international investment position of (-) 12.9 per cent of GDP (Table 3). These factors warrant a pragmatic assessment of reserve adequacy on FX reserves, including exposure to valuation changes and market risk in a world of heightened global uncertainty. | Table 2: Transfer of Surplus from Central Banks to Governments* | | (as a per cent of GDP) | | Country | 2020 | | Singapore | 1.13 | | Russia | 1.00 | | Turkey | 0.78 | | India | 0.29 | | US | 0.26 | | Malaysia | 0.25 | | Japan | 0.23 | | Indonesia | 0.22 | | Korea | 0.19 | | Germany | 0.18 | | France | 0.15 | | Australia | 0.13 | | Sweden | 0.11 | | Kenya | 0.07 | | South Africa | 0.01 | | UK | 0.00 | | Mexico | 0.00 | | Country | 2021 | | Turkey | 0.50 | | India | 0.44 | | Malaysia | 0.26 | | Sweden | 0.13 | | Kenya | 0.04 | | Germany | 0.00 | | Mexico | 0.00 | | Czech Republic | 0.00 | *: Provisional figures of surplus transferred based on the year of publication of annual report since different central banks follow different accounting years for their financial statements, estimates are based on World Economic Outlook (WEO) GDP numbers;
#: Transfer of Part of the Income Received by the Central Bank of the Russian Federation from the Sale of Ordinary Shares of Public Joint-stock Company Sberbank of Russia.
Sources: Central Bank Annual Reports; newspaper reports; and WEO database. |
| Table 3: External Vulnerability Indicators for India | | Indicator | External Debt (US$ billion) | External Debt to GDP ratio (%) | Reserves to Total Debt (%) | Short-term Debt (RM) to Total Debt (%) | Short-term Debt (RM) to Reserves (%) | Reserves to Short-term Debt (RM) (%) | Reserves Cover of Imports
(in months) | Debt Service Ratio (%) | Net IIP/ GDP ratio (%) | | End-Dec. 2020* | 563.5 | 21.4 | 104.0 (107.4) | 44.8 | 43.1 (41.7) | 232.0 (239.6) | 18.6 (19.3) | 9.0 | -12.9 | Note: * Figures in brackets are based on FX reserves as on June 4, 2021.
RM: Residual Maturity. IIP: International Investment Position.
Source: RBI. | Rest of the article is structured into four sections. Section II succinctly outlines the current economic developments globally. The recent unfolding of the events in the domestic economy have been summarised in section III. Section IV examines the financial conditions and the last section concludes the article. II. Global Setting Global economic recovery is gaining traction, though simultaneously the multi-speed characteristic of the recovery is becoming stark. The state of the global economy is mixed, we are in a much better place than we thought we would be a year ago (Carstens, 2021), but the recovery is uneven and incomplete and, in fact, three distinct recoveries are underway – the US and China with rapidly declining effects of the pandemic; European countries with growth prospects remaining favourable for 2021 despite some early hiccups; and emerging market economies (EMEs) with varied growth prospects but a relatively less positive overall outlook because of resurgence in infections and slow progress on vaccination. In its latest Economic Outlook released on May 31, 2021, the Organisation for Economic Co-operation and Development (OECD) has revised up the global growth forecast for 2021 to 5.8 per cent (Table 4). It cautions that the growth would significantly rely on policy support and public health measures. It is estimated that world income in real terms by end- 2022 would be about US$3 trillion less than in a no pandemic scenario, with growing inequality among nations. In its June 2021 Global Economic Prospects, the World Bank has also revised upwards its forecast of global growth to 5.7 per cent this year. It notes the recovery is led by a few major advanced economies (AEs), while most EMEs are far behind. By 2022, global GDP would be 1.8 per cent lower than the pre-pandemic projections. The global composite purchasing managers’ index (PMI) rose to its highest level in May 2021 in over fifteen years. The PMI for services was at a 181-month high and was higher than the manufacturing PMI for the second successive month (Chart 7). World trade is strengthening further: the latest reading as of May 2021 of the Global Trade Barometer compiled by the World Trade Organization (WTO) at 109.7 is almost 10 points higher than the baseline of 100 and about 22 points higher than a year ago. After having reached the pre-pandemic levels by end-2020, world trade and industrial production grew (q-o-q) by 3.5 per cent and 2.7 per cent, respectively in Q1:2021 (Chart 8). Shipping costs continue to spiral, the Baltic Dry Index surged to its highest level in more than a decade as supply disruptions continue to co-exist with the bounce back in demand.
Global economic uncertainty is on the wane owing to vaccine rollouts and gradual re-opening of the economies. This augurs well for the global economic environment (Chart 9).
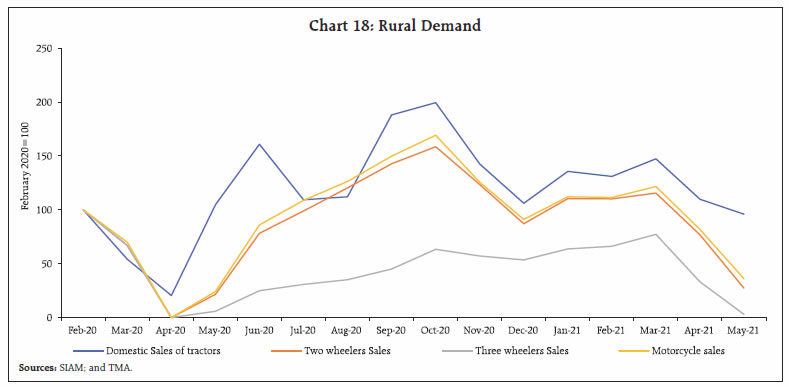
On the back of softening of US Treasury yields, gold has seen renewed demand, boosted also by its appeal as a hedge for inflation. The gains in May were the highest monthly increase since last July. With consolidation in June (up to June 11), the yellow metal is again in the red on year-to-date basis (Chart 10a). Crude oil prices have traded in a tight range in the past two months, though with a firming bias with resurgence in demand and gradual lifting of travel restrictions (Chart 10b). The Bloomberg Commodity Index, which tracks prices of 23 raw materials, has been hitting decadal highs on many occasions in the past two months, with the latest being on June 10 (Chart 10c). In the financial markets, stock markets remained frothy. Most stock markets declined in the first half of May as infections and mortalities climbed up in large parts of Asia and other countries. Thereafter, with better economic outcomes and the gathering pace of vaccination, the markets have been rising (Chart 11a). The US S&P index scaled a fresh peak on June 11. Long-term US Treasury yields have continued to soften with occasional blips on uncertainty surrounding the stance of monetary policy and tapering of asset purchases (Chart 11b). Yields in other countries, including a few EMEs, have softened concurrently. In the currency markets, the US dollar continued to dip as treasury yields softened. All the gains that had accrued in Q1:2021 were wiped out by end-May, with some claw back in June so far (up to June 11). The Morgan Stanley Capital International (MSCI) Emerging Markets currency index hit its all-time high in the second week of May and hit further peaks on ten trading days since May 25, 2021, closing at a high of 1755.59 on June 11, 2021 (Charts 11c and 11d). In Q2:2021 so far (up to June 11), the sharpest appreciations were observed in Brazil and South Africa, which are commodity exporters. In an environment of risk-on sentiments and high commodity prices, these EME currencies have strengthened notwithstanding recent resurgence of infections in the countries (Chart 11e). According to the Institute of International Finance (IIF), portfolio flows to EMEs in May were only about one-fourth of that in April (Chart 11f). Total EME portfolio flows were US$ 13.8 billion in May, with debt flows accounting for the lion’s share just as in April. Excluding China, there was a net outflow from equities in most other EMEs in May. While several EMEs are experiencing inflation at or above targets, there has been swift pick-up in inflation in AEs too in recent months. The US consumer price index (CPI) inflation in May was an almost 13-year high of 5.0 per cent. The Euro area notched up inflation of 2 per cent in May, the upper limit of its inflation target. Similarly, inflation is now in striking distance of the target in most other AEs barring Japan. Iceland became the first AE central bank to raise rates since the pandemic’s outbreak. The central bank of Iceland raised its policy rate by 25 basis points (bps) in May on inflation concerns. In June, Bank of Russia raised its key rate for the third consecutive time by a magnitude of 50 bps, with a total hike of 125 bps since March. As a significant step towards reforming the global tax system, the G7 group of countries agreed on June 5, on the principle of a global minimum corporation tax on large firms of at least 15 per cent; paving the way for a broader agreement among G-20 in July. By ensuring that large multinationals pay tax in the country of actual operation, the Agreement seeks to disincentivise large multinationals shifting profits to low tax jurisdictions. The success of the deal, however, hinges on widespread acceptance. Looking ahead, even as growth seems set to revive contingent on continued policy support and speedy and widespread vaccination, inflation merits close watching. With commodity prices rising, the uncertainty surrounding the inflation outlook, poses risks to the recovery and spillover risks to financial markets, especially those of EMEs. III. Domestic Developments The Indian economy continues to wrestle with the second wave of the pandemic, though cautious optimism is returning, with greater improvement expected by early July, as predicted by statistical/ mathematical models12. The first sign of a peak, coming as it did in mid-May, is in sync with these forecasts. The provisional estimates (PE) of annual national income by the National Statistical Office (NSO) on May 31 revised upward India’s real GDP growth by 0.7 percentage points from the second advance estimates to a lower contraction of 7.3 per cent in 2020-21. The most promising print was the double-digit growth recorded in gross fixed capital formation (GFCF), aided by government’s push to infrastructure (Chart 12). Furthermore, the saving behaviour of households during the second wave could throw some light on normalisation of consumption going forward (Annex Box 1). The impact of the second wave on the economy was exacerbated in May 2021 with many states opting for localised lockdowns. These restrictions impeded public mobility all around as mirrored in the Google and Apple mobility indicators, though the dip in movement showed signs of bottoming out in the last week of May (Chart 13a and 3b). Like mobility indicators, electricity generation readings too bottomed out, with supply recovering towards the last week of May (Chart 13c). Aggregate Demand Aggregate demand conditions grappled with lockdown like restrictions in several parts of the country. GST E-way bills moderated for the second consecutive month in May 2021, reaching a one-year low. Normalised to pre-pandemic February 2020 level, E-way bills plummeted to levels last seen prior to June 2020. Intra-state E-way bills fared better than inter-state e-way bills, presumably due to inter-State restrictions (Chart 14). Sequentially, E-way bills plunged by 32.0 per cent, and compared to May 2019 they contracted by 26.3 per cent. This may indicate further moderation in GST collections going forward. 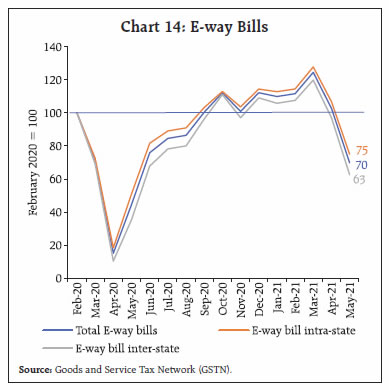 GST legislation protected the revenues of states during the transition period of five years (2017-18 to 2021-22) with an annual growth of 14 per cent per annum over the 2015-16 revenue base. Any shortfall was to be funded through additional tax (compensation cess) on sin/luxury goods. In the four years since GST implementation, compensation cess collections were sufficient for the Centre to cover the shortfall in GST collections of state governments over 2017-18 and 2018-19; however, in 2019-20 and 2020-21 there was a gap (Chart 15)13. Going forward, notwithstanding the second wave, GST collections in 2021-22 (so far) have fared better than in 2020-21, infusing optimism that the revenue base for states will be protected with a growth rate of 7 per cent14, and it may result in some surplus to compensate for the shortfall in the previous year. The gross GST revenue collected in the month of May 2021 was ₹1,02,709 crore, which is 65 per cent higher than the GST revenues in the same month last year. 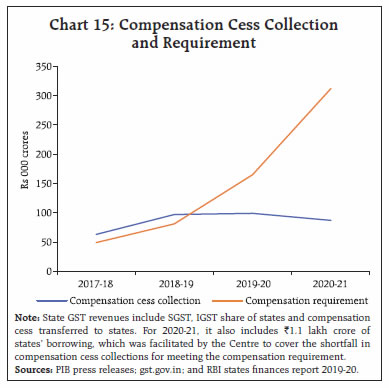 Provisional accounts (PA) of the Union Government for 2020-21 place the GFD at 9.2 per cent of GDP as against the revised estimate (RE) of 9.5 per cent (Table 5). This improvement emanated from higher receipts, led by gross tax revenue at ₹20.2 lakh crore, partially offset by higher revenue expenditure, primarily on account of on-budgeting of subsidies. As a proactive move, instead of the original plan to clear out Food Corporation of India’s (FCI) debt to the National Small Savings Fund (NSSF) phase-wise over a few years, all outstanding dues were cleared in one swoop in March 2021. | Table 5: Key Fiscal Indicators (Per cent of GDP) | | | 2019-20 | 2020-21 | 2021-22 | | Actuals | BE | RE | PA | BE | | 1 | 2 | 3 | 4 | 5 | 6 | | 1. Fiscal Deficit | 4.6 | 3.5 | 9.5 | 9.2 | 6.8 | | 2. Revenue Deficit | 3.3 | 2.7 | 7.5 | 7.4 | 5.1 | | 3. Primary Deficit | 1.6 | 0.4 | 5.9 | 5.8 | 3.1 | | 4. Gross Tax Revenue | 9.9 | 10.8 | 9.8 | 10.3 | 9.9 | | 5. Non-Tax Revenue | 1.6 | 1.7 | 1.1 | 1.1 | 1.1 | | 6. Revenue Expenditure | 11.6 | 11.7 | 15.5 | 15.6 | 13.1 | | 7. Capital Expenditure | 1.6 | 1.8 | 2.3 | 2.2 | 2.5 | | Sources: Union Budget Documents; and Controller General of Accounts (CGA) | The total fiscal slippage during the year from Budget Estimates (BE) to PA amounts to 568 basis points (bps), of which 280 bps is from shortfall in receipts, 238 bps due to excess expenditure (including 208 bps because of higher food subsidy) and 49 bps due to the denominator effect of lower GDP vis-à-vis BE (Chart 16). Going forward, the settlement of all FCI dues to NSSF in 2020-21 itself and the higher surplus transfer by the Reserve Bank will open up additional fiscal space of around 45-50 bps in 2021-22. As per the recent round of the quarterly survey of the Federation of Indian Chambers of Commerce and Industry (FICCI), business confidence of Indian companies slumped during May to its lowest level in the last three quarters after hitting a decadal high in the previous round of the survey (Mint, June 1). Consumer goods companies are witnessing a slowdown in discretionary purchases such as large appliances, apparel and beauty products in the June quarter (Mint, May 18). Retail sales of motor vehicles plunged by 55.0 per cent in May 2021 over April 2021, with transport vehicles declining by 68.1 per cent and non-transport vehicles by 54.0 per cent, as per Vahan Dashboard. Contraction in registrations was recorded across all major states (Chart 17). With the second wave making inroads into villages and small towns, rural demand has also taken a hit, as indicated by moderation in sales of tractor, two-wheeler, motorcycle and three-wheeler vehicles (Chart 18). A silver lining is that the Indian Railways loaded 114 million tonnes of freight in May, the highest ever handled for this month and 2 per cent higher than a month ago15. Railway freight revenue remained robust, registering sequential growth by 2.9 per cent, as well as over pre-pandemic May 2019, by 9.5 per cent. Sequential improvement was recorded across all categories of traffic, led by fertilisers and food-grains, which grew by 47.4 per cent and 60.6 per cent m-o-m, respectively (Chart 19). 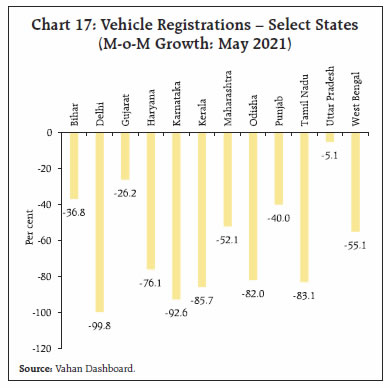
 The civil aviation sector, crippled under the weight of the second wave, suffered significant contraction in FY 2020:21, with the passenger segment plummeting by 66.2 per cent (domestic passenger segment by -61.7 per cent and international passenger segment by -84.8 per cent); however the fall in cargo segment was relatively less pronounced, i.e., by 25.7 per cent (domestic cargo segment by - 28.2 per cent and international cargo segment by -24.1 per cent) (Chart 20). Considered one of the worst hit sectors by the pandemic, the government extended the Emergency Credit Line Guarantee Scheme (ECLGS) to the sector to help mitigate hardships.
As per the household survey of the Centre for Monitoring Indian Economy (CMIE), the unemployment rate, rose to 11.9 per cent in May 2021, highest since May 2020. The labour participation rate, however, remained at 40 per cent in May 2021 equivalent to April 2021 (Chart 21). Labour market weekly indicators that started waning since the first week of April 2021, have started recovering in the second week of June 2021. The unemployment rate in the week ended June 13, 2021 was 8.7 per cent down from 13.6 per cent in the previous week. The employment rate (worker population ratio) that fell to 33.9 per cent in the week ended June 6, 2021 is up to 36.3 per cent in the week ended June 13, 2021 (Chart 22).
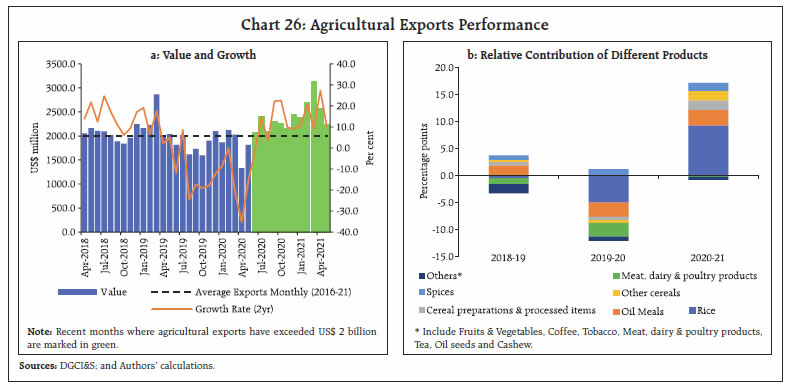
India’s merchandise exports continued on the robust growth path in May 202116, growing by more than 50 per cent (y-o-y) partly reflecting a low base (Chart 23a and 23b). Non-oil exports exhibited positive momentum for the ninth consecutive month. When compared to May 2019 also, exports have grown in May 2021. The major sectors that have grown as compared to May 2019 include engineering goods, petroleum products, iron ore, cotton textiles and drugs and pharmaceuticals (Chart 24). Engineering goods, accounting for nearly one-fourth of India’s total exports, were massively impacted due to demand / supply disruptions caused by the pandemic. This segment has bounced back, staging a smart recovery in recent months, surpassing pre-pandemic levels (Chart 25). Since June 2020, agricultural exports have endured the pandemic and shown resilience by staying consistently above the US$ 2 billion mark on a monthly basis (Chart 26a and 26b). High global demand, coupled with the expectation of subdued global wheat and rice output, should help sustain the demand for these Indian exports in the near future.
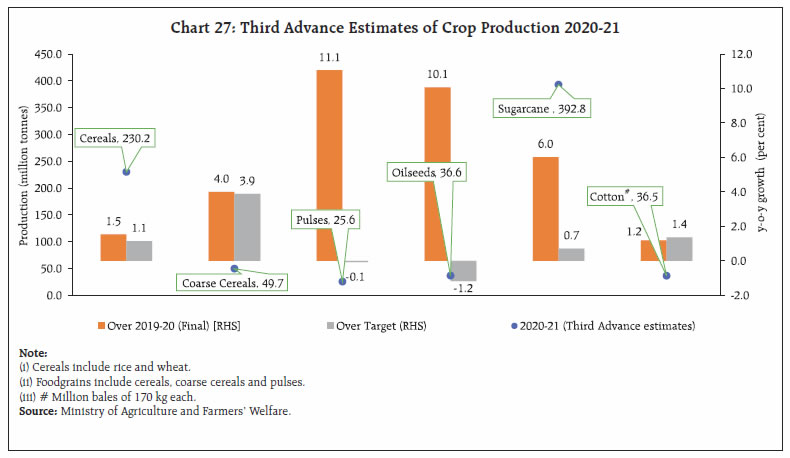
India’s merchandise imports too posted a growth of more than 50 per cent in May 2021 due to a low base a year ago (Chart 23a). As compared to the lockdown a year ago, the recent restrictions have had a limited impact on import demand. Aggregate Supply Agriculture continues to be the mainstay of aggregate supply conditions in India. The third advance estimates (AE) for 2020-21 released on May 25, 2021 placed agriculture production at 305.4 million tonnes, up by 2.7 per cent over a year ago and by 1.5 per cent above the target (Chart 27). Food grains, coarse cereals, pulses, oilseeds and cotton have posted record production. Wheat procurement has touched record levels for the second year in a row, staying 12.2 per cent higher than a year ago (June 10, 2021). Both wheat and rice procurement have already surpassed last year’s levels by 4.2 per cent and 12.1 per cent, respectively. 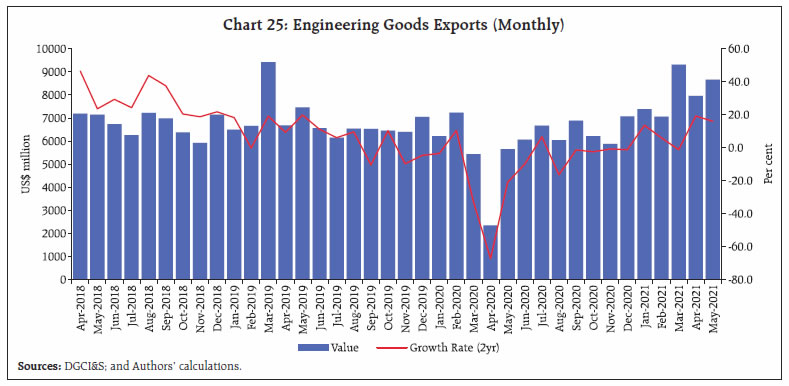
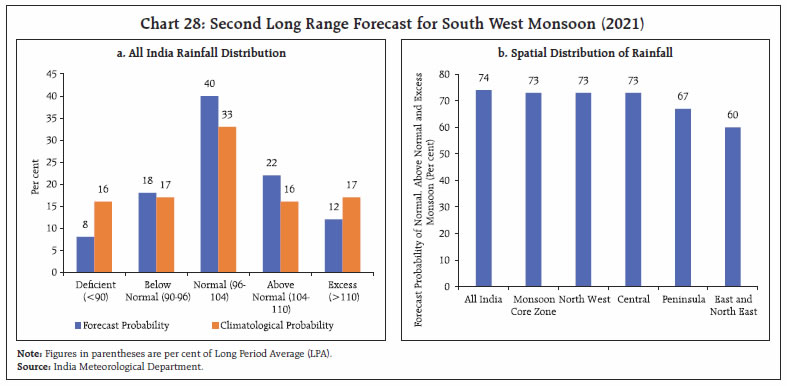 The forecast released by the Indian Meteorological Department (IMD) on June 01, 2021 indicates that 74 per cent of the country is expected to receive normal, above normal or excess rains (Chart 28a). As of June 10, 2021, aggregate rainfall stood at 23 per cent higher than its long period average (LPA) and reservoir level at 27 per cent of full capacity as against the decadal average of 21 per cent, which augurs well for the agriculture production. As regards policy support, increase in minimum support prices (MSP) announced for kharif season 2021-22 has ensured a return of at least 50 per cent over the cost of production for all the crops (Chart 29). The target for foodgrain production for the year 2021-22 is set at 307 million tonnes (0.5 per cent higher than 3rd AE of the previous year). Sowing of kharif pulses and oilseeds is expected to increase this year followed by the announcement of higher MSP and expectation of higher procurement through government procurement Schemes (PM-AASHA). 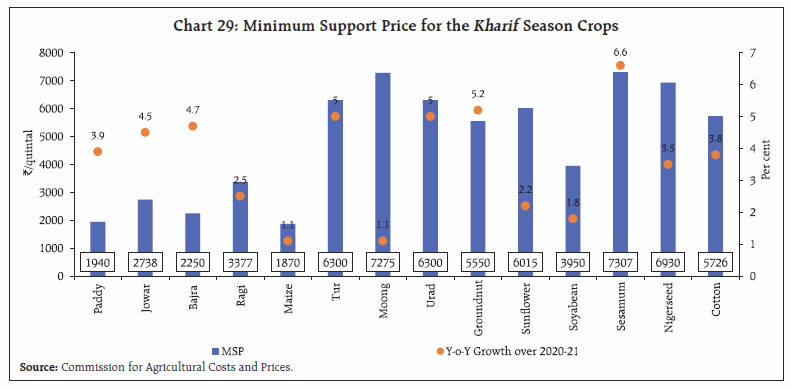
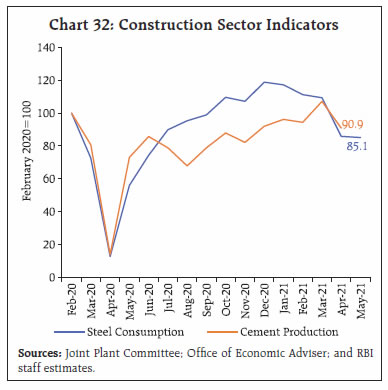
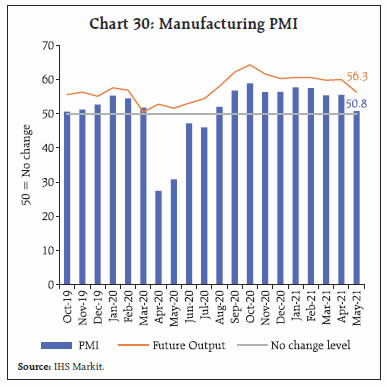 The headline PMI manufacturing slumped to a ten-month low in May 2021. With a reading of 50.8, however, it still remained in expansion zone even after marking a steep decline from 55.5 a month ago. The contraction stemmed mainly from sub-indices of new orders and output, as headwinds of the second wave brought demand to a virtual standstill (Chart 30). The services PMI in May 2021 contracted for the first time in eight months registering a value of 46.4. Contraction in exports and new businesses were the major reasons for the decline in services, mainly due to COVID related restrictions (Chart 31). The construction sector also recorded a decline in April-May 2021 as localised restrictions prompted decline in construction activity. Although robust y-o-y growth rates were recorded for cement production and steel consumption in April and May 2021, respectively, on a low base, the sectors recorded a steep decline in comparison to the same months in pre-pandemic 2019 (Chart 32). 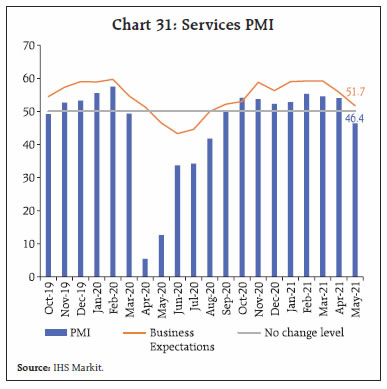
 Despite the second wave of COVID-19 induced lockdowns, highway construction, which touched an all-time high of 13,298 km in 2020-21 (36.4 km/day) (Financial Express, June 10), increased y-o-y, by 73.5 per cent in April-May 2021 on a low base. Over 2019 (28.2 km/ day), the performance in 2021 (24.1 km/ day) remains creditable. As per Crisil report, national highways sector which delivered a stellar performance last fiscal, riding on higher project awards, record construction, and traffic, may have its momentum dampened by the second wave of infections, but it may not have a material bearing on growth for the current fiscal. Inflation In May 202118, CPI inflation printed at 6.3 per cent, registered an increase of 2.1 percentage points over 4.2 per cent in April 2021 (Chart 33a). A large positive price momentum (month-on-month change in prices in the current month) cutting across food, fuel and core categories, along with an unfavourable base effect (month-on-month change in prices a year ago) brought about the jump in headline inflation. Among CPI groups, CPI food and beverages inflation increased to 5.2 per cent in May, an increase by 2.6 percentage points over April. Inflation in eggs, milk, oils and fats, fruits, pulses, spices and prepared meals edged up in May while deflation in vegetables, cereals and sugar ebbed. In the food sub-groups, only meat and fish registered a softening of inflation. The contribution of food (with a weight of 45.9 per cent in the CPI) to overall inflation increased to 39 per cent in May from 29 per cent in April (Chart 33b). Fuel inflation rose sharply into double digits – by 3.6 percentage points – to 11.6 per cent in May. CPI excluding food and fuel inflation surged to 6.6 per cent in May, the highest print since May 2014. All core sub-groups registered a pick-up in inflation, with substantial increases in clothing and footwear, household goods and services, transport and communication, recreation and amusement, and personal care and effects. 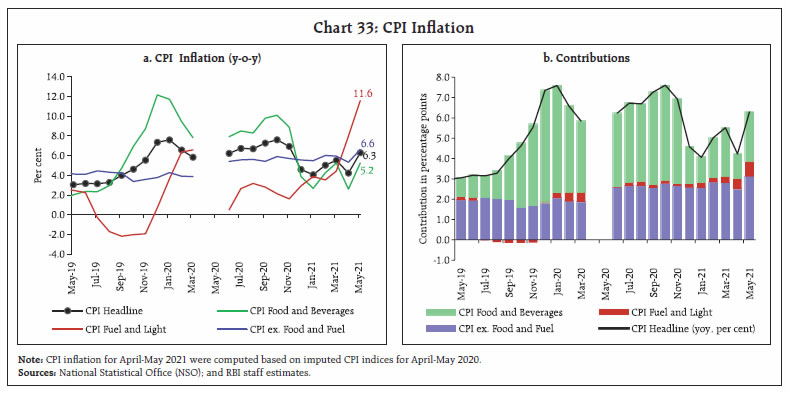 High frequency food price data from the Ministry of Consumer Affairs, Food and Public Distribution (Department of Consumer Affairs) indicate a further softening of cereals prices in the first half of June. Under pulses, prices of tur, urad and moong have also registered some softening in June so far, though prices remain higher than a year ago. Edible oils prices have increased further in June. Among the key vegetables, prices of potatoes, onions and tomatoes have edged up, though prices of potatoes and tomatoes are still lower than at this time last year (Chart 34). The increase in domestic pump prices of petrol and diesel since early May 2021 continued unabated in June so far (June 1-14, 2021), scaling new historic highs. Between May 31, 2021 and June 14, 2021 petrol and diesel pump prices (average of prices in four major metros) increased by ₹2.08 per litre and ₹2.13 per litre to ₹98.26 per litre and ₹91.01 per litre, respectively. In June so far, domestic kerosene prices registered a sharp increase whereas LPG prices remained steady (Table 6). Input costs across manufacturing and services rose further in May 2021, as reflected in the PMIs, although the rate of increase was the lowest in the last four months. Selling prices for services remained largely steady in May 2021, with evidence of a relatively higher pass-through of costs in manufacturing. 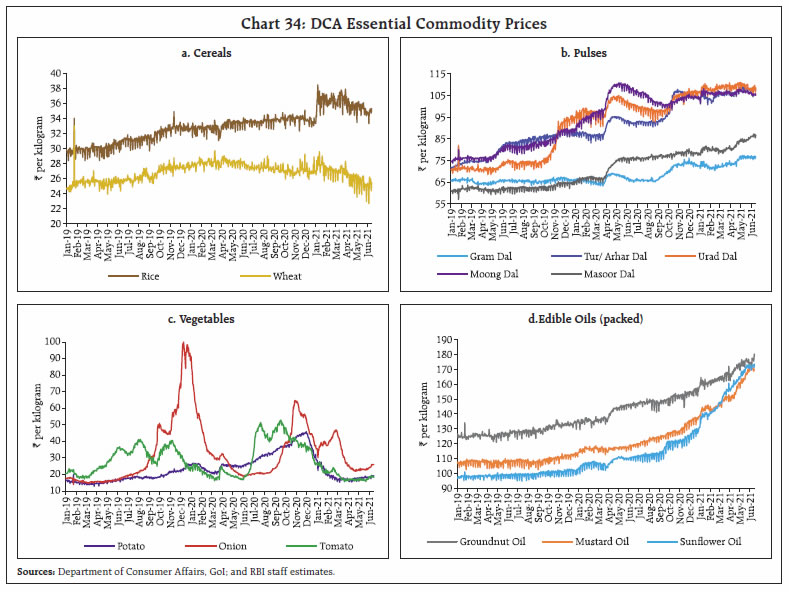
| Table 6: Petroleum Product Prices | | Item | Unit | Domestic Prices | Month-over-month (per cent) | | Jun-20 | May-21 | Jun-21^ | May-21 | Jun-21 | | Petrol | ₹/litre | 79.22 | 94.37 | 97.20 | 1.9 | 3.0 | | Diesel | ₹/litre | 72.98 | 86.68 | 89.93 | 2.5 | 3.7 | | Kerosene (subsidised) | ₹/litre | 15.45 | 30.38 | 32.13 | 0.2 | 5.7 | | LPG (non-subsidised) | ₹/cylinder | 601.50 | 819.63 | 819.63 | 0.0 | 0.0 | ^: For the period June 1 -14, 2021.
Note: Other than kerosene, prices represent the average Indian Oil Corporation Limited (IOCL) prices in four major metros (Delhi, Kolkata, Mumbai and Chennai). For kerosene, prices denote the average of the subsidized prices in Kolkata, Mumbai and Chennai.
Sources: IOCL; Petroleum Planning and Analysis Cell (PPAC); and RBI staff estimates. | CPI-WPI Inflation Divergence in the Recent Period In the post-lockdown period, CPI and wholesale price index (WPI) inflation rates have been exhibiting considerable divergence. By May 2021, WPI inflation was at 12.9 per cent, exceeding CPI inflation by 6.6 percentage points. This has raised concerns about likely spill overs to retail inflation, especially to the core. Episodes of such large divergences are often exclusively caused by prices of basic and intermediate commodities and industrial products, which are not included in the CPI, but form a sizeable share of the WPI (Das and George, 201719). These are largely internationally traded, with domestic prices closely linked to global commodity price cycles. During April-July 2020, a collapse in international commodity prices caused the WPI to register sustained deflation; subsequently, with a sharp pick-up in commodity prices since H2:2020-21, the WPI registered double-digit inflation by April-May 2021. Using a time-varying parameter regression, the long-run coefficient of WPI inflation (y-o-y) on CPI inflation (y-o-y) for the period April 2012 to May 2021 is estimated to have declined from 0.57 in November 2013 to 0.14 in May 2021 (Chart 35). Estimates of the time-varying volatility in international commodity prices when juxtaposed with the CPI-WPI coefficient show a strong inverse relationship between two, with a correlation coefficient of (-) 0.7920 (Chart 36). This indicates that rising volatility in international commodity prices over the last decade has resulted in the weakening of the long-run relationship between CPI and WPI inflation.
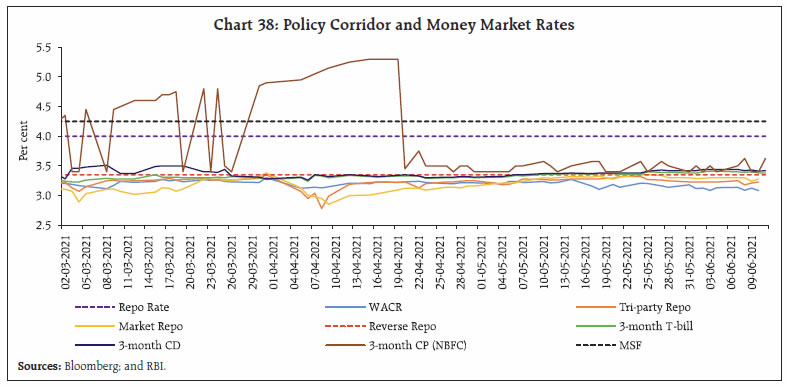
IV. Financial Conditions The Reserve Bank acted proactively to steer congenial financial conditions in the system by ensuring that systemic liquidity stays in abundance. A second round of purchases under the Government Securities Acquisition Programme (G-SAP) 1.0 was undertaken on May 20, 2021 amounting to ₹35,000 crore. It evoked a heartening response as mirrored in a bid-cover ratio of 3.5. Another round of purchases under G-SAP 1.0 amounting to ₹40,000 crore shall be conducted on June 17, of which ₹10,000 crore will constitute state development loans (SDLs). The Reserve Bank also announced G-SAP 2.0 on June 4, 2021 – the purchase of government securities from the secondary market worth ₹1.2 lakh crore during Q2:2021-22. The average daily net absorption widened again to ₹5.0 lakh crore during June 2021 (up to June 14), aided by capital inflows. Amongst other autonomous drivers of liquidity, currency in circulation expanded by ₹1.2 lakh crore in 2021-22 so far (up to June 4) with heightened precautionary demand for cash amidst the second wave of the pandemic, which also drained liquidity from the banking system. Cumulatively, however, leakages through autonomous drivers were more than offset by liquidity infusing operations through OMOs and forex purchases conducted by the Reserve Bank. As a result, liquidity absorbed through reverse repo (both fixed and variable rate) operations averaged ₹5.5 lakh crore during May 2021 and ₹5.8 lakh crore in June (up to June 14) (Chart 37). Overnight rates in the uncollateralised segment drifted towards the reverse repo rate during May 2021. The weighted average call rate (WACR), the tri-party repo and the market repo rate stayed at sub-reverse repo rate levels, trailing by 16 bps, 9 bps and 6 bps in May 2021 (Chart 38). These rates traded even lower by 24 bps, 12 bps and 6 bps, respectively, in June (up to June 14) as systemic liquidity expanded. The term money market rates, i.e., the 3-month T-bill rate and 3-month certificates of deposit (CD) rates firmed up by 9 bps and 11 bps, respectively during May 2021 from end-April levels and traded around same levels in June 2021 (up to June 14). Overall monetary/credit conditions stayed accommodative in support of the economic recovery. Scheduled commercial banks’ (SCBs) credit to the commercial sector recorded a growth of 6.0 per cent (6.2 per cent a year ago) (Chart 39). Furthermore, taking into account SCBs’ investments in statutory liquidity ratio (SLR) securities and non-SLR securities along with credit offtake, their flow of funds in the economy expanded by 7.0 per cent (8.8 per cent a year ago). 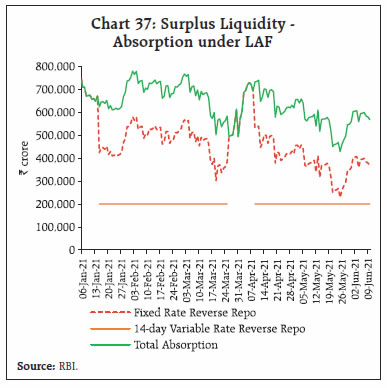
 During March 2020 to May 2021, the 1-year median marginal cost of funds based lending rate (MCLR) of SCBs softened cumulatively by 95 bps, indicating a reduction in overall cost of funds. During the same period, the median term deposit rate (MTDR) – representing average card rates on fresh deposits across all tenors – declined by 144 basis points, with a noticeable moderation stemming from shorter tenor deposits of maturity of up to one year (156 bps). Across bank groups, the maximum cut in term deposit rates occurred in respect of foreign banks, followed by private banks. Public sector banks, which face stiff competition from alternative saving instruments like small savings, allowed more moderate transmission to term deposit rates (Table 7). The interest rates on small saving instruments (SSIs), which are higher than the requisite formula-based rates,21 will be reviewed on June 30, 2021. 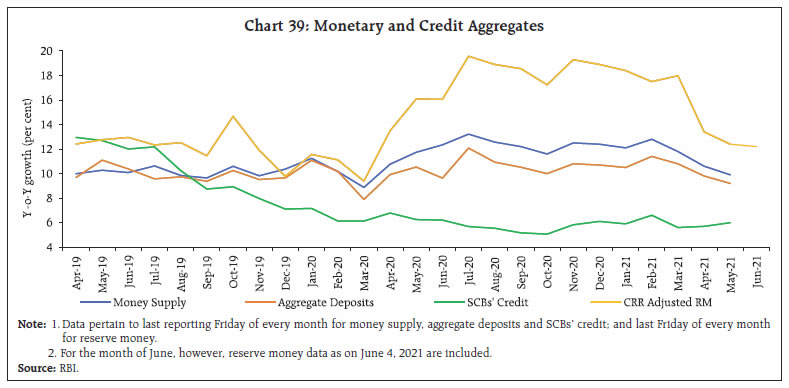
| Table 7: Transmission from the Repo Rate to Banks’ Deposit and Lending Rates | | (Basis points) | | Period | Repo Rate | Term Deposit Rates | Lending Rates | | Median Term Deposit Rate | WADTDR | 1 - Yr. Median MCLR | WALR - Outstanding Rupee Loans | WALR - Fresh Rupee Loans | | Feb 2019 - Sep 2019 | -110 | -9 | -7 | -30 | 2 | -40 | | Oct 2019 – May 2021* | -140 | -174 | -148 | -122 | -109 | -147 | | Mar 2020 – May 2021* | -115 | -144 | -109 | -95 | -91 | -116 | | Feb 2019 – May 2021* | -250 | -210 | -155 | -154 | -107 | -187 | *: Latest data on WALRs and WADTDR pertain to April 2021.
WALR: Weighted Average Lending Rate. WADTDR: Weighted Average Domestic Term Deposit Rate;
MCLR: Marginal Cost of Funds based Lending Rate.
Source: RBI. | In the fixed income segment, the yield on 10-year G-sec traded close to the 6 per cent level in the second fortnight of May 2021 and early June 2021 (Chart 40). The benign CPI inflation print for April 2021, the confidence-inducing impact of G-SAP 1.0 auctions and softening US treasury yields engendered the downward bias in yields. Towards the end of May, however, concerns over excess supply following reports of additional government borrowing to the tune of ₹1.58 lakh crore soured market sentiment, pushing the 10-year G-sec yield above 6 per cent. Subsequently, market stayed in a narrow range, guided by cues from announcement of another round of purchases under G-SAP 1.0 coupled with G-SAP 2.0 for Q2:2021-22 amidst softened momentum in US treasury yields. In the primary market, four auctions were conducted in the second half of May and first fortnight of June, which took the gross borrowings by the central government to ₹2.71 lakh crore, thus completing nearly 37 per cent of ₹7.24 lakh crore scheduled for H1:2021-22.
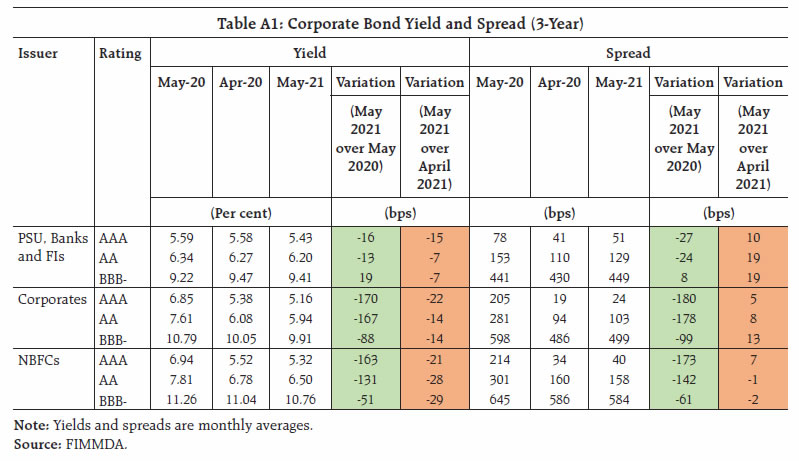
Corporate bond yields eased further during May 2021 across ratings and issuers catergories, led mainly by non-banking financial companies (NBFCs) and corporates (Annex Table A1). Even though the policy repo rate has remained unchanged, a slew of conventional and unconventional policy measures fostered congenial financial conditions and lowered the risk premia on corporate bonds. Indian equity markets commenced May 2021 on a bearish note but gained strength on the back of liquidity enhancing measures announced by the Reserve Bank and resumption of portfolio flows (Chart 41). Indian equities were further boosted by the steady decline in COVID-19 caseloads, sustained rise in recoveries and vaccinations. Reflecting these positive developments, the BSE Sensex rebounded by 6.5 per cent during May 2021 to close at 51,937. Buoyed by prospects of relaxation of containment measures, the domestic equity markets extended its gaining streak into June 2021, with the BSE Sensex increasing further by 1.2 per cent to close at 52,552 on June 14, 2021. Amid risk-on sentiment, gains were recorded in the BSE Midcap and BSE Smallcap indices, which increased by 4.7 per cent and 6.3 per cent, respectively, in June 2021 so far. Reflecting the increase in preferences for holding overseas securities, net resource mobilisation by fund of funds (FoFs) investing overseas – an open ended mutual fund scheme with minimum 95 per cent of total assets invested in the overseas fund – increased to ₹10,850 crore in 12 months ended May 2021 from ₹1,006 crore in 12 months ended May 2020. In May 2021, net foreign portfolio investors (FPI) inflows were to the tune of US$ 0.9 billion. FPIs made net purchases in the equity segment to the tune of US$ 3.1 billion between May 18 and June 10, 2021, coinciding with the drop in the number of COVID-19 cases in India. Higher FPI activity in the equity market reflects their rising confidence about an impending recovery in the economy, alleviating earlier concerns of investors on corporate earnings (Chart 42). Foreign exchange reserves reached an all-time high of US$ 605.0 billion on June 4, 2021 (Chart 43). In the foreign exchange market, the Indian rupee (INR) appreciated against the US dollar in May 2021 and gained further in June (up to 11th). In terms of the 40-currency real effective exchange rate index, the INR appreciated by 2.0 per cent in May 2021 over its level a month ago (Chart 44). Payment System In the digital space, payment channels across the board experienced growth (y-o-y) in May 2021 (Table 8), although it moderated compared to a month ago, partly due to abnormally high base effects. In absolute terms, there has been a pruning of both transaction volume and values across key payments systems like the Real Time Gross Settlement (RTGS), National Electronic Funds Transfer (NEFT), Unified Payments Interface (UPI), Immediate Payment Service (IMPS) and National Electronic Toll Collection (NETC) in May 2021. Nevertheless, data for early June 2021 points to growth resuming across most platforms.
V. Conclusion Vaccines will not end the pandemic by themselves, notwithstanding their being perhaps the greatest scientific achievements in recent history. We have to learn to live with the virus, complementing vaccines with ramping up investment in healthcare, logistics and research. The pandemic is a real shock with real consequences. Hence, there is a need to ensure that the recovery is built on a solid foundation of business investment and productivity growth. Life- and work-style transformation such as increased remote work and online shopping may likely endure. When patterns of demand shift, some firms may face closure. Some industries may become permanently smaller. At the same time, existing firms in industries experiencing increased demand may expand and new ones will emerge. What matters is that resources are put to their best use and that reallocation occurs smoothly and with as few costs as possible (Carstens, 2021)22. An influential view identifies three sectors with the greatest growth potential in the post-recovery decade (Spence, 2021)23: digital technologies; biomedical science (along with its applications in health care); and technologies that address the various challenges to sustainability, especially those pertaining to climate change. As Winston Churchill remarked, a pessimist sees the difficulty in every opportunity; an optimist sees the opportunity in every difficulty.24 Inflation talk is driving a taut tension through the evolving discourse on the global macroeconomic outlook. Markets and analysts are convinced that inflation is rising into the long-term and will force the hand of monetary authorities to abandon ultra-accommodation. Central banks see the surge in inflation as transitory and talk down speculation about dialling back their easy policy stance. Frictions flare with every incoming data. In the latest development, however, US CPI inflation rose 5 per cent in May, the highest in nearly 13 years. Paradoxically, it was met by a global rally in bond prices that took the US benchmark 10-year yield to 1.48 per cent, its lowest level since March 2021, and lifted other government bond markets around the world in its tide. Has the market’s anxiety about inflation begun to subside, and is it veering to the other side of the debate? Market-based inflation expectations - 10-year break-evens - are on the decline. Analysts argue that the rise in inflation might be both modest and temporary, but in their view, several central banks have locked themselves into responding too slowly - “outcome-based” as opposed to “forecast-based” policy will inevitably result in an over-reaction, given the lags between policy and outcomes, as was seen in the 1970s with the brutal Volcker disinflation that followed. A severe monetary tightening now will be devastating (Wolf, 202125). Underlying this impasse, analysts see the large monetary and fiscal stimulus as out of all proportion to the gap between aggregate demand and potential supply. They also point to the fact that their inflation mandates are being weakened by diversions like climate change (King, 2021)26. It is pointed out that indications of market froth are multiplying and more warnings about input cost pressures on rising commodity prices are being sounded than before. While the surge in inflation may have a lot to do with pandemic base effects, it is also fuelled by years of underinvestment having made the supply response less dynamic, exacerbated by supply chain bottlenecks. In this situation, monetary policy is hostage to its own stance and loose financial conditions that it creates will cause excessive risk taking in markets even as inflation migrates upwards. Ultimately, monetary brakes will have to be slammed from behind the curve and what could have been a long, inclusive recovery will be undermined (El Erian, 2021)27. In contrast, central banks have reiterated time and again that the current bout of price rises is temporary, and it will not push them to an early unwind of monetary stimulus. They pledge to unwaveringly stay the course of keeping policy ultra-accommodative until the goal of a durable recovery that embraces all is achieved. The ECB believes that some of the bottlenecks which have led to higher inflation will gradually fade out because it is a matter of supply response (Lagarde, 2021)28. It is pointed out that there is still significant economic slack, and that will only be absorbed gradually. With monetary policy strategy catering to medium-term concerns, it means that short-term fluctuations should be looked through (Schnabel, 2021)29. In the US, market-implied inflation expectations have risen only to the levels that prevailed in the early 2010s, after which inflation never ran consistently above 2 percent, and most survey measures are sending similar signals (Quarles, 2021)30. Furthermore, the latest round of stimulus seems to be supporting spending and growth without causing an inordinate rise in interest rates or inflation expectations. In India, the monetary policy committee of the Reserve Bank has recently weighed in on the debate. In its June 4 resolution, it saw the inflation trajectory in India being shaped by both upside and downside risks. In its view, rising international commodity prices, especially of crude, logistics costs, excise duties, cesses and taxes pose upside risks to the inflation outlook. On the other hand, expectations of a normal south-west monsoon, recent supply side interventions in the pulses market and further supply side measures to cool pulses and edible oil prices, and easing of containment measures with declining infections are seen as forces that would mitigate cost pressures and inflation going forward. Weak demand conditions may also temper the pass-through to core inflation. Accordingly, the MPC projected CPI inflation in 2021-22 in the upper reaches but within the tolerance band at a little above 5 per cent with risks broadly balanced (Chart 45). In conclusion, the article on the State of the Economy continues to evoke diverse views. Some have said that it has made the Bulletin readable, that it is a statement of hope, and we thank them. Others have been less kind, but they have tended to lean towards issues of form than of substance. They have pleaded with us to please be boring. They see us as going over the top in offering bromides and indulging in quote fests by enlisting luminaries and borrowed philosophy. Yes, we rely on the wisdom of our forebears and our contemporaries whose words shine, like light that cannot be hid. After all, knowledge is a chain, with neither beginning nor end. No one is an island, entire of itself; everyone is a piece of the continent, a part of the main31. So, we can do no better than remember the words of Sir Isaac Newton in 167532: “If I have seen further, it is by standing on the shoulders of Giants.” 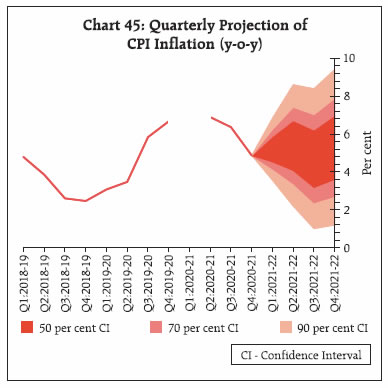
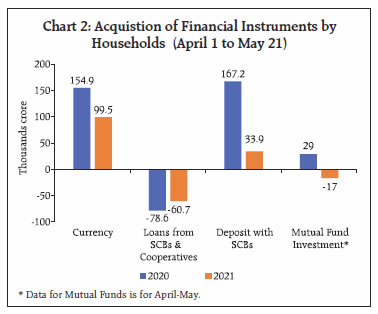
Annex Box 1: COVID-19 and Household Financial Savings There is a perception that the COVID-19 pandemic seems to have altered consumer/household’s consumption and saving behaviour amidst heightened uncertainty on income streams. Both the permanent income hypothesis (PIH) and life cycle models (LCM) emphasise consumption smoothing of households over a period of time. While LCM shows how savings could be used to transfer purchasing power from one phase of life to another, consumption depends on both income and wealth. Households/ consumers react in two ways to income volatility. In the case of temporary income shocks, households smooth consumption through borrowing, they tend to protect their wealth in the case of permanent income shocks. Friedman’s PIH also recognises the role of permanent income and shocks in the form of negative/positive transitory income. Amidst high uncertainty of income, precautionary savings tend to rise with decline in discretionary spending, as reflected in the private final consumption expenditure data on India during the pandemic period. According to preliminary estimates by the Reserve Bank, the household financial savings in Q3:2020-21 have come down to 8.233 per cent of GDP from 21 per cent and 10.4 per cent in the previous two quarters. Households’ Savings in Liquid Mutual Funds and Gold ETFs The savings of high net-worth individuals (HNIs) and retail individuals in liquid funds34 surged sharply in Q1:2020-21 – mirroring the impact of uncertainty amidst COVID-19 induced lockdown (Chart 1a and 1b). Households also parked their funds in gold exchange-traded funds (ETFs). Since then, HNIs’ investments in liquid funds has been negative (implying a drawdown), but retail individuals continue to park their savings in liquid funds. HNIs’ and retail individuals’ investments in gold ETFs have been positive since June 2020. Households’ savings in liquid mutual funds and gold ETFs taken together rose in Q1:2020-21, followed by drawdowns in next two quarters, before an upturn again in Q4:2020-21. Bank deposits35 – with a share of around 55 per cent in total assets of households - decelerated by 0.1 per cent at end-April 2021 on a m-o-m basis as against a growth of 1.1 per cent in April 2020; while bank advances – with a share of 79 per cent in total liabilities - contracted by 0.8 per cent as against (-) 0.9 per cent in the previous year. The rate of decline in bank deposits vis-a-vis bank credit has also been higher, indicating that this time around the banking sector component of household savings declined in sharp contrast with the spike in savings witnessed during the first wave. Additionally, currency holding with public has also decelerated significantly to 1.7 per cent during April 2021 in comparison to the growth of 3.5 per cent a year ago, implying heavy outgo towards COVID induced medical expenditure (Chart 2). 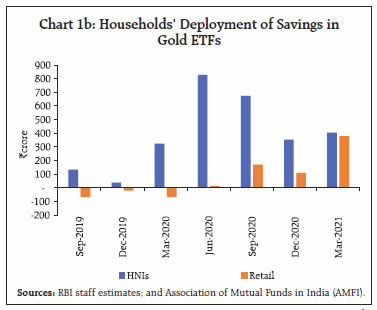
 The average 1-year pre-tax return on liquid funds for period ended April 2021 is higher than the savings deposit rate as of June 04, 2021 (Chart 3). Further, tax liabilities on returns earned by long-term holders of liquid funds (beyond three years) turn out to be lower for individuals, particularly those in high income slabs, in comparison to holders of bank deposits. Therefore, in a scenario of low interest rates, varied expectations of returns on different instruments may be altering the savings preferences of some households. |
|