| I. Macroeconomic Outlook Domestic economic activity is normalising after the ferocious second wave retarded momentum. The outlook remains overcast by the future path of the pandemic; the accelerated pace of vaccination and release of pent-up demand provide an upside to the baseline growth path. Headline inflation has fallen back into the tolerance band and the trajectory is expected to be driven by supply-side factors. A faster resolution of supply chain disruptions, good foodgrains production and effective supply management could cause inflation to undershoot the baseline, contingent on the evolution of the pandemic and the efficacy of vaccines. In the months following the retention of the inflation target at 4 per cent with a +/- 2 per cent tolerance band around it for the period 2021-26 by the Government of India (GoI) on March 31, 2021, the monetary policy framework faced a testing challenge from a shock price spike in May 2021. In addition to pandemic-induced disruptions that shaped the trajectory of inflation during the first wave, spillovers from the hardening of commodity prices, especially of crude and edible oil, propelled headline inflation above the upper tolerance band. The episode was short-lived though and inflation has fallen back into the tolerance band. The monetary policy committee (MPC) decided to look through this shock, reading it as supply-driven and transitory. In its meetings in June and August, the MPC maintained status quo on the policy rate and committed to remain accommodative as long as it takes to revive and sustain growth and mitigate the impact of the pandemic on the economy. Developments in the real economy in the first half of 2021-22 have vindicated this stance – shorn of statistical base effects, aggregate demand trails below pre-pandemic levels and considerable slack still prevails in the economy, especially in contact-dependent sectors that faced the brunt of the pandemic. In the second quarter of 2021-22, however, a hesitant recovery is underway, nurtured by the appreciable decline in infections, the stepping up of the scale and speed of vaccinations, and the congenial financial conditions engendered by monetary policy. I.1 Key Developments since the April 2021 MPR Since the release of the April 2021 Monetary Policy Report (MPR), the global macroeconomic environment has been unsettled by diverging paths of economies across the world, between advanced and emerging economies and also among them, mainly differentiated by vaccine access. This is reflected most vividly in monetary policy actions and stances, with some of them staying the course of remaining accommodative and supporting growth and others pre-emptively tightening monetary policy on the assessment that inflation presents a bigger risk. Decoupling of growth paths and the disconnect in monetary policy responses pose downside risks to the global recovery, which already appears to be losing steam. Global economic conditions are also besieged by the resurgence of inflation across the world. Some central banks, mostly in advanced economies (AEs), have judged the rise in inflation as transitory, while some others, mostly in emerging market economies (EMEs) regard breaches of upper tolerance bands as unacceptable and growth threatening. Financial markets are trying to second-guess the commencement of normalisation. Episodic shifts in risk appetite have rendered equity markets frothy with stretched valuations, with intermittent flights into and out of the safety of bonds. Meanwhile, EMEs are awash with capital flows and rotations thereof on taper talk and carry trade and currencies have turned volatile as a result. Several countries that had unlocked their economies and encouraged mobility have faced renewed surges of infections from the Delta variant of the virus, which has turned the evolving global outlook highly uncertain and fragile. Global growth has been supported by strong external demand on the back of buoyant merchandise trade. The World Trade Organization’s (WTO) goods trade barometer hit a high in June 2021 reading. The 20-point year-on-year (y-o-y) rise in the index reflects both the strength of the recent trade expansion and the depth of the pandemic-induced shock in 2020. Worryingly, though, the rate of increase in the index has started to come off, presaging a peaking of the upward momentum in world trade. Container shortages, increased port turnover time and three major shipping alliances controlling much of the supplies have resulted in a jump in freight rates putting the sustainability of the global trade expansion at risk. Services trade continues to lag merchandise trade, with significant contraction in international travel services, although in Q2 some improvement is evident, including through revenge tourism, and increase in transport and other goods related services boosted by demand for goods and freight rates. In India, the recovery that was taking hold from the second half of 2020-21 was disrupted by the second wave of COVID-19 in the weeks following the release of the April 2021 MPR. Although the ferocity of the second wave was not anticipated, the loss of output was about 40 per cent less than during the first wave, as adaptation to pandemic protocols limited restrictions to localised and region-specific containment measures instead of the nation-wide lockdown that was enforced during the first wave. Nevertheless, inflationary pressures became accentuated, as set out earlier, with erosion in fiscal positions. Against this backdrop, the pace of domestic economic activity in Q1:2021-22 (April-June) turned out to be somewhat weaker than anticipated in the April MPR and remained below 2019-20 levels. High frequency indicators of activity suggest that the economy may be pulling out of the second wave’s impact, but uncertainty about the incidence of the third wave makes the outlook fraught with risks. Thus, the pandemic continues to have an overwhelming influence on global and domestic macroeconomic conditions. Virus mutations threaten the progress made through vaccinations and medical responses. Infections keep flaring up in various geographies, forcing authorities to re-impose restrictions/lockdowns restraining economic activity. At the same time, greater adaptability, rising vaccination coverage and continuation of policy support are working towards mitigating the effects of new waves of the pandemic. Equal and universal vaccination holds the key to a brighter outlook, both globally and domestically. Monetary Policy Committee: April-September 2021 During April-September 2021, the MPC met thrice. In the April meeting, the MPC noted that supply side pressures on inflation could persist while demand-side pull remains moderate. On the gross domestic product (GDP) growth outlook, the jump in COVID-19 infections in certain parts of the country and the associated localised lockdowns were seen as dampening the demand for contact-intensive services, restraining growth impulses and prolonging the return to normalcy. In such an environment, the MPC observed that continued policy support remained necessary and unanimously voted to keep the policy repo rate unchanged and to continue with the accommodative stance as long as necessary to sustain growth on a durable basis and mitigate the impact of COVID-19 on the economy, while ensuring that inflation remained within the target going forward. In the June 2021 meeting, the MPC observed that the rising trajectory of international commodity prices, especially of crude, together with logistics costs, posed upside risks to the inflation outlook with weak demand conditions tempering the pass-through to core inflation. On the growth outlook, the MPC noted that the second wave of COVID-19 had altered the near-term outlook, and policy support from all sides – fiscal, monetary and sectoral – was required to nurture recovery and expedite return to normalcy. Accordingly, the MPC decided unanimously to maintain status quo on the policy repo rate and continue with the accommodative stance. When the MPC met in August, headline inflation had breached the upper threshold for the second month in succession in June due to strong momentum in the May print running across all the major sub-groups. The MPC assessed that the inflationary pressures were largely driven by transitory supply shocks while stressing that it was conscious of its objective of anchoring inflation expectations. On growth, the MPC noted that the outlook for aggregate demand was improving, but it was still weak and there was a large amount of slack in the economy, with output below its pre-pandemic level. It judged that the nascent and hesitant recovery needed to be nurtured. Accordingly, the MPC decided unanimously to keep the policy repo rate unchanged and on a 5 to 1 majority to continue with the accommodative stance. The MPC’s voting pattern on the policy repo rate setting during H1:2021-22 reflected broader unanimity in members’ assessments and expectations, mirroring the voting outcomes in a number of other central banks (Table I.1). Macroeconomic Outlook Chapters II and III analyse the macroeconomic developments during H1:2021-22 (April-September). For the updated projections set out in this Chapter, the evolution of key macroeconomic and financial variables over the past six months warrants revisions in the baseline assumptions as set out below (Table I.2). | Table I.1: Monetary Policy Committees and Policy Rate Voting Patterns | | Country | Policy Meetings: April - September 2021 | | Total meetings | Meetings with full consensus | Meetings without full consensus | Variation in policy rate (basis points) | | Brazil | 4 | 4 | 0 | 350 | | Chile | 4 | 4 | 0 | 100 | | Colombia | 4 | 1 | 3 | 25 | | Czech Republic | 4 | 1 | 3 | 125 | | Hungary | 6 | 6 | 0 | 105 | | India | 3 | 3 | 0 | 0 | | Israel | 4 | 2 | 2 | 0 | | Japan | 4 | 0 | 4 | 0 | | South Africa | 3 | 3 | 0 | 0 | | Sweden | 3 | 3 | 0 | 0 | | Thailand | 4 | 3 | 1 | 0 | | UK | 4 | 4 | 0 | 0 | | US | 4 | 4 | 0 | 0 | | Sources: Central bank websites. | First, global crude oil prices have hardened substantially since the April MPR on the back of a rebound in demand and regulated production by the Organization of the Petroleum Exporting Countries (OPEC) plus. Crude prices initially eased from July 2021 highs on the back of the decision by OPEC plus to increase production by 0.4 million barrels per day on a monthly basis starting August and the moderation in demand due to renewed surge in COVID-19 infections. Crude prices, however, hardened again in August-September on supply disruptions due to hurricanes and fall in inventories. Taking into account these developments, crude prices (Indian basket) are assumed at US$ 75 per barrel in the baseline, 16 per cent above the April 2021 MPR baseline (Chart I.1). | Table I.2: Baseline Assumptions for Projections | | Indicator | MPR April 2021 | MPR October 2021 | | Crude Oil (Indian basket) | US$ 64.6 per barrel during 2021-22 | US$ 75 per barrel during H2:2021-22 | | Exchange rate | ₹72.6/US$ during 2021-22 | ₹74.3/US$ during H2:2021-22 | | Monsoon | Normal for 2021 | 1 per cent below long-period average | | Global growth | 5.5 per cent in 2021
4.2 per cent in 2022 | 6.0 per cent in 2021
4.9 per cent in 2022 | | Fiscal deficit (per cent of GDP) | To remain within BE 2021-22
Centre: 6.8
Combined: 10.8 | To remain within BE 2021-22
Centre: 6.8
Combined: 10.2 | | Domestic macroeconomic/ structural policies during the forecast period | No major change | No major change | Notes: 1. The Indian basket of crude oil represents a derived numeraire comprising sour grade (Oman and Dubai average) and sweet grade (Brent) crude oil.
2. The exchange rate path assumed here is for the purpose of generating the baseline projections and does not indicate any ‘view’ on the level of the exchange rate. The Reserve Bank is guided by the objective of containing excess volatility in the foreign exchange market and not by any specific level of and/or band around the exchange rate.
3. BE: Budget estimates.
4. Combined fiscal deficit refers to that of the Centre and States taken together.
Sources: RBI estimates; Budget documents; and IMF. | Second, the nominal exchange rate (the Indian rupee or INR vis-à-vis the US dollar) has exhibited two-way movements in a range of INR 72-75 per US dollar since April 2021. After depreciating in early-April on concerns about the economic fallout from the second wave, the INR remained under appreciating pressures until May 2021. It depreciated again in June on a strengthening US dollar and rising crude oil prices. The INR appreciated in August with the resumption of portfolio flows, but this was reversed in September. Taking these developments into consideration, the exchange rate is assumed at INR 74.3 per US dollar in the baseline as against INR 72.6 in the April MPR. 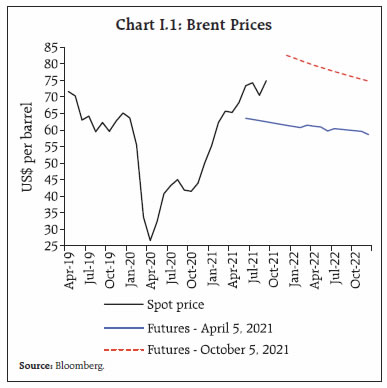 Third, the strength of global growth and external demand has been stronger than the April MPR baseline, albeit with some loss of momentum in recent months over renewed infections and persisting global supply-demand imbalances in key inputs such as chips and semiconductors (Chapter V). Growth prospects of AEs have improved significantly on better vaccine coverage and higher fiscal support relative to emerging market and developing economies (EMDEs) (Chart I.2). After a strong rebound in Q1:2021, the pace of expansion in global merchandise trade has slowed, weighed down by elevated shipping charges and logistics costs. The global manufacturing purchasing managers’ index (PMI) remained in expansion at 54.1 in September 2021, unchanged from August's six-month low as supply chain issues continued to hinder output growth. I.2 The Outlook for Inflation Consumer price index (CPI) inflation breached the upper tolerance threshold of 6 per cent in May and June 2021 driven by supply-side pressures in food, fuel and core inflation. In August 2021, inflation eased to 5.3 per cent, aided by a moderation in momentum and favourable base effect. Looking ahead, the three months and one year ahead median inflation expectations of urban households fell by 50 basis points (bps) and 60 bps, respectively, in the September 2021 round of the Reserve Bank’s survey, tracking actual inflation dynamics.1 The proportion of respondents expecting the general price level to increase by more than the current rate decreased for three months ahead horizon but increased for one year ahead horizon vis-à-vis the previous round (Chart I.3). Manufacturing firms polled in the July-September 2021 round of the Reserve Bank’s industrial outlook survey expect the cost of raw materials and selling prices to rise further in Q3:2021-22 (Chart I.4).2 Service sector companies participating in the services and infrastructure outlook survey also expect further rise in input cost pressure and selling prices in Q3:2021-22.3 According to the respondents in the manufacturing and services PMIs, input and output price pressures persisted in September 2021.
Professional forecasters surveyed by the Reserve Bank in September 2021 expect CPI inflation to ease from 5.3 per cent in August 2021 to 4.7 per cent in Q3:2021-22 and subsequently move up to 5.7 per cent in Q4:2021-22 before easing to 4.9 per cent in Q2:2022-23 (Chart I.5).4 Kharif sowing has progressed satisfactorily and foodgrains production is estimated to touch a new record which, along with ample buffer stocks of foodgrains, should help to contain cereal prices. Global food, oil and other commodity prices, however, remain firm. Taking into account the initial conditions, signals from forward-looking surveys and estimates from structural and other time-series models, CPI inflation is projected to move from 5.6 per cent during Q1:2021-22 to 5.1 per cent in Q2, 4.5 per cent in Q3, and 5.8 per cent in Q4, with risks broadly balanced (Chart I.6). The 50 per cent and the 70 per cent confidence intervals for headline inflation in Q4:2021-22 are 4.4-7.2 per cent and 3.6-8.0 per cent, respectively. For 2022-23, assuming a normalisation of supply chains on the back of improved vaccination, a normal monsoon and no major exogenous or policy shocks, structural model estimates indicate that inflation will move in a range of 4.5-5.2 per cent. The 50 per cent and the 70 per cent confidence intervals for Q4:2022-23 are 2.7-6.3 per cent and 1.7-7.2 per cent, respectively. 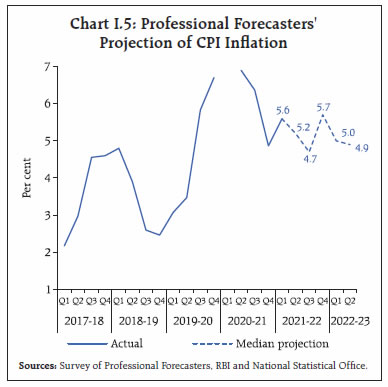 There are a number of upside and downside risks to the baseline inflation forecasts. The upside risks emanate from a longer-than-expected persistence of supply chain disruptions; a further hardening of global commodity prices, especially that of crude oil; a quicker pass-through of input cost pressures to output prices on the back of strong pent-up domestic demand from ebbing infections and vaccination-led consumer confidence; unseasonal rainfall impacting crop production; and global financial market volatility from a faster US monetary policy normalisation. The downside risks arise from an earlier than expected mending of supply chain disruptions; the persistence of weak demand and slack in the economy; and corrections in global commodity and crude prices in the event of a weakening of global demand over new mutants and poor vaccination coverage in low-income countries.
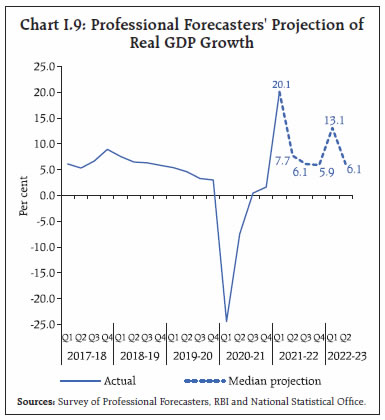
I.3 The Outlook for Growth With the ebbing of the second wave, a phased relaxation of the pandemic-related localised restrictions, and improving vaccine coverage, economic activity has been normalising gradually since June 2021. Looking ahead, prospects for the agricultural sector and rural demand look promising, supported by the late revival in kharif sowing. Urban demand is also likely to accelerate with the release of pent-up demand, aided by the significant expansion in the pace of vaccination since July and improving consumer confidence – as of October 6, 2021, nearly 27 per cent of India’s adult population has been fully vaccinated, while 71 per cent has received one dose. This augurs well for the sustenance of contact-intensive activities and consumption demand. The government’s focus on capital expenditure and continued reform push, large foreign direct investment flows, congenial monetary and financial conditions, and boom in the initial public offerings provide a conducive environment for investment activity. There are signs that the investment pipeline could increase in the rest of 2021-22 and in the coming year, given the interest in the production linked incentive (PLI) scheme and the continued focus on road infrastructure. 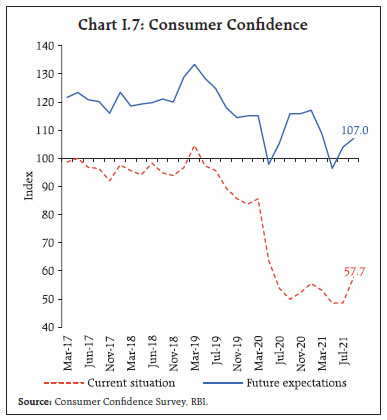 Turning to the key messages from forward-looking surveys, the consumer confidence (the current situation index) in the September 2021 round recovered marginally from the all-time low recorded in May-July 2021, while index for the year ahead remained in the optimistic zone, driven by recovery in sentiments on the general economic situation, the employment scenario and household spending (Chart I.7).5 Sentiments in the manufacturing sector for the quarter ahead strengthened further in the July- September 2021 round of the Reserve Bank’s industrial outlook survey, reflecting optimism on production, order books, capacity utilisation, and employment (Chart I.8). Services and infrastructure sectors expect further strengthening in overall business situation and turnover in Q3:2021-22. Surveys by other agencies released during May-July generally reported a decline in business expectations over the previous rounds but remained upbeat from a year ago (Table I.3). According to the purchasing managers’ survey for September 2021, the one year ahead business expectations of firms in the manufacturing and services sectors were optimistic albeit below historical levels. Professional forecasters polled in the September 2021 round of the Reserve Bank’s survey expect real GDP growth to move from 20.1 per cent in Q1:2021- 22 to 5.9 per cent in Q4; it is expected at 13.1 per cent in Q1:2022-23 due to base effects and 6.1 per cent in Q2 (Chart I.9). | Table I.3: Business Expectations Surveys | | Item | NCAER Business Confidence Index (July 2021) | FICCI Overall Business Confidence Index (May 2021) | Dun and Bradstreet Composite Business Optimism Index (July 2021) | CII Business Confidence Index (June 2021) | | Current level of the index | 61.8 | 51.5 | 74.2 | 50.4 | | Index as per previous survey | 85.2 | 74.2 | 61.5 | 68.7 | | % change (q-o-q) sequential | -27.5 | -30.6 | 20.7 | -26.6 | | % change (y-o-y) | 33.2 | 20.0 | 152.4 | 22.9 | Notes:
1. NCAER: National Council of Applied Economic Research.
2. FICCI: Federation of Indian Chambers of Commerce & Industry.
3. CII: Confederation of Indian Industry.
Sources: NCAER, FICCI, CII and Dun & Bradstreet Information Services India Pvt. Ltd. |
 While the near-term prospects are bolstered by the lower base of last year, the outlook is contingent on the evolving COVID-19 trajectory. Taking into account the Q1 growth of 20.1 per cent, baseline assumptions, survey indicators, and model forecasts, real GDP growth is projected at 9.5 per cent in 2021- 22 –7.9 per cent in Q2, 6.8 per cent in Q3, and 6.1 per cent in Q4 – with risks evenly balanced around this baseline path (Chart I.10 and Table I.4). For 2022-23, the structural model estimates indicate real GDP growth at 7.8 per cent, with quarterly growth rates in the range of 5.0-17.2 per cent, assuming restoration of supply chains, a normal monsoon, no major exogenous or policy shocks, and full vaccination. There are upside and downside risks to the baseline growth path. Stronger-than-expected pent-up demand amidst a faster pace of vaccination and mild variants of the virus, and government’s focus on infrastructure investment and asset monetisation and reform measures provide an upside to the baseline growth path. On the contrary, new and more contagious variants of the virus, elevated levels of crude oil and commodity prices, more persistent pandemic-related domestic as well as global supply bottlenecks and global financial market volatility pose downside risks to the baseline growth path. | Table I.4: Projections - Reserve Bank and Professional Forecasters | | (Per cent) | | | 2021-22 | 2022-23 | | Reserve Bank’s Baseline Projections | | | | Inflation, Q4 (y-o-y) | 5.8 | 4.5 | | Real GDP growth | 9.5 | 7.8 | | Median Projections of Professional Forecasters | | | | Inflation, Q4 (y-o-y) | 5.7 | 4.9* | | Real GDP growth | 9.4 | 6.8 | | Gross domestic saving (per cent of GNDI) | 29.5 | 29.8 | | Gross capital formation (per cent of GDP) | 30.0 | 30.7 | | Credit growth of scheduled commercial banks | 7.5 | 8.1 | | Combined gross fiscal deficit (per cent of GDP) | 10.5 | 9.0 | | Central government gross fiscal deficit (per cent of GDP) | 6.8 | 5.6 | | Repo rate (end-period) | 4.0 | 4.25* | | Yield on 91-days treasury bills (end-period) | 3.8 | 4.3 | | Yield on 10-year central government securities (end-period) | 6.4 | 6.6 | | Overall balance of payments (US$ billion) | 50.6 | 35.0 | | Merchandise exports growth | 30.0 | 8.0 | | Merchandise imports growth | 36.1 | 9.1 | | Current account balance (per cent of GDP) | -0.7 | -1.1 | *: Q2:2022-23.
Note: GNDI: Gross National Disposable Income.
Sources: RBI staff estimates; and Survey of Professional Forecasters (September 2021). | I.4 Balance of Risks The baseline projections of inflation and growth presented in the previous sections are premised on the assumptions relating to key domestic and international macroeconomic and financial conditions set out in Table I.2. The inherent uncertainties around these assumptions, exacerbated by COVID-19 and its variants, have a significant bearing on the inflation and growth trajectories. Some plausible alternative scenarios to assess the balance of risks around the baseline projections are presented in this section. (i) Global Growth Uncertainties While the global growth outlook has been upgraded relative to the April MPR, it remains highly susceptible to COVID-19’s trajectory in view of the uneven spread of vaccination across countries and more contagious new variants of the virus, apart from volatility in global commodity prices and the elevated uncertainty over US monetary policy normalisation. First, continuing global supply chain disruptions are adversely impacting production in several manufacturing activities and could dampen global growth more than currently anticipated with additional headwinds from the steep increase in natural gas prices in recent weeks. Second, a slowing Chinese economy may drag down external demand. Third, if the inflationary pressures emanating from the demand-supply bottlenecks in the US and other AEs were to turn out to be persistent, it could trigger an earlier exit than currently being telegraphed from the accommodative policies in the major AEs, induce large financial market volatility and pose downside risks to global growth. Fourth, an escalation of geo-political tensions remains a potential source of downside risk to global growth. In such a scenario, if the global recovery slips by 100 bps below the baseline, domestic growth and inflation could be lower by around 40 bps and 30 bps, respectively. Conversely, a more widespread and equitable distribution of vaccines across the world, sustained success in containing the spread of new mutants, faster resolution of logistic bottlenecks, and the spike in inflation in major AEs reversing quickly could boost global economic activity. In such a scenario, assuming that global growth surprises by 100 bps on the upside, domestic growth and inflation could edge higher by around 40 bps and 30 bps, respectively (Charts I.11a and I.12a). (ii) International Crude Oil Prices International crude oil prices have firmed up amidst elevated volatility with the gradual resumption in economic activity, improvement in global demand and calibrated output normalisation by the OPEC plus. The supply-demand dynamics in the global oil market are subject to several uncertainties. On the supply side, shortfall in the OPEC plus production and rise in geo-political tensions could constrain supply and increase oil prices above the baseline. On the demand side, a better containment of COVID-19 infections could induce higher global growth, a faster closing of the global output gap and a sharper increase in international crude oil prices. Assuming crude oil prices to be 10 per cent above the baseline (Table I.2), domestic inflation could be higher by 30 bps and growth weaker by around 20 bps over the baseline. Conversely, crude oil prices could soften below the baseline if the global recovery is more subdued owing to a faster spread of virus mutations, delays in vaccination or improved supplies of shale gas. In this scenario, if the price of the crude falls by 10 per cent relative to the baseline, inflation could ease by around 30 bps with a boost of 20 bps to growth (Charts I.11a and I.12a). (iii) Exchange Rate The INR has exhibited two-way movements over the past six months, reflecting both global and domestic factors. The divergent paths of recovery across AEs and EMEs and the risk of currently elevated inflation in AEs acquiring a more structural character could necessitate an early exit from ultra-accommodative monetary policies by the AE central banks. The resultant heightened volatility in global financial markets could lead to a generalised risk aversion to EMEs assets, capital outflows and downward pressures on their currencies (Box I.1). A 5 per cent depreciation of INR from the baseline (Table I.2) in such a scenario could increase domestic inflation by up to 20 bps, while GDP growth could be higher by 15 bps through a boost to exports. On the other hand, given India’s relatively better growth outlook, boost to growth from the expanding scale of vaccination and reform measures by the government to attract foreign capital, INR could appreciate. In such a scenario, if the INR appreciates by 5 per cent relative to the baseline, inflation and growth could moderate by around 20 bps and 15 bps, respectively (Charts I.11b and I.12b). 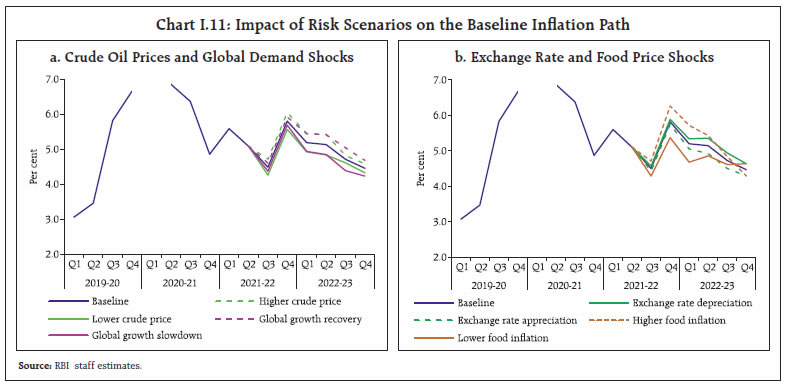
Box I.1: Capital Flow and Exchange Rate Shocks: Macroeconomic Implications Capital flows to EMEs ease external financing constraints and help to increase domestic investment and growth. On the other hand, such flows are often volatile and prone to sudden stops and reversals, causing disorderly movements in the exchange rate that can feed into domestic inflation and output. These effects are amplified by interactions with equity and bond markets and derivative positions. Furthermore, undesirable and unintended fluctuations in liquidity resulting from volatile capital flows can vitiate the monetary policy stance (Das, 2021). The macroeconomic implications of capital flows for the Indian economy can be analysed through the Quarterly Projection Model (QPM)6 (RBI, 2021) under alternative scenarios. In Scenario 1, the central bank allows the impact of capital flows to be borne out fully by the exchange rate with no monetary action. In Scenario 2, movements in the exchange rate pass through into inflation, causing a deviation of inflation from the target that prompts monetary policy action. Alternatively, the central bank may resort to a judicious combination of forex intervention and sterilisation, exchange rate adjustment and monetary policy action (Scenario 3) to contain the impact of the volatility in capital flows on the domestic economy. 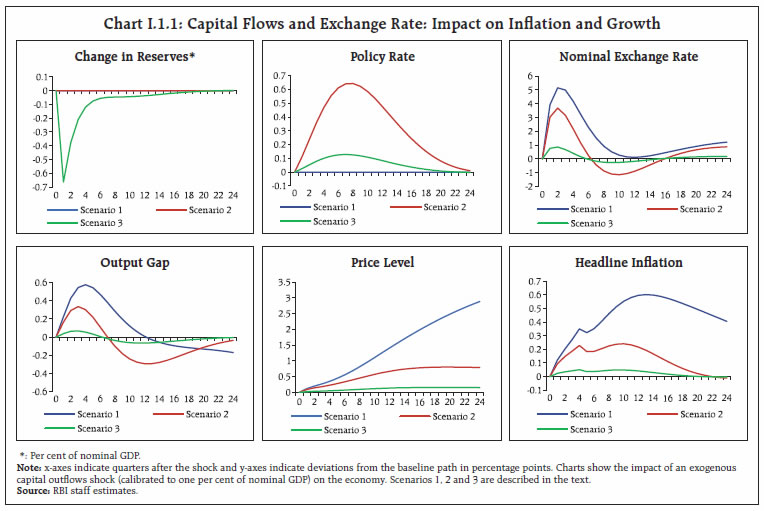 In Scenario 1, there is a sustained deviation of inflation from the target (Chart I.1.1). Inflation deviations are relatively contained in scenario 2 but this comes at the cost of volatility in output because monetary policy is calibrated to bring inflation back to the target. Scenario 3, which involves forex intervention and sterilisation, helps to insulate the domestic economy from the capital flows shock, with only marginal impact on inflation and output. This policy combination reduces volatility in the forex market and helps the central bank to pursue a relatively more accommodative monetary policy in support of growth. The Reserve Bank of India undertakes two sided interventions in the spot, forward and futures markets to stabilise financial markets and liquidity conditions so that monetary policy retains its domestic orientation and the independence to pursue national objectives. References: Das, Shaktikanta (2021), “Governor’s Statement”, June 4, 2021, Reserve Bank of India. Reserve Bank of India (2021), Monetary Policy Report, April 2021. | (iv) Food Inflation Food inflation moderated in July-August from the recent peak in June 2021, driven largely by the deepening deflation of vegetable prices. Inflation in edible oil prices, however, remains substantially elevated at 33.0 per cent in August. The expectations of record kharif foodgrains production and large buffer stocks for cereals augur well for food prices. These developments along with continued effective supply management of key food items and easing of international food prices could soften headline inflation by around 50 bps. Conversely, a further hardening of international food prices, demand-supply imbalances in some food items and unseasonal rainfall could exert upward pressure on headline inflation by around 50 bps (Charts I.11b and I.12b). I.5 Conclusion Domestic economic activity is normalising after the ferocious second wave retarded momentum. The outlook remains overcast by the future path of the pandemic; however, the accelerated progress in the pace of vaccination, release of pent-up demand in the upcoming festival season, boost to investment activity from the government’s focus on infrastructure and asset monetisation, and accommodative monetary and liquidity conditions provide an upside to the baseline growth path. While the inflation trajectory is expected to be driven by supply-side factors and risks are to the upside, a faster resolution of global as well as domestic supply chain disruptions, softer international crude oil and food prices as pent-up demand normalises, and another round of good foodgrains production and effective supply management, could cause inflation to undershoot the baseline, contingent on the evolution of the pandemic and the efficacy of vaccines. __________________________________________________________________________________
II. Prices and Costs Consumer price index (CPI) inflation remained highly volatile during March-August this year – after moderating close to the target rate in April, it rose abruptly to breach the upper tolerance threshold during May-June with a sharp pickup in food, fuel and core inflation and moderated in July-August on substantial softening in food inflation. Costs of farm and non-farm inputs remained elevated. Nominal rural wages for both agricultural and non-agricultural labourers were stagnant while staff costs in the organised sector rose. Since the publication of the April 2021 MPR, headline CPI inflation1 that had fallen close to the target rate of 4.0 per cent in April, sprang back amidst the second wave of intense infections to breach the upper tolerance threshold and touched 6.3 per cent during May-June 2021.2 This unanticipated spike came from a sharp pick-up in food and core (CPI excluding food and fuel3) inflation which peaked peaked at 6.6 per cent in May 2021 – the highest since May 2014, and fuel inflation which at 12.6 per cent in June 2021 was the then highest recorded in the CPI series. In the following months, however, inflation quickly moderated by one percentage point to 5.3 per cent by August on a substantial softening in food inflation even as fuel infation scaled another high and core inflation remained sticky and elevated. On the whole, CPI inflation has been highly volatile in the five months of the current financial year – moving within a wide range of 4.2 per cent to 6.3 per cent – averaging 5.5 per cent (Chart II.1). The Reserve Bank of India (RBI) Act enjoins the RBI to set out deviations of actual inflation outcomes from projections, if any, and explain the underlying reasons thereof. The April 2021 MPR had projected range-bound movement in CPI inflation – an average of 5.0 per cent in Q4:2020-21 to 5.2 per cent in Q1 and Q2 of 2021-22. Actual inflation for Q1:2021-22 at 5.6 per cent and Q2:2021-22 (July-August) at 5.4 per cent turned out to be higher than the projections by 35 bps and 27 bps, respectively (Chart II.2). 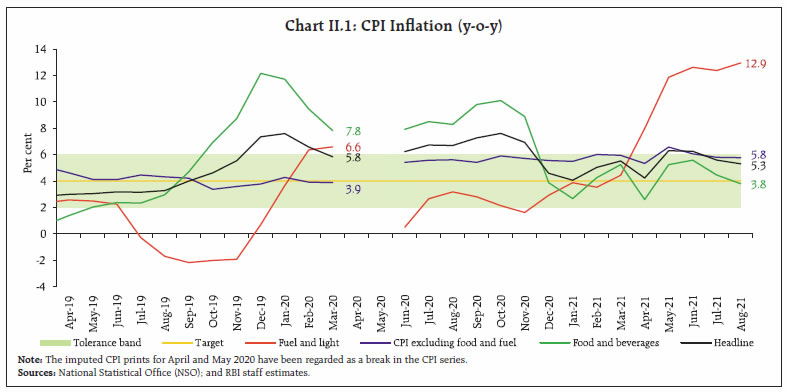 A number of factors impinging on food, fuel and core contributed to this overshoot. First, the rapid spread of COVID-19’s second wave at the start of 2021-22 resulted in restrictions on activity being imposed over a large swath of the country. These restrictions, in turn, resulted in transitory price pressures in Q1, especially in May, through supply-chain disruptions, elevated retail margins as well as from difficulties in accurate price measurements due to localised lockdowns and restrictions on non-essential commercial activities in several states.4 As restrictions eased and activity normalised, the effects of these factors dissipated from June. Second, the unanticipated surge in global energy prices kept petrol and diesel inflation firmly in double digits. The April 2021 MPR had assumed an Indian basket crude oil price of US$ 64.6 per barrel during 2021-22; however, crude oil prices edged up to a peak level of US$ 75 per barrel in early July before moderating to US$ 70 per barrel by end-August. Third, there was an extraordinary surge in international edible oil prices which fed into domestic inflation formation.5 Fourth, the persistence of industrial input and transport cost pressures and subsequent transmission to selling prices of manufactured goods was more than what was anticipated, in spite of demand conditions weakening due to the second wave. 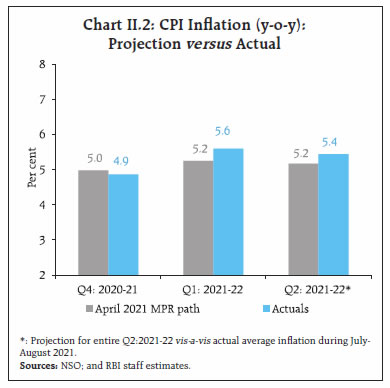 II.1 Consumer Prices A dip in inflation to 4.2 per cent in April 2021 was overwhelmed in May 2021 by a sharp pick up in price momentum6 spanning across food, fuel and core groups, resulting in a surge in inflation by 2.1 percentage points to 6.3 per cent. In June, headline inflation plateaued, with positive price momentum completely neutralised by a favourable base effect which became even larger in July and more than offset the broad-based price momentum taking down headline inflation to 5.6 per cent in July. With overall price momentum registering a sharp deceleration in August, coming from a steady food price index, headline inflation moderated further to 5.3 per cent (Chart II.3). The distribution of CPI inflation during January- August 2021 varied distinctly from the pattern in the past few years. There has been a shift in the mean of the distribution from 3.4 per cent for 2017- 2019 (January-August) to 5.3 per cent in 2021 so far (Chart II.4). This was accompanied by an increase in volatility – with the standard deviation in 2021 more than two times that of 2017-2019 – and positive skewness, compared to a negative skew for the 2017-2019 period. These indicate high dispersion of inflation rates in the CPI basket, along with a larger number of items experiencing higher inflation rates than in the pre-pandemic period. The positive skew reflected outlier double-digit inflation in the CPI distribution, primarily on account of oils and fats.
During April-August 2021, 8 of the 23 sub-groups in CPI with a cumulative weight of 49.7 per cent contributed 82.7 per cent of CPI inflation, much higher than their contribution of 56.2 per cent in 2020-21 (Table II.1). | Table II.1: Contribution of CPI sub-groups to Headline CPI Inflation | | Sr. No. | Commodity | Weight | FY 2020-21 (June-March)* | FY 2021-22 (April-August) | | Average inflation (y-o-y, per cent) | Average contribution (per cent) | Average inflation (y-o-y, per cent) | Average contribution (per cent) | | 1 | Oils and fats | 3.56 | 16.8 | 9.1 | 31.4 | 18.3 | | 2 | Transport and communication | 8.59 | 10.6 | 13.4 | 11.1 | 15.6 | | 3 | Fuel and light | 6.84 | 2.8 | 3.3 | 11.6 | 13.4 | | 4 | Health | 5.89 | 5.4 | 5.7 | 7.9 | 8.6 | | 5 | Meat and fish | 3.61 | 16.0 | 10.8 | 9.6 | 8.0 | | 6 | Housing | 10.07 | 3.2 | 5.8 | 3.8 | 7.2 | | 7 | Prepared meals, snacks, sweets etc. | 5.55 | 4.5 | 4.7 | 5.6 | 6.0 | | 8 | Clothing | 5.58 | 3.4 | 3.4 | 5.7 | 5.7 | | | Total | 49.69 | 6.8 | 56.2 | 9.4 | 82.7 | | | CPI-Combined | 100.00 | 6.1 | 100.0 | 5.5 | 100.0 | * The imputed CPI prints for April and May 2020 have been regarded as a break in the CPI series.
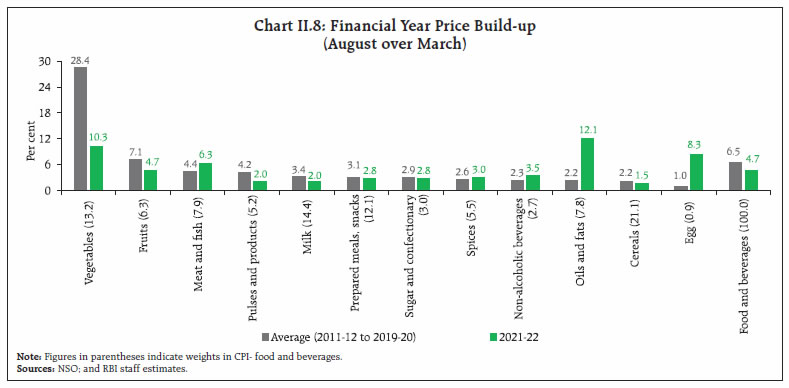
Sources: NSO; and RBI staff estimates. | The non-seasonally adjusted diffusion indices of price changes7 remained elevated (barring for services in June), indicative of price increases being broad-based across the CPI basket (Chart II.5).8 II.2 Drivers of Inflation The role of various factors impinging upon inflation dynamics can be captured through vector autoregression (VAR) estimates and historical decomposition.9 Inflationary pressures in Q1:2021-22 can be attributed to adverse supply shocks, firming up of asset prices and easy monetary conditions, even as muted demand conditions contributed to a softening of inflationary pressures. By Q2:2021-22 some softening in inflationary pressures came about from softening of wage pressures (Chart II.6a). 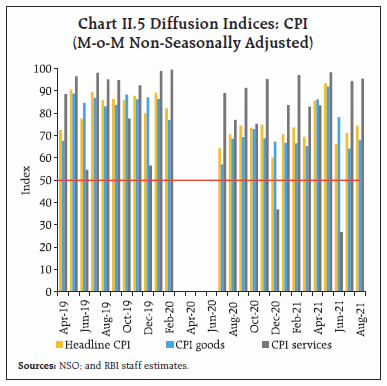 In terms of contribution of goods and services to headline inflation, the pick-up in inflation in June 2021 emanated from perishables – edible oils, fruits and vegetables – and semi-perishable goods (non-durable goods with a 30-day recall10) like LPG, kerosene, petrol, diesel, medicines and fast-moving consumer goods (FMCGs). In July-August, the contribution of perishables to headline inflation registered a sharp moderation, even as the contributions of semi-perishables, durables and services to headline inflation were largely steady (Chart II.6b). Some of the stickiness in semi-perishables and durables goods inflation reflected the transmission of high international prices. The surge in international prices of edible oil, silver and petroleum products resulted in an increase in the contribution of imported components to headline inflation – from 0.8 percentage points in February to a peak level of 1.9 percentage points in June before moderating to 1.4 percentage points in August 2021 (Chart II.6c). Food Group Food and beverages inflation treaded within a range of 2-6 per cent during March-August 2021 and on an average contributed around 37.2 per cent of headline inflation (CPI food has a weight of 45.9 per cent in the CPI basket). Elevated international prices of edible oils along with price pressures in protein rich items remained the major drivers (Chart II.7). The summer uptick in vegetables prices during May-July 2021 led to an increase in price pressures, while a decline in prices of cereals, protein-based food and fruits along with a sharp deceleration in vegetable price momentum in August 2021 provided relief dragging down food inflation to 3.8 per cent. Overall, the food price build-up in the financial year so far has been lower than historical patterns, even as price build-ups in oils and fats, eggs, meat and fish, non-alcoholic beverages and spices were higher than their long-term averages (Chart II.8). Excluding vegetables, during April-August 2021, food and headline inflation would have averaged 6.3 per cent and 6.5 per cent respectively, as against an overall average rate of 4.3 per cent for food and 5.5 per cent for headline. Prices of cereals (weight of 9.7 per cent in the CPI and 21.1 per cent in the food and beverages group) remained in deflation during March-August 2021, primarily reflecting favourable base effects and muted momentum. Within cereals, both rice and wheat witnessed subdued price pressures (barring May 2021) on the back of ample buffer stocks relative to norms (2.7 times and 1.8 times for rice and wheat, respectively, as on September 16, 2021) and distribution under Pradhan Mantri Garib Kalyan Anna Yojana (PMGKAY). In May 2021, restrictions on activity across many states affected supply chains leading to a pick up in prices. Moreover, production remained robust, with an increase of 2.9 per cent for rice and 1.5 per cent for wheat (as per the 4th Advance Estimates (AE) 2020-21) over 2019-20 Final Estimates (FE). 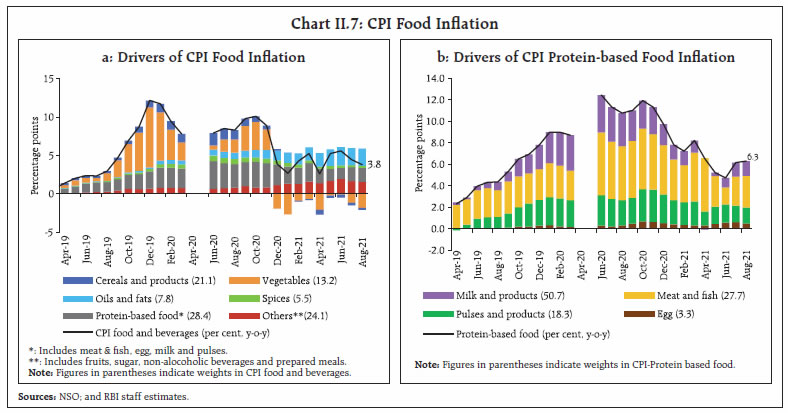
 In the case of vegetables (weight of 6.0 per cent in the CPI and 13.2 per cent in the food and beverages group), prices remained in deflation during March-August 2021 (Chart II.9), reflecting, inter alia, favourable base effects. The three key vegetables – tomatoes, onions and potatoes – largely witnessed price increases during May-July 2021 less than the usual summer uptick. While prices of potatoes and onions eased in August 2021, tomato prices picked up due to lower supply in the markets as the lean period set in. Crop damage due to heavy rains and flood like situations in major tomato producing states such as Andhra Pradesh and Karnataka also impacted mandi arrivals. After moderating during March-May 2021, onion prices edged up subsequently, reflecting the seasonal uptick as well as damage to stored rabi onions in Maharashtra and Gujarat due to cyclone Tauktae. Potato prices were in deflation during June-August 2021, reflecting favourable base effects and easing of prices in August 2021 with higher production (10.6 per cent in 2020- 21) in response to elevated prices observed in the previous year, and higher cold storage stocks in major producing states. On the whole, as noted earlier, the price build-up in vegetables remained lower than their historical average in the financial year so far, reflecting the recovery of production (higher by 4.2 per cent in 2020-21 2nd AE compared to 2019-20 FE). 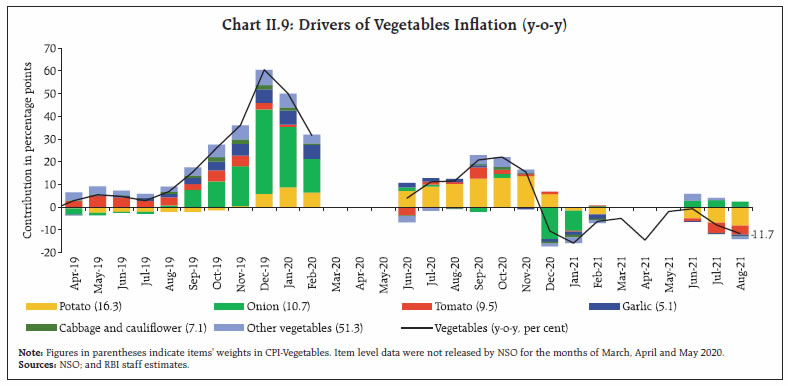 In a rapidly changing scenario where volatility in prices of key vegetables has substantial fallout on headline inflation, there is a need for real time monitoring of price situation, especially in case of perishables. Price sentiment derived from unstructured data contained in news articles can provide useful leading information on prices (Box II.1). Box II.1: News Sentiment-based Analysis of Food Inflation Outlook Strengthening market intelligence on high-impact food items is an integral element in inflation forecasting framework of the Reserve Bank. Newspaper articles provide information on local events that may lead to large swings in nation-wide retail food prices. Unstructured textual data in news items can be processed and quantified using text-mining techniques to analyse the nature of shocks and inflation dynamics. Three main vegetables viz., tomatoes, onions and potatoes (TOP), with a combined weight of 2.2 per cent in the CPI, have high contribution to variance in food price inflation (Chart II.1.1). 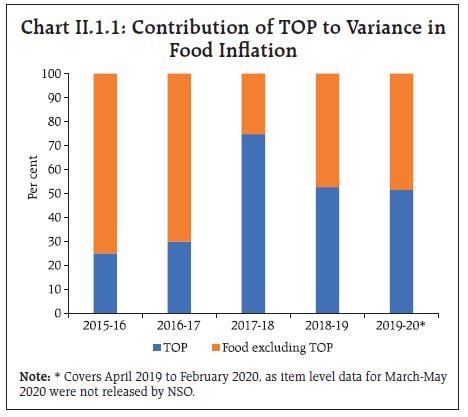
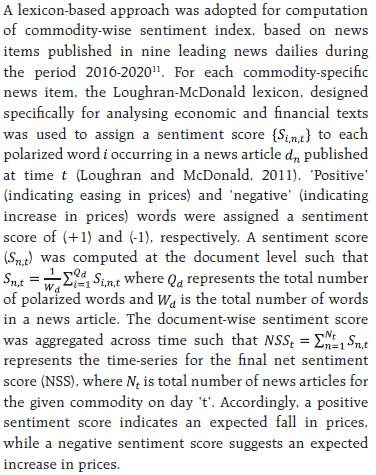
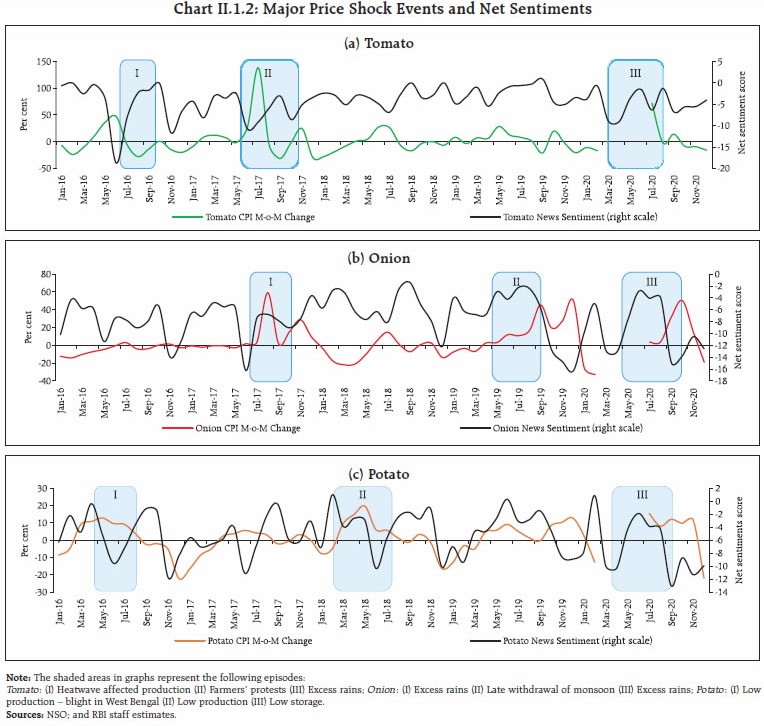 Monthly net sentiment score of TOP and changes in their prices as reflected in CPI show a negative relationship between them, as expected (Chart II.1.2). Large increases in TOP prices seen after major supply shocks coincide with large fall in sentiment related to each of the three commodities. Sentiments were found to ‘Granger cause’ change in prices, implying the predictive power of news-based sentiment in capturing future price movements of TOP. The results show that NSS can provide forward-looking information for price movements in TOP (up to 30 days as per the Granger causality test), which could be useful for nowcasting of food price inflation. References: Ardia, D., Bluteau, K., Borms, S., and Boudt, K. (2021). The R Package Sentometrics to Compute, Aggregate and Predict with Textual Sentiment. Journal of Statistical Software, 99(2). Loughran, T., and McDonald, B. (2011). When is a Liability not a Liability? Textual Analysis, Dictionaries, and 10- Ks. The Journal of Finance, 66(1), 35-65. | Despite pulses production of 257.2 lakh tonnes during 2020-21, an increase of 11.7 per cent over 2019-20 – augmenting domestic supply and overall stocks, factors like localised lockdowns in the second wave resulted in supply chain driven demand-supply gaps, accentuated by lower arrival of imports and precarious stock positions in the case of masur (Chart II.10). To address the tight demand supply situation, the government undertook several supply side initiatives such as imposing stock limits in July 2021 on some pulses under the Essential Commodities Act, 1955, easing import restrictions to enhance domestic availability of tur, urad and moong, a memorandum of understanding (MoUs) with Myanmar, Malawi and Mozambique for pulses imports, and reducing basic import duty and Agriculture Infrastructure and Development Cess (AIDC) on masur to 0 per cent12 and 10 per cent, respectively. Inflation in meat, fish and eggs witnessed upside pressures during March-July 2021 primarily reflecting feed cost pressures and transportation costs (Chart II.11a). Prices of key items such as eggs, chicken, mutton and fish surged as a consequence of several factors – increase in soybean meal prices (international soybean meal prices increased by 32.3 per cent in July 2021 compared to July 2020); restricted operations of the poultry industry during the second wave; festive demand in July 2021; damage of fishing boats owing to cyclones Tauktae and Yaas; higher fuel prices and the annual ban on fishing in the west coast during monsoons. However, prices eased in August 2021 reflecting seasonal fall in demand during the month of sravana. In the case of milk and products (weight of 6.6 per cent in the CPI and 14.4 per cent in the food and beverages group), a lean season of production coincided with upward revision in retail prices by ₹2 per litre by major milk co-operatives like Amul and Mother Dairy in July 2021 which was followed by many other state milk co-operatives such as Milkfed in Punjab, Gokul in Maharashtra and Parag in Uttar Pradesh, resulting in price pressures in July 2021. Milk cooperatives have cited various reasons for increase in input costs such as cost of transport, feed prices and operational costs of processing and packaging. However, post July 2021, no increase in retail milk prices by other milk cooperatives has been reported. 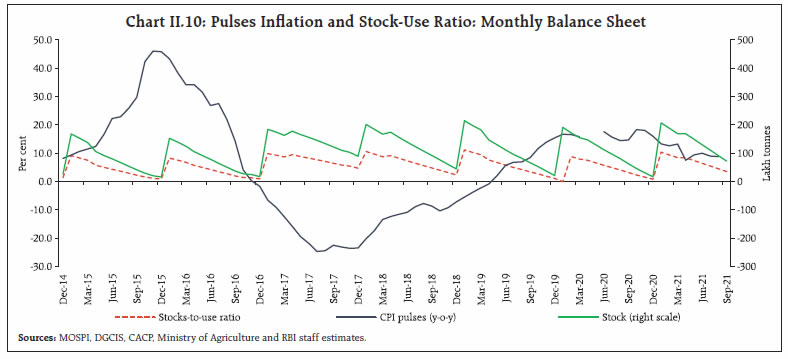 Inflation in oils and fats experienced price pressures in the post-lockdown period and shot up to an all-time high of 34.8 per cent in June 2021, mirroring elevated international edible oil prices (Chart II.11b). Prices fell in July 2021 in response to the supply side measures announced by the government, before showing some uptick in August to 33.0 per cent. Global palm oil prices escalated due to labour shortage in Malaysia and adverse weather conditions leading to lower than expected production and high export duties on crude palm oil. A number of measures were taken to alleviate price pressures, including reduction in import duty on crude and refined palm oil from 15.0 per cent to 10.0 per cent (effective rate reduced from 35.75 per cent to 30.25 per cent) and 45.0 per cent to 37.5 per cent (effective rate reduced from 49.5 per cent to 41.25 per cent), respectively; mechanism for speedy clearance of crude palm oil at shipping ports and placing the imports of Refined Bleached Deodorized (RBD) palm oil and RBD palmolein under free category from restricted category effective from June 30, 2021 and applicable till December 31, 2021. Further, effective September 11, 2021, import duty on crude and refined palm oil was reduced from 10 per cent to 2.5 per cent (effective rate reduced from 30.25 per cent to 24.75 per cent) and 37.5 per cent to 32.5 per cent (effective rate reduced from 41.25 per cent to 35.75 per cent), respectively. However, price pressures continued in the domestic market (barring in July 2021) as Malaysia increased its export reference price for July 2021, maintaining its export duty at the highest rate of 8.0 per cent. To control domestic edible oil prices, import duty on crude soybean and sunflower oil were reduced from 15.0 per cent to 7.5 per cent, effective August 20, 2021 and it was further reduced to 2.5 per cent from September 11, 2021. Similarly, import duty on refined soybean and sunflower oils was reduced from 45.0 per cent to 37.5 per cent and further to 32.5 per cent with the same effective dates. To attain self-sufficiency in production of edible oil, the Government announced a National Mission on Edible Oil - Oil Palm (NMEO-OP) with an investment of over ₹11,000 crore and assured farmers access to all facilities, from quality seeds to technology. 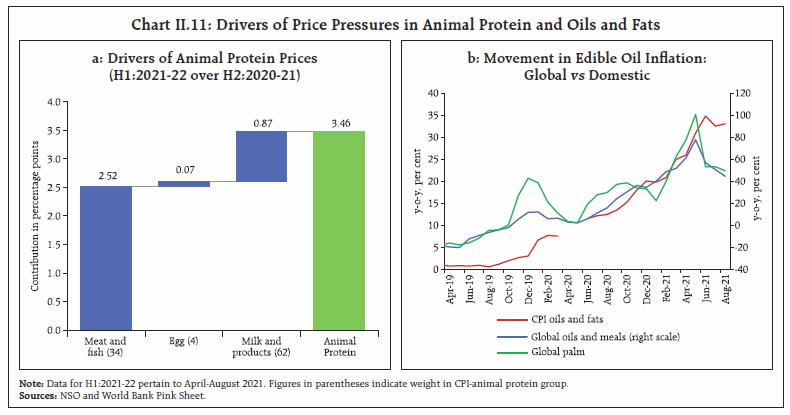 Price of sugar and confectionery (weight of 1.4 per cent in the CPI and 3.0 per cent in the food and beverages group) remained in deflation during March- August 2021, except for June 2021, due to higher domestic availability as a result of robust production (sugarcane production rose by 7.8 per cent in 2020-21 4th AE over 2019-20 FE) and export subsidy for sugar export under MAEQ (Maximum Admissible Export Quota) being reduced to ₹4000 per tonne from ₹6000 per tonne, effective May 20, 2021. Among other items in the CPI food group, prices firmed up in the case of non-alcoholic beverages and prepared meals, reflecting increase in input costs. Retail Margins Retail price margins, defined as the difference between retail and wholesale prices for four major sub-groups – cereals, pulses, vegetables and edible oil – have shown divergent movements.13 The margins in case of edible oils, pulses and cereals have risen unceasingly, since the first wave of the COVID-19 pandemic. Margins in case of vegetables are back to the usual seasonal pattern in absence of any major supply side disturbance (Chart II.12). CPI Fuel Group CPI fuel inflation surged from 4.4 per cent in March 2021 to 12.6 per cent in June 2021 before showing a transitory dip in July. In August 2021, fuel inflation touched an all-time high of 12.9 per cent (Chart II.13a). The year-on-year price changes in LPG and kerosene (PDS) during June-August 2021 were one of the highest recorded in the current CPI series. Market prices of crude and various oil-based fuels have firmed up through the waves of the pandemic pulling up kerosene and LPG fuel prices (Chart II.13c). The contribution of fuel items of rural consumption like firewood and chips was also substantial during June- August 2021 (Chart II.13b and II.13c). CPI excluding Food and Fuel CPI core inflation, i.e. CPI inflation excluding food and fuel, remained elevated and sticky in the financial year so far, reflecting persistent cost-push pressures even as demand conditions remained sluggish. Core inflation, from a peak level of 6.6 per cent in May, moderated to 6.1 per cent in June and to 5.8 per cent during July-August. Excluding petrol and diesel, it has also remained sticky in the range of 5.1-5.5 per cent throughout the pandemic period (Table II.2). 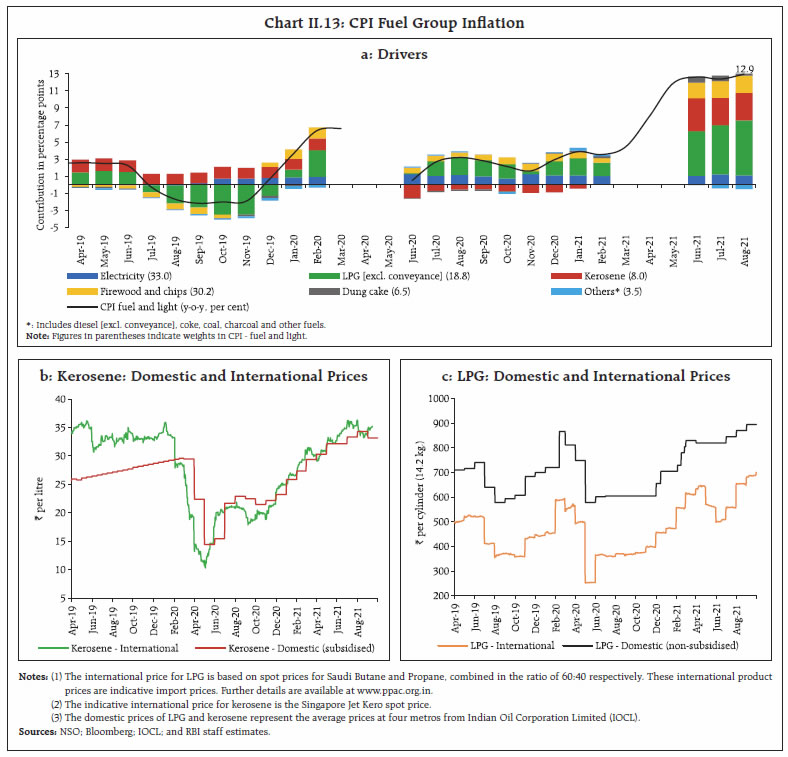
| Table II.2: Exclusion-based Measures of Inflation (y-o-y) | | Period | CPI excluding food and fuel (47.3) | CPI excluding food, fuel, petrol and diesel (45.0) | CPI excluding food, fuel, petrol, diesel, gold and silver (43.8) | | Jun-19 | 4.1 | 4.6 | 4.6 | | Sep-19 | 4.2 | 4.9 | 4.5 | | Dec-19 | 3.8 | 3.7 | 3.3 | | Mar-20 | 3.9 | | | | Jun-20 | 5.4 | 5.3 | 4.6 | | Sep-20 | 5.4 | 5.2 | 4.5 | | Dec-20 | 5.6 | 5.3 | 4.7 | | Jan-21 | 5.5 | 5.2 | 4.7 | | Feb-21 | 6.0 | 5.5 | 5.1 | | Mar-21 | 5.9 | | | | Apr-21 | 5.3 | | | | May-21 | 6.6 | | | | Jun-21 | 6.1 | 5.3 | 5.4 | | Jul-21 | 5.8 | 5.1 | 5.3 | | Aug-21 | 5.8 | 5.1 | 5.5 | Note: (1) Figures in parentheses indicate weights in CPI.
(2) Derived as residual from headline CPI.
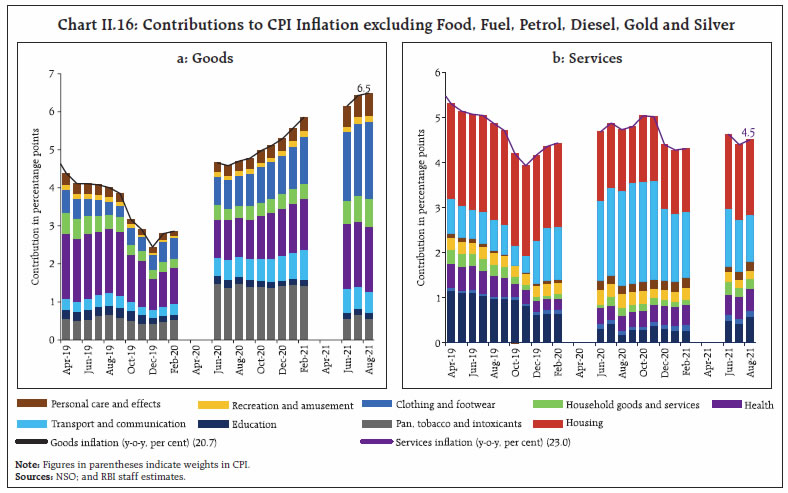
Sources: NSO; and RBI staff estimates. | In term of sub-groups, transport and communication, clothing and footwear and health accounted for more than 60 per cent of core inflation (weight of these sub-groups is around 45 per cent in the core CPI). On the other hand, the contributions of housing and education sub-groups to core inflation in the financial year so far have been lower than in the pre-pandemic period (Chart II.14). Overall, goods inflation is driving the core, with petrol and diesel (under the transportation and communication sub-group) registering double digit inflation consecutively since July 2020. Even as the one-off effects of indirect taxes instituted in the post-lockdown period waned from June 2021, the sustained increase in international crude oil prices – by around 104 per cent between end-May 2020 and end-August 2021 – has kept petrol and diesel inflation firm at 23.8 per cent in August. This was starkly evident in the WPI which excluded indirect tax effects; WPI petrol and diesel inflation was at 54.2 per cent in August (Chart II.15a). Petrol pump prices were at historic highs in early 2021 and breached ₹100 per litre by July 2021, with attendant implications for overall cost conditions in the economy (Chart II.15b). 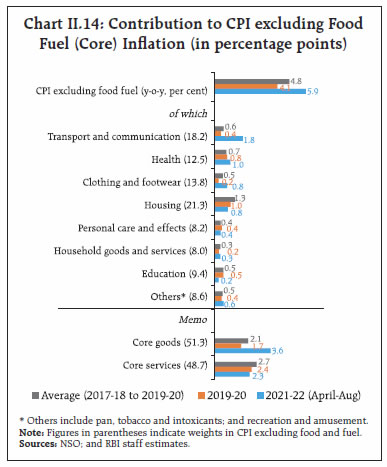 After abstracting the effects of generally volatile items, i.e., food, fuel, petrol, diesel, gold and silver, core inflation rose from 5.1 per cent in February to 5.5 per cent in August, attesting to persistence (Table II.2). A decomposition of CPI excluding food, fuel, petrol, diesel, gold and silver into goods and services components points to contrasting movements. Inflation in the goods component (with a weight of 20.7 per cent in CPI) has been undergoing consecutive increases from August 2020, reaching 6.5 per cent in August 2021. This was driven primarily by clothing and footwear, health care – particularly medicines – household goods like utensils, washing soap/ powder, furniture, personal care items and toiletries (Chart II.16a). On the other hand, services inflation (with a weight of 23.0 per cent in CPI) which was at 4.3 per cent in February, firmed up moderately to 4.5 per cent in August 2021. The contribution of services, on an average, to core inflation was somewhat lower than what was seen in the pre-pandemic period (Chart II.14). A recovery in housing rentals along with rising education services inflation from the post-lockdown historic lows are the key drivers for the uptick in core services inflation between February and August 2021, apart from medical as well as household services (Chart II.16b). 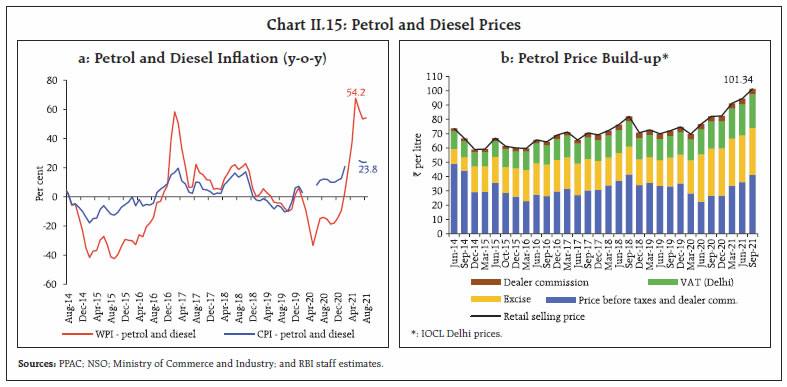
 In order to filter noise from CPI inflation and get to the underlying inflation dynamics two common approaches are (i) excluding a fixed set of components from the CPI basket that display volatile price movements and are likely to be transitory; and (ii) excluding different components each month if they are located in the tails of the inflation distribution. The exclusion-based measures show heightened inflationary pressures over the last six months with no decisive signs of softening (Table II.2). Inflation measured by trimmed means, on the other hand, shows some edging down of the underlying inflation pressures in August from the June-July peak (Table II.3). Other Measures of Inflation Over the last 14 months, inflation in sectoral CPIs for agricultural labourers (CPI-AL) and rural labourers (CPI-RL) has remained below CPI headline inflation. Lower food inflation, paired with their higher weights in CPI-AL and CPI-RL contributed to the lower CPI-AL and CPI-RL inflation prints. Inflation in terms of the CPI for industrial workers (CPI-IW) fell below the headline during May-August 2021. WPI inflation registered sharp increases sequentially between February and May 2021 to touch an all-time high of 13.1 per cent (as per the WPI series, 2011-12=100) in May from a sharp and broad-based upsurge in price momentum in an environment of adverse base effects. WPI inflation moderated in June and July 2021, despite positive price pressures, owing to base effects turning favourable, although it remained in double digits. In August, WPI inflation reversed course and edged up to 11.4 per cent primarily on account of an increase in non-food manufactured products inflation, despite softening of food inflation. In line with WPI inflation, the deflators for gross value added (GVA) and gross domestic product (GDP) edged up sharply between Q3:2020-21 to Q1:2021-22. | Table II.3: Trimmed Mean Measures of Inflation (y-o-y) | | Period | 5% trimmed | 10% trimmed | 25% trimmed | Weighted Median | | Jun-19 | 3.0 | 3.1 | 3.0 | 2.8 | | Sep-19 | 3.3 | 3.2 | 3.1 | 2.8 | | Dec-19 | 4.4 | 4.0 | 3.7 | 4.0 | | Mar-20 | | | | | | Jun-20 | 5.8 | 5.4 | 5.1 | 4.9 | | Sep-20 | 6.2 | 5.6 | 4.7 | 5.1 | | Dec-20 | 5.6 | 5.1 | 4.3 | 4.0 | | Jan-21 | 5.0 | 4.8 | 4.0 | 3.6 | | Feb-21 | 5.1 | 4.9 | 4.1 | 3.7 | | Mar-21 | | | | | | Apr-21 | | | | | | May-21 | | | | | | Jun-21 | 5.7 | 5.2 | 5.0 | 5.2 | | Jul-21 | 5.8 | 5.3 | 5.0 | 4.6 | | Aug-21 | 5.5 | 5.1 | 4.9 | 4.3 | | Sources: NSO; and RBI staff estimates. | WPI inflation has averaged 11.7 per cent during April- August 2021, remaining markedly above CPI inflation (average of 5.5 per cent) (Chart II.17a). Inflation in petroleum products – especially petrol and diesel – eggs and edible oils diverged considerably between the CPI and the WPI (Chart II.17b). These developments have again brought to fore the possibility of transmission of WPI inflation to the CPI and their long-run relationship (Box II.2). 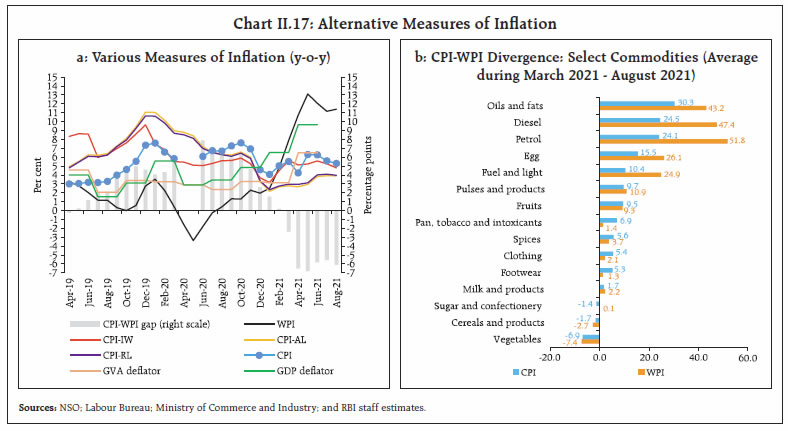
Box II.2: CPI-WPI Inflation Post-Lockdown: Long-run Cointegration and Short-run Error Correction Since the onset of the pandemic in 2020, consumer price and wholesale price inflation rates have been exhibiting considerable divergence, the wedge widening to 6.1 percentage points in August 2021 (Chart II.2.1). This brought to fore the concern – will elevated WPI inflation feed into CPI? Recent studies have shown that over time and through the course of the pandemic the sensitivity of CPI inflation to WPI inflation has come down (RBI, 2021). An analysis based on CPI and WPI for the period, April 2012-July 2021, shows that a long-run relationship exists between CPI and WPI14. The speed of adjustment is low. The CPI food index and the WPI food index are cointegrated as well as homogeneous, i.e., they move one-on-one in the long term. CPI core and WPI core are also found to be cointegrated but the long run coefficient is less than one. While WPI core largely comprises of basic and intermediate industrial inputs that do not find representation in CPI, CPI core comprises of household goods and services, including housing service, that are not part of WPI (Das and George, 2017). WPI and CPI fuel groups, on the other hand, are not cointegrated (Table II.2.1). 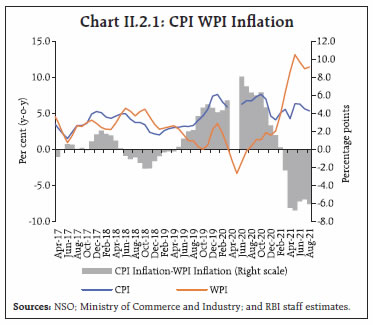
| Table II.2.1: Cointegration and VECM Estimates for CPI and WPI by Major Groups | | | Overall | Food@ | Fuel@ | Core@ | Johansen Cointegration Test Trace Statistic
H0: No Cointegrating Equation (p-value)#
Number of cointegrating vectors | 33.00***
(0.005)
1 | 26.74***
(0.005)
1 | 2.74
(0.97)
0 | 30.83**
(0.01)
1 | | Long-run equation | In(CPI)t = 2.90 + 0.38** In(WPI)t + 0.002*** t | In(CPI)t = 0.04 + 1.00*** In(WPI)t | Not Applicable | In(CPI)t = 3.52 + 0.24** In(WPI)t + 0.003*** t | Homogeneity
H0: Long run coefficient =1 (p-value) | (0.000)*** | (0.989) | Not Applicable | (0.000)*** | | Error correction term in short-run | -0.083*** | -0.089** | Not Applicable | -0.078*** | | Regression Diagnostics: | | | | | | Adjusted R2 | 0.211 | 0.317 | Not Applicable | 0.430 | | Breusch-Godfrey LM Test (p-value) | 0.213 | 0.238 | Not Applicable | 0.112 | | Conclusions | Cointegrated; not Homogeneous | Cointegrated; and Homogeneous | Not Cointegrated | Cointegrated; not homogeneous | @ See notes for definitions.
# Maximum eigenvalue statistic gives similar results as Trace statistic.
*** denotes significance at 1 per cent level, ** denotes significance at 5 per cent level and * denotes significance at 10 per cent level.
Notes: 1. The sample period for the analysis is April 2012-July 2021. The estimates on cointegration and vector error correction models (VECMs) are based on Johansen System Cointegration test. The homogeneity is tested using student’s t-test.
2. CPI food is defined as CPI food and beverages. WPI food comprises of WPI food articles, manufactured food products and non-alcoholic beverages.
3. CPI fuel comprises of CPI fuel and light, petrol and diesel. WPI fuel is defined as WPI fuel and power.
4. CPI core is defined as CPI excluding food, fuel, petrol, diesel and housing. WPI core is defined as WPI non-food manufactured products excluding non-alcoholic beverages.
5. COVID-19 related disruptions have been adjusted for by introducing time dummies in the VECMs – a dummy for April 2020 has been included in all four equations and additionally for May 2021 for the core equation. All dummies were found to be significant at 1 per cent level. WPI and CPI with appropriate lags have been included in estimating the short-term error correction equations. | References: RBI (2021), “State of the Economy”, RBI Bulletin, June 2021. Das, P., & George, A. T. (2017), “Comparison of Consumer and Wholesale Prices Indices in India: An Analysis of Properties and Sources of Divergence”, RBI Working Paper Series, WPS (DEPR): 05 / 2017. | II.3 Costs During H1:2021, costs, as measured by inflation in WPI industrial raw materials and farm inputs, increased (Chart II.18). The firming up of global crude oil prices during 2021 impacted the prices of inputs such as high-speed diesel (HSD), naphtha, aviation turbine fuel (ATF), and furnace oil. Prices of non-food articles also increased during March- August 2021. Prices of fibres and oilseeds edged up as international cotton and soybean prices increased. However, inflation in industrial raw materials eased marginally in July 2021 reflecting easing in prices of minerals, bitumen, paper and pulp, before picking up again in August 2021. The increase in farm input price inflation was largely driven by double digit inflation in fodder, due to damage to production from excess rains during September-October 2020, and HSD reflecting firming up of global crude oil prices. Fertiliser prices, on a year-on-year basis, edged up moderately during 2021, reflecting increase in international prices. Prices of electricity – a key input in both industrial and farm inputs – remained muted during H1:2021. Price increase of agricultural machinery and implements, on a year-on-year basis, also stayed subdued, although a gradual pass-through of higher manufacturing costs due to rising commodity prices is underway during March-August 2021. Nominal rural wages for both agricultural and non-agricultural labourers remained stagnant; growth rates of the nominal rural wages eased sharply, on a year-on-year basis, during May-July 2021, attributable to adverse base effects15 (Chart II.19). Growth in the value of production in the organised sector decelerated in contrast to the increase in staff costs for listed firms in the manufacturing sector during Q1:2021-22. In the services sector, staff cost increased sharper than the value of production. As a result, unit labour costs (measured as a ratio of staff cost to value of production) rose from 5.7 per cent in Q4:2020-21 to 6.2 per cent in Q1:2021-22 for firms in the manufacturing sector16 and from 29.1 per cent to 31.5 per cent for firms in the services sector17 (Chart II.20). Input cost pressures and salary outgoes are expected to rise in Q3:2021-22 for the manufacturing firms polled in the Reserve Bank’s industrial outlook survey. Manufacturers may pass on the cost burden and selling prices are expected to increase in Q3 (Chart II.21a).
The firms covered in the Reserve Bank’s services and infrastructure outlook survey also expect input cost pressures as also the cost of finance to harden further going forward. The firms expect these factors to push up the selling prices in Q3 along with increase in salary outgoes (Chart II.21b). An analysis of the composition of costs among listed non-government non-financial (NGNF) firms18 reveals that there has been a distinct upward shift in costs for all constituents since the pre-pandemic period (Chart II.22). Manufacturing firms included in the purchasing managers’ index (PMI) also reported increase in input prices, with the pace of increase picking up in September 2021. PMI services firms reported elevated input prices, mainly driven by fuel, raw materials and transportation. In tandem, selling prices also started to tick up, though the pace remained muted. One year ahead business inflation expectations polled by the Indian Institute of Management, Ahmedabad, rose to their highest reading in July before softening somewhat in August.19
II.4 Conclusion With inflation expected to moderate in near months, the outlook has improved, and its trajectory may be shifting downwards in contrast to initial expectations. Active supply-side interventions by the Government in food items, particularly in pulses and edible oils, should bring about a better balance between supply and demand. With cost pressures showing no sign of abating, core inflation remains sticky and elevated. Furthermore, shortage of key industrial components due to stretched global supply chains and logistics is also leading to cost escalation. As demand recovery gathers steam, there is a rising risk of higher input price pass-through to output prices. Measures to ameliorate supply-side cost pressures would be critical at this juncture, especially in terms of a calibrated reduction of the indirect taxes on petrol and diesel. This would help anchor inflation expectations, prevent build-up of a wage-price nexus and provide space for monetary policy to sustain support for the still incomplete growth recovery. __________________________________________________________________________________
III. Demand and Output While the second wave dented the momentum of economic activity in Q1:2021-22, its impact on aggregate demand was muted relative to the first wave. Aggregate demand recovered in Q2:2021-22 and is expected to strengthen further in H2. The supply side is gradually normalising with the easing of supply chain and logistic disruptions. The recovery, however, remains dependent upon continued policy support, the COVID-19 trajectory and the progress of vaccination. Within days of the release of April 2021 MPR, the second wave of COVID-19 intensified and became virulent and lethal, overwhelming the health infrastructure and denting the momentum of economic activity in Q1:2021-22. The second wave receded as rapidly as it had surged (Chart III.1). Accordingly, the impact on aggregate demand was muted and short-lived relative to the first wave. More nuanced and calibrated containment measures and adaptation by businesses and households to working in a pandemic environment also moderated the headwinds from the second wave. Aggregate demand recovered further in Q2:2021-22, led by investment and private consumption. 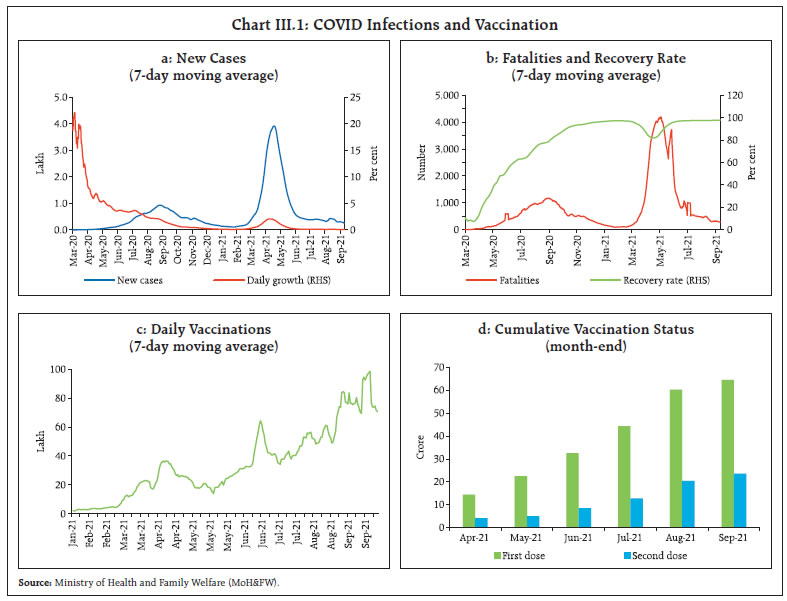
| Table III.1: Real GDP Growth | | (y-o-y per cent) | | Item | 2019-20
(FRE) | 2020-21
(PE) | Weighted contribution* | 2019-20 | 2020-21 | 2021-22 | | 2019-20 | 2020-21 | Q1 | Q2 | Q3 | Q4 | Q1 | Q2 | Q3 | Q4 | Q1 | | PFCE | 5.5 | -9.1 | 3.1 | -5.2 | 7.6 | 6.5 | 6.4 | 2.0 | -26.2 | -11.2 | -2.8 | 2.7 | 19.3 | | | | | | | | | | | | | | | (-11.9) | | GFCE | 7.9 | 2.9 | 0.8 | 0.3 | 1.8 | 9.6 | 8.9 | 12.1 | 12.7 | -23.5 | -1.0 | 28.3 | -4.8 | | | | | | | | | | | | | | | (7.4) | | GFCF | 5.4 | -10.8 | 1.7 | -3.5 | 13.3 | 3.9 | 2.4 | 2.5 | -46.6 | -8.6 | 2.6 | 10.9 | 55.3 | | | | | | | | | | | | | | | (-17.1) | | Exports | -3.3 | -4.7 | -0.7 | -0.9 | 3.0 | -1.3 | -5.4 | -8.8 | -21.8 | -2.0 | -3.5 | 8.8 | 39.1 | | | | | | | | | | | | | | | (8.7) | | Imports | -0.8 | -13.6 | -0.2 | -3.1 | 9.4 | -1.7 | -7.5 | -2.7 | -40.9 | -17.9 | -5.0 | 12.3 | 60.2 | | | | | | | | | | | | | | | (-5.3) | | GDP at market prices | 4.0 | -7.3 | 4.0 | -7.3 | 5.4 | 4.6 | 3.3 | 3.0 | -24.4 | -7.4 | 0.5 | 1.6 | 20.1 | | | | | | | | | | | | | | | (-9.2) | Note: *: Component-wise contributions to growth do not add up to GDP growth because change in stocks, valuables and discrepancies are not included.
Figures in parentheses are growth rates over Q1:2019-20.
FRE: First revised estimates, PE: Provisional estimate
Source: National Statistical Office (NSO). | The recovery is benefitting from pent-up demand supported by the increasing vaccination coverage, the government’s push towards capital expenditure, robust external demand and normal monsoon. The ongoing demand revival is expected to get a further boost from the government’s asset monetisation programme and reforms encompassing the telecom and banking sectors. The supply side is also gradually normalising with the easing of supply chain and logistic disruptions. Agriculture and allied activities remain resilient, backed by above normal kharif sowing. A number of high-frequency indicators are yet to exceed the pre-COVID levels, however, and the recovery remains dependent upon continued policy support. III.1 Aggregate Demand Despite a loss of momentum in the wake of the severe second wave, real gross domestic product (GDP) rose by 20.1 per cent year-on-year (y-o-y) in Q1:2021-22 on a large favourable base effect (Table III.1 and Chart III.2a), supported by expansion in all its constituents except for government final consumption expenditure (GFCE) which contracted. The level of GDP in Q1:2021-22 was, however, still 9.2 per cent below the pre-pandemic (Q1:2019-20) level. Excluding GFCE, real GDP expanded by 25.0 per cent (y-o-y) during Q1. Momentum – the quarter-on-quarter (q-o-q) seasonally adjusted annualised rate (SAAR) of real GDP – fell during Q1:2021-22, however, reflecting the lockdowns/restrictions during the second wave, although the contraction was lower than a year ago with businesses and households adapting better to COVID-19 protocols as well as the sharp tapering in infections (Chart III.2b). Aggregate demand gained momentum in Q2, supported by recovery in private consumption and investment demand. 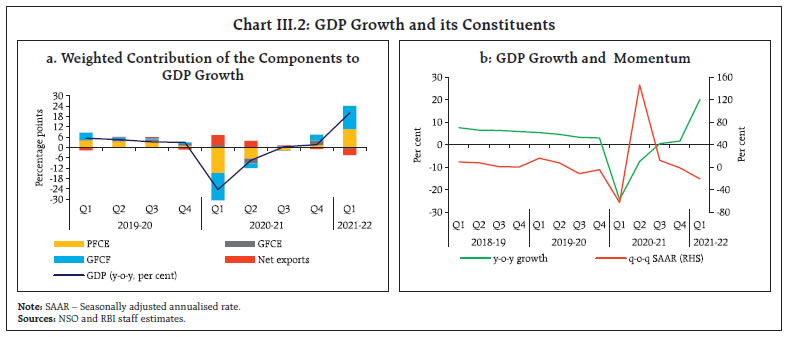 GDP Projections versus Actual Outcomes Actual real GDP growth of 20.1 per cent in Q1 undershot the April 2021 MPR projection of 26.2 per cent (Chart III.3), largely reflecting the impact of the steep jump in infections due to the second wave. The April MPR had alluded to the potential surge in infections and new mutants as downside risks to the baseline growth path. The decline in the government consumption expenditure also contributed to actual GDP growth trailing projections. III.1.1 Private Final Consumption Expenditure Private consumption, with a share of around 55 per cent in GDP during Q1:2021-22, continued as the mainstay of aggregate demand. Notwithstanding a y-o-y growth of 19.3 per cent, it was around 12 per cent lower than its pre-COVID level (Q1:2019-20). The accelerated pace of vaccination and the plateauing of new infections are facilitating faster resumption of contact-intensive services and giving a fillip to private consumption. Urban demand is turning the corner as corroborated by high frequency coincident and leading indicators for Q2. Passenger vehicle sales in July and August crossed pre-COVID levels (Chart III.4a), but production is facing headwinds from the persistence of global supply bottlenecks in the availability of semiconductor chips. Domestic air passenger traffic and the production of consumer durables regained traction during July and August, albeit they are still below pre-COVID levels (Chart III.4b and c). Household credit is gradually improving, driven by credit card transactions and personal loan, supporting consumer durables financing (Chart III.4d). Digital retail payments data, which provide useful signals of economic activity, corroborate the upturn (Box III.1). Rural consumption demand, which was largely immune to the pandemic during the first wave, was dented during the second wave with the fast spread of infections to rural areas. With the abatement of the second wave and improving vaccinations, rural consumption exhibited recovery in Q2, backed by buoyant rabi harvest, good kharif prospects, government transfers and the Mahatma Gandhi National Rural Employment Guarantee Act (MNREGA) programme. The pick-up in motorcycle sales during June-August and the improvement in consumer non-durables underscore this revival (Chart III.5). Tractor sales have exhibited robust growth, remaining above their pre-pandemic levels, although sales dipped in August in the usual seasonal pattern. Fertiliser sales picked up from May, moving in tandem with 2019 levels, although trailing the exceptionally strong growth of last year. 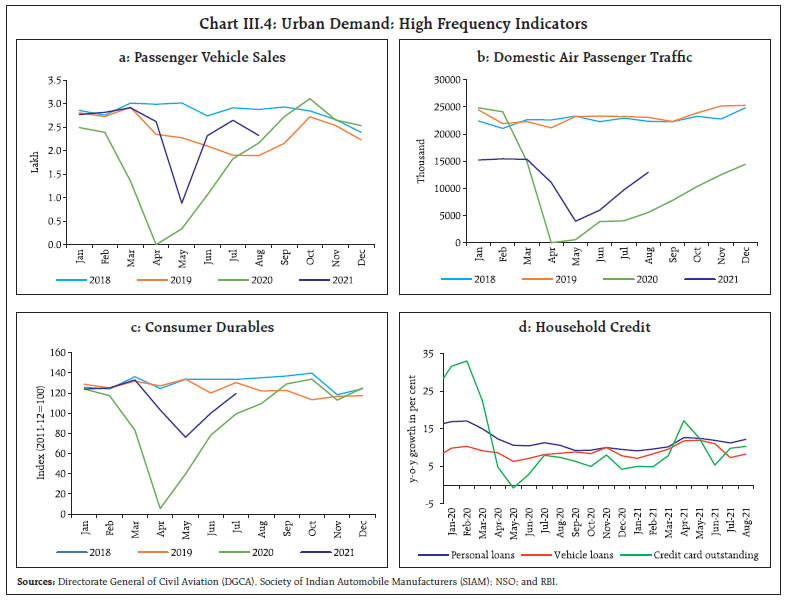 Unemployment rose and labour force participation fell in Q1:2021-22 under the pressure of the second wave, but the impact was muted compared to the first wave. According to the Centre for Monitoring Indian Economy (CMIE), there was a deep hit to labour markets in mid-May at the peak of the second wave. Employment recovered swiftly in June-July and strengthened in September (Chart III.6a). In September, labour participation further rose with the phased opening up of the economy leading to rising demand for labour. Employment conditions improved in June and July 2021 in the organised sector, according to payrolls data (Chart III.6b). Increase in hirings is led by the IT sector, while non-IT sectors such as education, banking, financial, insurance, hospitality and automobile sector have also shown strong recovery recently, according to Naukri Jobspeak data. Box III.I: Tracking Macroeconomic Activity using Digital Payments Data A robust assessment of the current state of the economy and its expected trajectory is critical for the effectiveness of a forward-looking monetary policy. Data on GDP – the comprehensive measure of economic activity – are however, available, with a lag of two months after the end of the reference quarter. Given these data lags and the large and swift exogenous shocks that have been witnessed in the recent years (such as the 2008 global financial crisis and the ongoing COVID-19 pandemic), the interest in new macroeconomic forecasting tools to nowcast economic activity has become widespread. In this regard, payments data represent a unique source of tracing the underlying economic activity, given their crucial role in undertaking and settling transactions in a market economy. Cross-country empirical evidence suggests that the payments data enhance the accuracy of the nowcasts and short-term forecasts relative to other indicators (Aprigliano et. al., 2019; Bentsen et. al., 2021). India has state-of-the-art payments infrastructure and products and there is a wider adoption of digital payments (Das, 2021). The share of digital transactions in the total volume of non-cash retail payments stood at 98.5 per cent during 2020-21. The width and the depth of the banking system, the enhanced policy focus on promoting digital payments and the relatively quick availability of such data make them valuable for nowcasting GDP in the Indian context. A preliminary analysis shows that, amongst the various modes of digital retail payments, the volume of transactions through the following three channels – ATMs, credit cards and debit cards – has a high correlation with GDP (0.95 for the period Q1:2011-12 to Q4:2020-21). The dynamics are further explored through alternate autoregressive distributed lag (ARDL) model specifications with the following variables: real GDP, digital payments volumes (as defined above), and select real economy indicators having a strong association with output (namely, petroleum consumption, electricity consumption and railway freight traffic) as control variables1. To assess the role of the payments data relative to the competing variables, three model specifications are attempted. Model 1 includes data only on digital payments; Model 2 augments payments data with the control variables; Model 3 drops the payments data and includes only the three control variables. Given the large disruptions to the economic activity from the unprecedented COVID-19 pandemic and to evaluate the relative forecasting performance, the models are estimated initially for the pre-COVID period (Q2:2011-12 to Q3:2019-20) and subsequently for the sample including the COVID period (Q2:2011-12 to Q4:2020-21). The estimates indicate that the forecasts of the baseline model with payments data (Model 1) outperform the specification which does not include payments data (Model 3) and also upon the benchmark AR(1) model (Chart III.1.1). Payments data thus add value to the forecasting toolkit and mixed frequency modelling approaches can provide monthly updates of the evolving output dynamics. The fast pace of the innovations in the payments technology and the rapid shifts in the payments habits of economic agents need ongoing refinements in the modelling approaches. 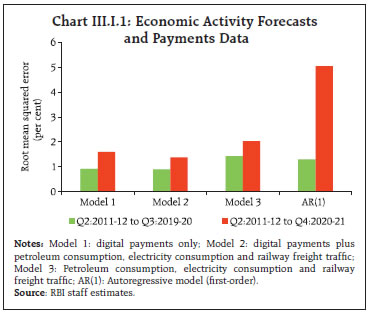 References: Aprigliano, V., G. Ardizzi and L. Monteforte (2019), “Using Payment System Data to Forecast Economic Activity”, International Journal of Central Banking, 15(4), 55-80. Bentsen, K.N., D. Gorea (2021), “Nowcasting and Forecasting Economic Activity in Denmark using Payment System Data”, Denmark Nationalbank Working Paper. Das, Shaktikanta (2021). Financial Inclusion – Past, Present and Future, RBI Bulletin, August. | 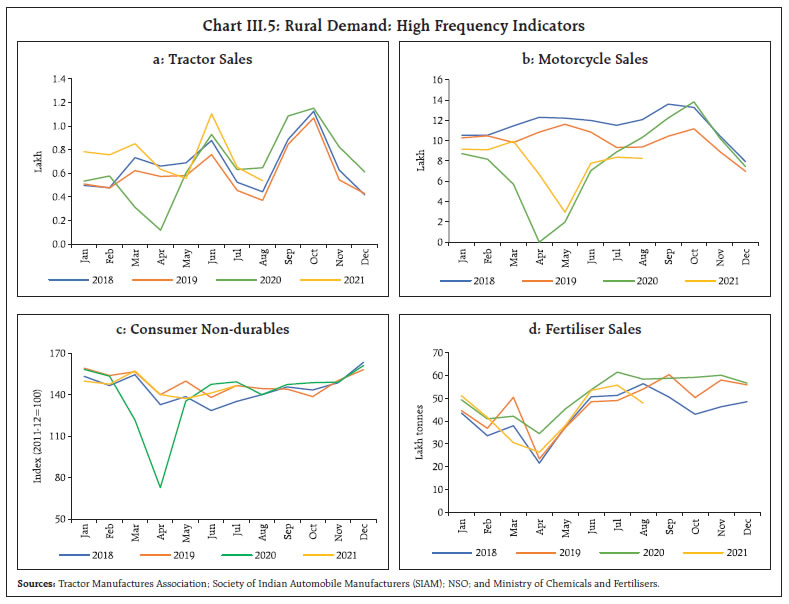 III.1.2 Gross Fixed Capital Formation Gross fixed capital formation (GFCF) expanded by 55.3 per cent (y-o-y) in Q1 (contraction of 46.6 per cent a year ago). Sequentially, there was a dip of 23.6 per cent in Q1 despite robust government capex. The share of GFCF in aggregate demand inched up to 31.6 per cent in Q1 from 24.4 per cent a year ago but remained lower than its pre-pandemic level. Construction activity, a large portion of GFCF, was subdued due to pandemic effects, especially led by labour and materials shortages, although the impact was less than during the first wave. There are signs of revival in investment demand in Q2, as suggested by the movements in the proximate indictors – capital goods imports; production of capital goods; and cement production (Charts III.7).
Capacity utilisation (CU) in the manufacturing sector dropped to 60.0 per cent in Q1:2021-22 from 69.4 per cent in the previous quarter (Chart III.8). On a seasonally adjusted basis, CU fell from 66.7 per cent in Q4 to 61.7 per cent in Q1. The interest coverage ratio (ICR)2 of listed non-financial private companies in the manufacturing and information technology (IT) sectors improved further in Q1:2021-22, indicating improved debt servicing capacity and hence, conducive conditions for the expansion in investment activity (Chart III.9). The production-linked incentive (PLI) scheme is nurturing private investment. The mega schemes, viz. National Infrastructure Plan (NIP) amounting to ₹100 lakh crore and National Monetisation Pipeline (NMP) involving ₹6 lakh crore (Chart III.10), are also expected to give a major thrust to infrastructure spending and uplift potential output. The NMP, which will be co-terminus with the balance NIP period (2021-22 to 2024-2025), is expected to unlock the value of investments in brownfield public sector assets by tapping institutional and long-term capital and by leveraging further public investments. The central government’s financial assistance to the state governments for infrastructure spending and incentives for disinvestment/monetisation in the form of additional allocation equivalent to 33 per cent of value of the monetised assets, subject to the realised amount being used for capital expenditure, should also provide an impetus to capital expenditure. 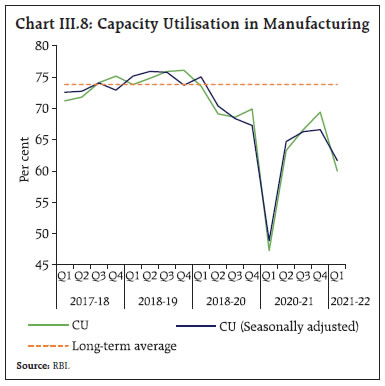
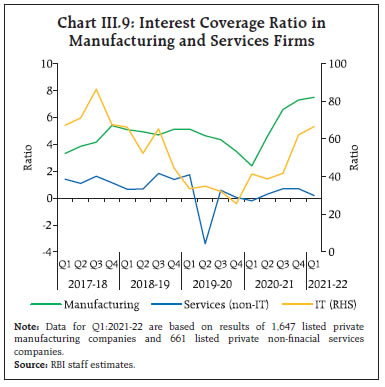
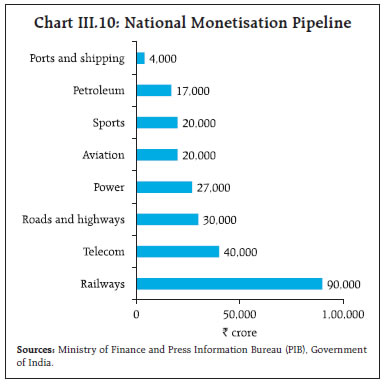
| Table III.2: Budgetary Position of the Central Government | | Item | (₹ thousand crore) | (Per cent) | | Budget estimates | Actuals | Per cent to BE | Growth rate | | 2020-21 | 2021-22 | Apr-Aug 2020 | Apr-Aug 2021 | Apr-Aug 2020 | Apr-Aug 2021 | Apr-Aug 2020 | Apr-Aug 2021 | | 1. Revenue receipts | 2,020.9 | 1,788.4 | 370.6 | 793.5 | 18.3 | 44.4 | -38.6 | 114.1 | | 2. Tax revenue (Net) | 1,635.9 | 1,545.4 | 284.5 | 644.8 | 17.4 | 41.7 | -29.7 | 126.7 | | 3. Non-tax revenue | 385.0 | 243.0 | 86.1 | 148.7 | 22.4 | 61.2 | -56.6 | 72.6 | | 4. Non-debt capital receipts | 225.0 | 188.0 | 6.7 | 15.2 | 3.0 | 8.1 | -63.5 | 127.8 | | 5. Total receipts (1+4) | 2,245.9 | 1,976.4 | 377.3 | 808.7 | 16.8 | 40.9 | -39.3 | 114.3 | | 6. Total expenditure (7+8) | 3,042.2 | 3,483.2 | 1,247.7 | 1,276.7 | 41.0 | 36.7 | 6.2 | 2.3 | | 7. Revenue expenditure | 2,630.1 | 2,929.0 | 1,113.2 | 1,104.8 | 42.3 | 37.7 | 7.1 | -0.8 | | 8. Capital expenditure | 412.1 | 554.2 | 134.4 | 171.9 | 32.6 | 31.0 | -1.3 | 27.8 | | 9. Revenue deficit (7-1) | 609.2 | 1,140.6 | 742.6 | 311.3 | 121.9 | 27.3 | 70.3 | -58.1 | | 10. Gross fiscal deficit (6-5) | 796.3 | 1,506.8 | 870.3 | 468.0 | 109.3 | 31.1 | 57.1 | -46.2 | | 11. Gross primary deficit | 88.1 | 697.1 | 632.7 | 189.6 | 717.9 | 27.2 | 89.0 | -70.0 | | Source: Controller General of Accounts (CGA). | III.1.3 Government Expenditure Government final consumption expenditure (GFCE) contracted by 4.8 per cent in Q1:2021-22, partly due to the base effect. Revenues – both tax and non-tax – remained robust. The fiscal position of the central government accordingly strengthened during April-August 2021 and the gross fiscal deficit (GFD) and the revenue deficit (RD) at 31.1 per cent and 27.3 per cent of the budget estimate (BE), respectively, were lower than past trends (Table III.2). Though the first supplementary demands for grants for 2021-22 presented in July involved gross additional expenditure of ₹1,87,202 crore, the net cash outgo amounts to only ₹23,675 crore or 0.12 per cent of GDP. The buoyancy in the central government’s tax revenue during April-August 2021 was driven by higher corporate taxes (on the back of strong corporate performance) and customs duties (due to higher import demand and improving trade activity) (Table III.3). Excise duty collections benefitted from higher global crude oil prices. Goods and services tax (GST) collections received a jolt from the second wave during May and June but recovered rapidly in the subsequent period (Chart III.11). Overall, direct taxes rose by 101.4 per cent y-o-y (32.8 per cent over the corresponding period of 2019-20), while indirect taxes surged by 52.5 per cent (27.2 per cent over the corresponding period of 2019-20). Non-tax revenue also registered healthy growth, boosted by higher surplus transfer by the Reserve Bank. | Table III.3: Central Government’s Tax Collections | | Item | ₹ thousand crore | Per cent | | Budget Estimates | Actuals | Per cent to BE | Growth Rate | | 2020-21 | 2021-22 | Apr-Aug 2020 | Apr-Aug 2021 | Apr-Aug 2020 | Apr-Aug 2021 | Apr-Aug 2020 | Apr-Aug 2021 | | A. Direct taxes | 1,319.0 | 1,108.0 | 187.3 | 376.2 | 14.2 | 34.0 | -33.3 | 108.0 | | Of which | | | | | | | | | | 1. Corporation tax | 681.0 | 547.0 | 64.7 | 168.1 | 9.5 | 30.7 | -41.8 | 159.7 | | 2. Income tax | 625.0 | 548.5 | 117.7 | 199.4 | 18.8 | 36.4 | -28.9 | 69.3 | | B. Indirect Taxes | 1,104.0 | 1,109.1 | 316.9 | 483.4 | 28.7 | 43.6 | -16.6 | 52.6 | | Of which | | | | | | | | | | 1. Total GST | 693.5 | 633.3 | 182.4 | 266.9 | 26.3 | 42.1 | -23.9 | 46.3 | | 2. Custom duties | 138.0 | 136.0 | 32.3 | 76.2 | 23.4 | 56.0 | -47.9 | 136.0 | | 3. Union excise duties | 267.0 | 335.0 | 100.4 | 137.2 | 37.6 | 41.0 | 32.0 | 36.7 | | C. Gross tax revenue | 2,423.0 | 2,217.1 | 504.2 | 859.6 | 20.8 | 38.8 | -23.7 | 70.5 | | D. Assignment to States/UTs | 784.2 | 665.6 | 218.0 | 212.6 | 27.8 | 31.9 | -14.7 | -2.5 | | E. Net tax revenue | 1,635.9 | 1,545.4 | 284.5 | 644.8 | 17.4 | 41.7 | -29.7 | 126.7 | | Sources: Union Budget Documents and Controller General of Accounts. |
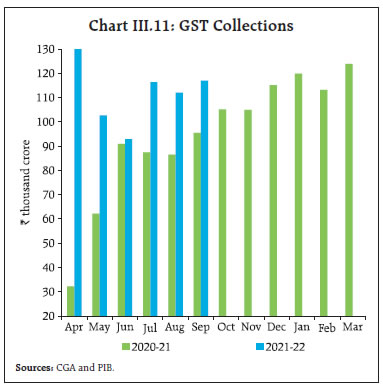 On the expenditure side, revenue expenditure contracted marginally by 0.8 per cent y-o-y during April-August 2021 (although higher by 6.3 per cent over the pre-pandemic level), partly due to the frontloading of expenditures a year ago necessitated by the first wave of the pandemic and also efforts to curtail avoidable spending. Spending on major subsidies, however, increased by 12.8 per cent y-o-y (lower by 22.2 per cent compared to the same period of 2019-20), with the extension of the schemes put in place last year to provide free ration to more than 80 crore people under the Pradhan Mantri Garib Kalyan Anna Yojana to mitigate the impact of COVID-19. The central government’s capital expenditure increased by 27.8 per cent y-o-y during April-August 2021 (and 26.2 per cent over pre-COVID level), driven by outlays towards road transport and highways. 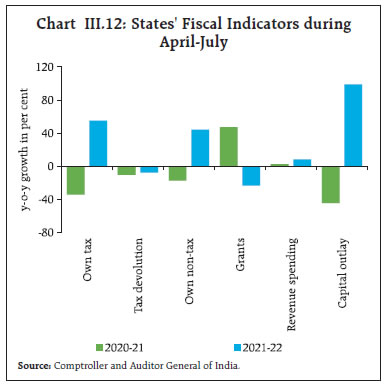 Available information for 18 states indicates that their GFD in April-July 2021 (as per cent to full year budget estimates) was lower than a year ago on the back of a surge in revenue receipts led by own tax and non-tax revenues, even as transfers from the Centre contracted (Chart III.12).3 Subsequent to the 43rd meeting of the GST Council, it was decided that the Centre would borrow ₹1.59 lakh crore from the market through a special window for 2021-22, which would be passed on to states as back to back loans; of this, an amount of ₹75,000 crore has been transferred to states. Furthermore, ₹81,179 crore of the GST compensation overdues of the last year are also expected to be transferred this year. Both revenue and capital expenditure of the states picked up during April-July 2021 – the latter expanded sharply by 99 per cent, more than offsetting the contraction of 45 per cent a year ago. | Table III.4: Government Market Borrowings | | (₹ crore) | | Item | 2019-20 | 2020-21 | 2021-22 (up to end-September) | | Centre | States | Total | Centre | States | Total | Centre | States | Total | | Net borrowings | 4,73,972 | 4,87,454 | 9,61,426 | 11,43,114 | 6,51,777 | 17,94,891 | 5,63,100 | 2,35,741 | 7,98,841 | | Gross borrowings | 7,10,000 | 6,34,521 | 13,44,521 | 13,70,324 | 7,98,816 | 21,69,140 | 7,02,357 | 3,08,972 | 10,11,329 | | Sources: Government of India; and RBI staff estimates. | The Union Budget 2021-22 projected gross and net market borrowings at ₹12.05 lakh crore and ₹9.24 lakh crore, respectively. The centre’s gross issuances of market borrowings during the first half were ₹7.02 lakh crore (58.3 per cent of the full year budgeted amount) as against ₹7.24 lakh crore envisaged in the calendar for H1 (Table III.4). The weighted average cost and maturity of issuances during H1:2021-22 were 6.19 per cent and 16.7 years, respectively (5.8 per cent and 14.8 years in the same period of 2020-21). For H2:2021-22, the centre’s gross market borrowings have been planned ₹5.03 lakh crore in line with the full year budget estimates. Against the backdrop of comfortable cash position, the Central Government has not planned additional market borrowing for making payment to the state governments for GST compensation. States raised gross market borrowings of ₹3.09 lakh crore during H1:2021-22, 83.4 per cent of the indicative calendar. The ways and means advances (WMA) limit for the Central Government for H1:2021-22 was scaled back to ₹1.2 lakh crore from ₹2 lakh crore in H1:2020-21; for H2:2021-22, it has been fixed at ₹0.5 lakh core as compared with ₹1.25 lakh core a year ago. For states/union territories, the Reserve Bank decided to continue with the enhanced interim WMA limit of ₹51,560 crore during the first half of 2021-22 to help them in tiding over the short-term mismatches and difficulties faced due to the pandemic. III.1.4 External Demand Buoyed by strong external demand and base effects, exports registered a sharp expansion in Q1:2021-22 and the buoyancy continued to Q2 (Chart III.13). Merchandise imports also rebounded strongly on the back of the recovery in domestic demand, higher crude oil prices and base effects. With the growth of imports outpacing that of exports, net exports contributed negatively to aggregate demand in Q1:2021-22 [(-)1.9 per cent in Q1 as compared with 1.3 per cent a year ago and (-) 4.8 per cent two years ago (pre-COVID)]. The surge in merchandise exports was powered by engineering goods, petroleum products, organic and inorganic chemicals, cotton textiles and drugs and pharmaceuticals. Labour-intensive sectors like apparels, leather products and tea continue to lag, mainly due to their greater sensitivity to mobility restrictions (Chart III.14). Going forward, the schemes such as District as Export Hub (DEH) covering One District One Product (ODOP), PLI scheme for sunrise sectors and Ubharte-Sitaare scheme for MSMEs should improve export competitiveness and help to achieve the target of US$ 400 billion set for 2021-22. The persistent upsurge in global container freight prices and the growing shortage of semi-conductors, however, pose downside risks to a durable merchandise trade recovery (see Chapter V). 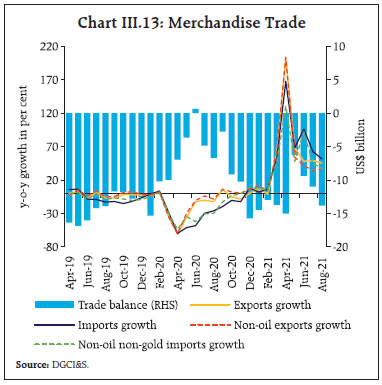
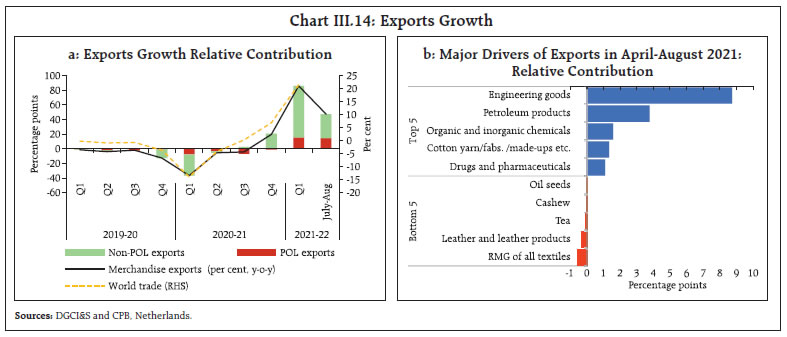 The impact of the second wave on import demand remained limited as compared to the first wave, reflecting calibrated and localised restrictions and businesses adapting to COVID-appropriate working environment. In Q2, with the gradual unwinding of restrictions, merchandise imports spurted and exceeded pre-COVID levels. Non-oil non-gold imports were led by higher shipments of pearls and precious stones, vegetable oils, chemicals and chemical products. Gold imports, after dropping sharply in May and June on the back of subdued demand due to the second wave, revived in Q2 with the relaxations of the restrictions (Chart III.15). The trade deficit widened to US$ 55.5 billion in April-August 2021 from US$ 23.4 billion a year ago, but it remained below its pre-COVID level (US$ 77.2 billion). Services exports growth in Q1: 2021-22 was the highest in 13 quarters and surpassed pre-pandemic levels (Chart III.16). This strong growth in the overall services exports was driven by software, business, and transportation services. Major information technology (IT) companies continued to benefit from pandemic-induced demand from international customers and adoption of new models. They recorded solid revenue growth in Q1:2021-22, driven by banking, financial services including insurance, communications, healthcare and technology services. As a result, resilient services surplus had a favourable impact on the current account balance in Q1:2021-22. During Q2 (July-August 2021), double-digit growth in services exports was driven by software, business and transport services. Turning to the financial account, capital flows remained healthy during Q1:2021-22, primarily due to foreign direct investment (FDI), which was driven by a few big deals in the manufacturing and digital sectors (Chart III.17). Net FDI at US$ 14.1 billion in April-July 2021 was higher than a year ago. While foreign portfolio investors (FPIs) adopted a cautious stance during the second wave of COVID-19, they turned net buyers from August 2021 amidst robust Q1 corporate earnings and better domestic macroeconomic indicators. Accretions to non-resident deposits moderated during April-July 2021 as compared with a year ago. As on October 1, 2021, India’s foreign exchange reserves stood at US$ 637.5 billion, equivalent to 14 months of imports projected for 2021-22 and 111.6 per cent of outstanding external debt at end-June 2021. 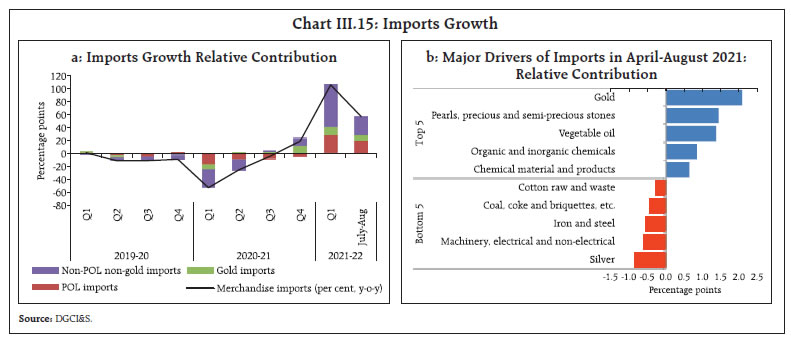
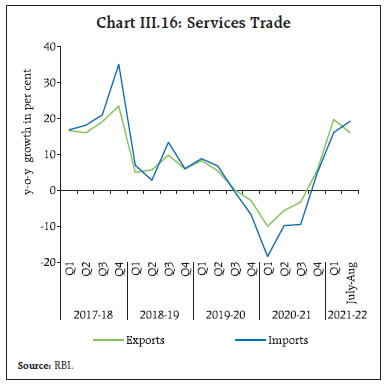
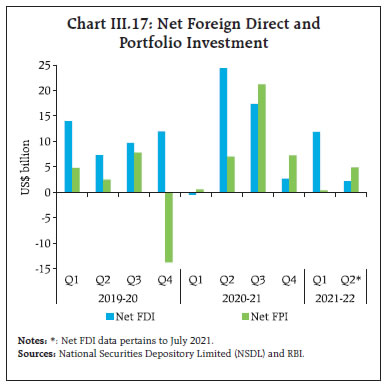
| Table III.5: Sector-wise Growth in GVA | | (y-o-y growth) | | Sector | 2019-20
(FRE) | 2020-21
(PE) | Weighted contribution | 2019-20 | 2020-21 | 2021-22 | | 2019-20 | 2020-21 | Q1 | Q2 | Q3 | Q4 | Q1 | Q2 | Q3 | Q4 | Q1 | | Agriculture, forestry and fishing | 4.3 | 3.6 | 0.6 | 0.5 | 3.3 | 3.5 | 3.4 | 6.8 | 3.5 | 3.0 | 4.5 | 3.1 | 4.5 (8.2) | | Industry | -2.0 | -6.4 | -0.5 | -1.4 | 1.0 | -2.7 | -3.0 | -3.2 | -31.0 | -1.6 | 1.6 | 5.5 | 40.4 (-3.1) | | Mining and quarrying | -2.5 | -8.5 | -0.1 | -0.2 | -1.3 | -5.2 | -3.5 | -0.9 | -17.2 | -6.5 | -4.4 | -5.7 | 18.6 (-1.8) | | Manufacturing | -2.4 | -7.2 | -0.4 | -1.2 | 0.6 | -3.0 | -2.9 | -4.2 | -36.0 | -1.5 | 1.7 | 6.9 | 49.6 (-4.2) | | Electricity, gas, water supply and other utilities | 2.1 | 1.9 | 0.0 | 0.0 | 6.9 | 1.7 | -3.1 | 2.6 | -9.9 | 2.3 | 7.3 | 9.1 | 14.3 (3.0) | | Services | 6.4 | -8.4 | 4.0 | -5.3 | 6.8 | 7.3 | 5.8 | 5.6 | -24.9 | -11.0 | -0.2 | 3.2 | 16.1 (-12.8) | | Construction | 1.0 | -8.6 | 0.1 | -0.7 | 3.7 | 1.0 | -1.3 | 0.7 | -49.5 | -7.2 | 6.5 | 14.5 | 68.3 (-14.9) | | Trade, hotels, transport, communication | 6.4 | -18.2 | 1.3 | -3.7 | 6.2 | 6.8 | 7.0 | 5.7 | -48.1 | -16.1 | -7.9 | -2.3 | 34.3 (-30.2) | | Financial, real estate and professional services | 7.3 | -1.5 | 1.6 | -0.3 | 8.8 | 8.9 | 5.5 | 4.9 | -5.0 | -9.1 | 6.7 | 5.4 | 3.7 (-1.5) | | Public administration, defence and other services | 8.3 | -4.6 | 1.1 | -0.6 | 5.6 | 8.8 | 8.9 | 9.6 | -10.2 | -9.2 | -2.2 | 2.3 | 5.8 (-5.0) | | GVA at basic prices | 4.1 | -6.2 | 4.1 | -6.2 | 5.0 | 4.6 | 3.4 | 3.7 | -22.4 | -7.3 | 1.0 | 3.7 | 18.8 (-7.8) | Note: FRE: First revised estimates; PE: Provisional estimates.
Figures in parenthesis are growth rates over Q1:2019-20.
Source: NSO. | III.2 Aggregate Supply Real gross value added (GVA) at basic prices rose by 18.8 per cent y-o-y during Q1:2021-22 as against a contraction of 22.4 per cent in Q1:2020-21 (Table III.5). The resilience of agriculture and the recovery in manufacturing and non-contact intensive services supported the expansion in GVA, while contact-intensive services lagged due to logistic and operational constraints. Real GVA was, however, 7.8 per cent below its pre-pandemic (Q1:2019-20) level. III.2.1 Agriculture Agriculture and allied activities registered robust growth in Q1:2021-22 on the back of record rabi and horticulture production and resilience in allied activities. Foodgrains production rose by 3.7 per cent in 2020-21, led by rice and wheat (Table III.6). The production of nine major oilseeds increased by 8.7 per cent, supported by the implementation of area expansion policies under the National Food Security Mission for edible oils. Horticulture production rose by 2.9 per cent during 2020-21, led by an increase of 2.8 per cent in the area under cultivation. In 2021, the south-west monsoon rainfall encountered two slowdown phases (from the third week of June to mid-July and almost the whole of August), after a normal start. With the strong revival of rains in September, the cumulative seasonal rainfall was 0.7 per cent below the long period average (LPA), with 83 per cent of the sub-divisions receiving normal or above normal rainfall (Charts III.18a and b). The production weighted rainfall (PRN) index at 102 per cent (as on September 30) was below last year’s position (105 per cent) and the PRN for rice, coarse cereals and sugarcane exceeded the 5-year average. As on September 30, 2021, reservoir levels stood at 80 per cent of the full reservoir level (FRL), higher than the decadal average of 77 per cent – brightening the prospects for the ensuing rabi season (Chart III.18c). | Table III.6: Agriculture Production | | Item | Lakh tonnes | Growth (%) | | 2019-20 | 2020-21 | 2020-21 over final estimate 2019-20 | | I. Total foodgrains | 2,975.0 | 3,086.5 | 3.7 | | Rice | 1,188.7 | 1,222.7 | 2.9 | | Wheat | 1,078.6 | 1,095.2 | 1.5 | | Coarse cereals | 477.5 | 511.5 | 7.1 | | Pulses | 230.3 | 257.2 | 11.7 | | II. Commercial crops | | | | | Sugarcane | 3,705.0 | 3,992.5 | 7.8 | | Cotton | 360.7 | 353.8 | -1.9 | | Oilseeds | 332.2 | 361.0 | 8.7 | | III. Total horticulture crops | 3,204.7 | 3,298.6 | 2.9 | | III.1 Total fruits | 1,020.8 | 1,027.6 | 0.7 | | Banana | 326.0 | 338.3 | 3.8 | | Citrus | 145.7 | 140.7 | -3.4 | | Mango | 203.2 | 208.9 | 2.8 | | III.2 Total vegetables | 1,882.8 | 1,962.7 | 4.2 | | Onion | 260.9 | 269.2 | 3.2 | | Potato | 485.6 | 536.9 | 10.6 | | Tomato | 205.5 | 210.0 | 2.2 | | III.3 Plantation crops | 161.2 | 166.0 | 3.0 | | III.4 Total spices | 101.4 | 105.4 | 3.9 | | III.5 Flowers and aromatics | 37.3 | 35.7 | -4.3 | | Source: Ministry of Agriculture and Farmers’ Welfare (MOAFW). | Despite the breaks in the monsoon’s progress, kharif sowing progressed well. As on September 30, 2021 it was 0.2 per cent above the record sowing acreage a year ago, and 4.1 per cent higher than the normal sown area (5-year average) (Chart III.18d). Higher minimum support prices (MSPs) – with increases of 1.1 per cent to 6.6 per cent over the previous year for kharif 2021-22 with assured return of at least 50 per cent over the cost of production (as measured by A2 plus FL) – supported sowing activity. According to the first advance estimates for 2021-22, the production of kharif foodgrains rose by 0.6 per cent over last year (Table III.7). The Government of India had set the target for foodgrains production for the year at 3,070 lakh tonnes in the National Kharif Strategy for 2021-22 which, inter alia, aims to attain self-sufficiency in the production of pulses and oilseeds. 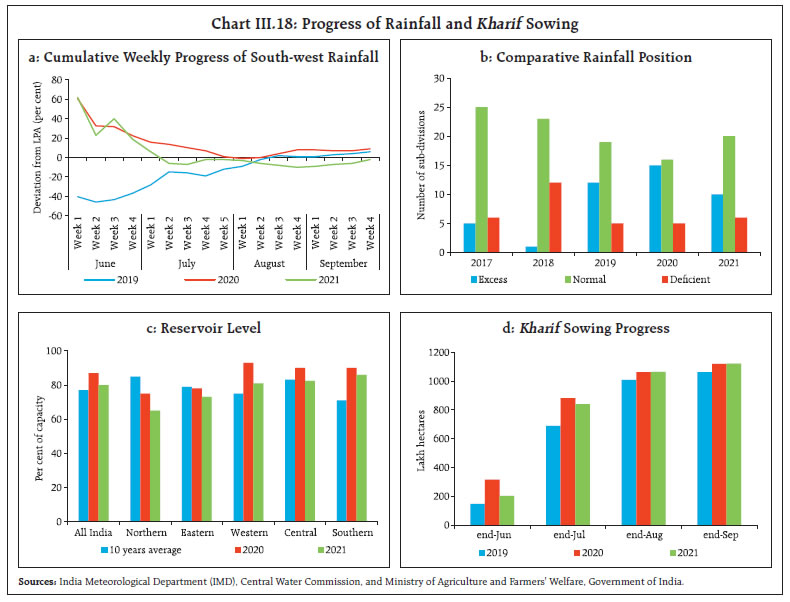
| Table III.7: Kharif Crops Production 2021-22 | | (Lakh tonnes) | | Item | 2020-21 | 2021-22 | 2021-22 | | First AE | Fourth AE | First AE | Growth (per cent) | | Over 1st AE 2020-21 | Over 4th AE 2020-21 | | 1. Foodgrains | 1,445.2 | 1,495.6 | 1,505.0 | 4.1 | 0.6 | | Rice | 1,023.6 | 1,044.1 | 1,070.4 | 4.6 | 2.5 | | Coarse Cereals | 328.4 | 364.6 | 340.0 | 3.5 | -6.7 | | Pulses | 93.1 | 86.9 | 94.5 | 1.5 | 8.7 | | Tur | 40.4 | 42.8 | 44.3 | 9.7 | 3.5 | | Urad | 21.5 | 16.0 | 20.5 | -4.7 | 28.1 | | Moong | 20.9 | 20.1 | 20.5 | -1.9 | 2.0 | | 2. Oilseeds (total) | 257.3 | 240.3 | 233.9 | -9.1 | -2.7 | | Groundnut | 95.4 | 85.6 | 82.5 | -13.4 | -3.5 | | Soyabean | 135.8 | 129.0 | 127.2 | -6.4 | -1.4 | | 3. Cotton # | 371.2 | 353.8 | 362.2 | -2.4 | 2.4 | | 4. Jute & Mesta ## | 96.6 | 95.6 | 96.1 | -0.5 | 0.5 | | 5. Sugarcane | 3998.3 | 3992.5 | 4192.5 | 4.9 | 5.0 | #: Lakh bales of 170 kgs each.
# #: Lakh bales of 180 kgs each.
Source: MOAFW. | Improved rural prospects from kharif sowing are mirrored in high frequency indicators, viz., sales of tractors and two-wheelers (Table III.8). Exports of agriculture and allied products also expanded. | Table III.8: Rural Economy - High Frequency Indicators | | Items | Unit | April-Aug 2019 | April-Aug 2020 | April-Aug 2021 | | Tractor sales | Number (in lakh) | 2.7 | 2.9 | 3.5 | | Two-wheeler sales | Number (in lakh) | 80.4 | 41.3 | 49.9 | | Fertiliser sales | Lakh tonnes | 212.2 | 253.6 | 221.7 | | Demand for employment (MGNREGA) | Crore households | 10.4 | 15.2 | 14.7 | | Agriculture and allied sector exports* | USD billion | 11.8 | 11.3 | 15.4 | | Agriculture credit growth* | y-o-y | 7.3 | 4.8 | 11.3 | | Rice stock to buffer norm* | Ratio | 2.2 | 2.6 | 2.9 | | Wheat stock to buffer norm* | Ratio | 1.5 | 1.9 | 1.9 | Sources: Tractor Manufactures Association; SIAM; Ministry of Chemicals and Fertilisers; Ministry of Rural Development; CMIE; RBI; and Food Corporation of India.
*: As at end-August. | III.2.2 Industry Industrial GVA posted y-o-y growth of 40.4 per cent in Q1:2021-22, aided by a favourable base effect (31.0 per cent contraction last year). On a sequential basis, industrial output contracted by 11.8 per cent in Q1, reflecting the loss of momentum in the face of the second wave. Industrial GVA trailed 3.1 per cent below its pre-pandemic level (Q1:2019-20); while mining and manufacturing remained below Q1:2019-20 levels, electricity, gas, water supply and other services exceeded Q1:2019-20 levels by 3.0 per cent (Chart III.19). The index of industrial production (IIP) rose by 44.7 per cent y-o-y during Q1:2021-22 on a negative base but remained 6.7 per cent below its level two years back. In Q2, the IIP expanded by 11.5 per cent y-o-y in July 2021, although it trailed marginally the pre-pandemic levels (July 2019). Sequentially, the IIP expanded in June-July after moderating in April and May. In terms of the use-based classification, all sectors except for consumer durables exceeded 2019-20 levels by July (Chart III.20). Manufacturing activity dipped in May but gained momentum in June-July. The production of motor vehicles, trailers, machinery equipment, electrical equipment, textiles and beverages supported IIP growth in July. 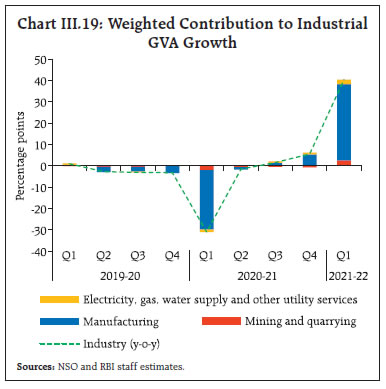
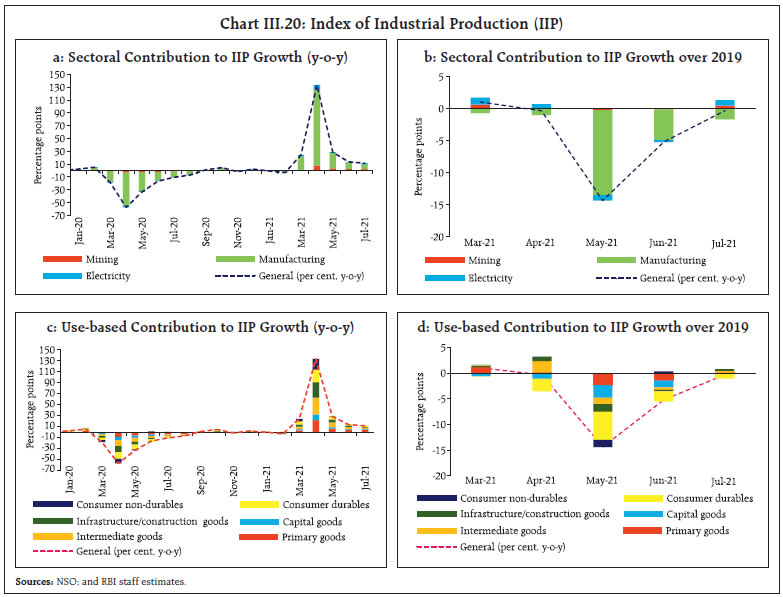 Manufacturing activity is expected to be boosted by the PLI scheme for 13 sectors, aimed at creating global manufacturing champions for an AtmaNirbhar Bharat, with an outlay of about Rs. 1.97 lakh crore over 5 years. The PLI scheme, implemented across ten sectors so far (Chart III.21), can improve the manufacturing sector’s global competitiveness and participation in the global supply chain, giving impetus to domestic production, exports, investment in cutting edge technology, innovations and employment opportunities by establishing linkages with the MSME sector. 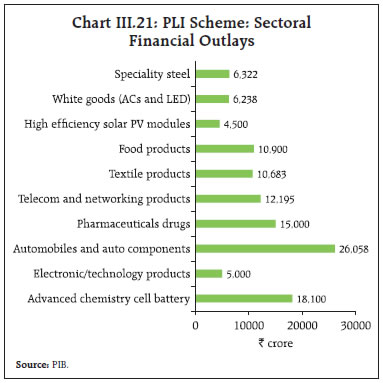
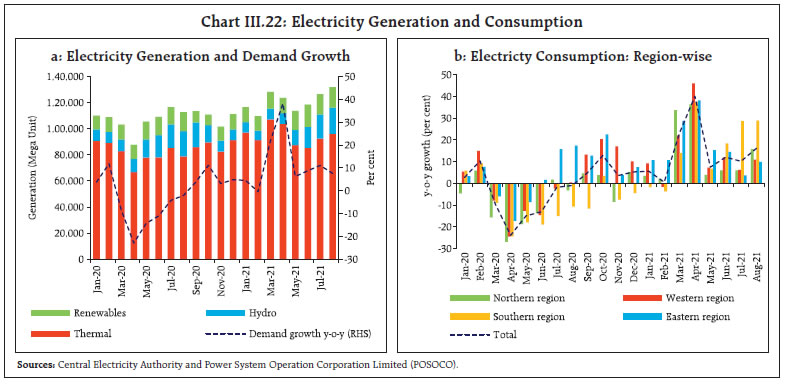 Electricity generation improved substantially in Q1:2021-22 on a y-o-y basis but remained below 2019-20 levels. Thermal and renewable sources expanded y-o-y by 24.1 per cent and 12.9 per cent, respectively, with the latter surpassing 2019-20 levels. In Q2, the electricity generation expanded by 1.6 per cent and 15.8 per cent, respectively, in July and August, with hydro and thermal power generation also exceeding pre-pandemic levels (Chart III.22a). Electricity consumption rose across the country in July and August, with base effects leading to faster growth in some regions (Chart III.22b). Competition and efficiency in electricity distribution should accrue from the Electricity Amendment Bill 2021 which aims to delicense electricity distribution and allow entry of private players. The buoyant y-o-y expansion in nominal GVA of manufacturing in Q1 was supported by strong corporate profitability (Chart III.23). Apart from the base effect, the substantial contraction in interest expenses on the back of easy financial conditions contributed to the surge in profitability, even as employee costs and operating expenses posted an uptick. According to the Reserve Bank’s industrial outlook survey, the manufacturing sector’s sentiments rebounded in Q2:2020-21, with the business assessment index improving to 116.7 in Q2:2021-22 from 89.7 in Q1:2021-22. For Q3:2021-22, respondents expect further improvement in production volumes, new orders and job landscape. The manufacturing purchasing managers’ index (PMI) remained in expansion zone at 53.7 in September, driven by strengthening demand conditions (Chart III.24a).
Overall, the manufacturing activity is gradually normalising with the waning of the second wave (Table III.9). Consumer non-durables, surpassed the pre-COVID levels during June and remained strong in Q2, while infrastructure and primary goods, steel, and cement made progress towards normalisation in June and surpassed pre-pandemic level in Q2. III.2.3 Services The second wave impacted the services sector in a disproportionately high manner in view of the blow to contact-intensive services. Services contracted by double digits sequentially in Q1:2021-22, interrupting the recovery from the first wave. On a y-o-y basis, however, the services sector expanded by 16.1 per cent in Q1:2021-22 driven by a favourable base effect. With the retreating of the second wave, services regained momentum in Q2 as shown by high frequency indicators, and contact-intensive services began mending with the gradual easing of restrictions and the accelerated pace of vaccination (Table III.9). GST collections and issuances of e-way bills – indicators of wholesale and retail trade – revived to pre-pandemic levels from June/July onwards, suggesting strengthening domestic trading activity. Some revival in discretionary spending and pent-up demand are also boosting trading activity and e-commerce. In the construction sector, cement production rose further while finished steel consumption moderated in August (Chart III.25). Transportation services remained relatively upbeat during Q1 and gained further in Q2 with the gradual unwinding of the regional lockdowns. Railway freight traffic remains above pre-COVID levels and posted a robust growth of 16.9 per cent in August, while port cargo traffic reached its pre-pandemic level in August. Toll collections in Q1 and Q2 have stayed above the pre-pandemic levels due to a greater use of FASTag (Table III.9). Commercial vehicle sales – an indicator of transportation services – almost halved sequentially in Q1, but there are reports of an uptick in sales in Q2. The aviation sector displayed segmentation, with passenger traffic lagging cargo traffic considerably. Domestic air passenger traffic is, however, gaining traction with the lifting of the restrictions and increasing confidence. The communication services performed well in Q1 and Q2, driven by pandemic-induced digitisation of the economy. Despite the strong performance of information technology and financial companies, GVA in financial, real estate and professional services posted a subdued growth of 3.7 per cent in Q1 and moderated substantially over the preceding quarter as businesses in other segments faltered due to mobility related restrictions. Some recovery, however, was seen in the travel and hospitality industries, real estate and other contact-intensive professional services in Q2. Growth in aggregate deposits remained buoyant and bank credit recorded some improvement, extending support to financial services during Q2. Real estate activity dampened in Q1 as new launches and sales were hampered by the lockdowns. The inventory overhang stagnated at an average of 58 months in Q1 (Chart III.26a). All-India housing prices, according to the RBI’s index, showed a deceleration in Q1:2021-22, dragged down by Bengaluru, Chennai and Delhi (Chart III.26b). 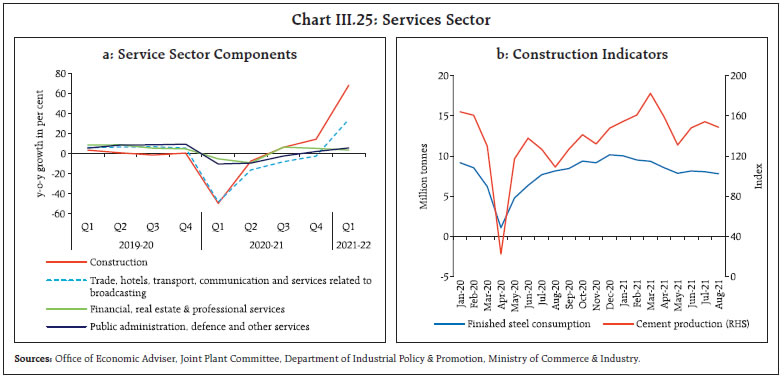
 Public administration, defence and other services (PADO) expanded moderately in Q1:2021-22 on a y-o-y basis. The central government’s revenue expenditure, excluding interest payments and subsidies, contracted in Q1 on an unfavourable base while that of state governments posted a double-digit growth. Other services in PADO – private education; heath; personal services; and cultural and recreational activities – remained tepid. In August and September, the PMI services re-entered the expansion zone reversing the second wave induced contraction of May-July (Chart III.24b). The PMI composite output index rose to 55.3 in September from 49.2 in July. III. Conclusion The momentum of economic activity was interrupted during Q1:2021-22 by the second wave. Aggregate demand began reviving in June and gained momentum in Q2. It is expected to strengthen further in H2 with the recovery in both urban and rural consumption. On the supply side, agriculture and allied activities should benefit from the good kharif sowing and harvest. Rabi sowing and total crops production are expected to be well-supported by improving water storage in reservoirs and the early announcement of minimum support prices for the ensuing rabi season. The recovery in manufacturing and services activities, including contact-intensive services, in H2 should get a fillip from the growing proportion of the inoculated population, further normalisation of supply chains, congenial financing conditions and the government’s infrastructure and asset monetisation push. The outlook, however, remains critically dependent upon the evolution of COVID-19’s trajectory and the progress of vaccination to cover the rest of the population. __________________________________________________________________________________
IV. Financial Markets and Liquidity Conditions During H1:2021-22, domestic financial markets remained vibrant amidst easy liquidity conditions, notwithstanding the ravages unleashed by the virulent second wave of the pandemic in April-May 2021. Monetary transmission improved further, due to abundant liquidity and forward guidance by the MPC of continuing with the accommodative stance. Going forward, liquidity conditions would continue to be accommodative in consonance with the monetary policy stance through calibrated liquidity management operations. Global financial markets remained exuberant through most of H1:2021-22, buoyed by a surfeit of liquidity, ultra-accommodative monetary policies in major advanced economies (AEs) and forward guidance promising continuation of these policies. Investor optimism has caused valuations across a range of assets to be elevated. Stock markets scaled peaks repeatedly in most AEs and select emerging market economies (EMEs), with intermittent bouts of corrections sparked by the rapid spread of the Delta variant of COVID-19. Bond yields softened in AEs as markets increasingly acquiesced with central banks that inflationary pressures are transient and would not trigger normalisation. In EMEs, bond yields experienced two-way movements, with phases of hardening in response to the uncertainty over the timing and pace of tapering of asset purchases by the US Federal Reserve. In currency markets, the US dollar strengthened from May 2021 on better economic prospects and consequently, some EME currencies depreciated while others faced appreciation pressures because of carry trade and search for returns. IV.1 Domestic Financial Markets During H1:2021-22, domestic financial markets remained vibrant amidst easy liquidity conditions, notwithstanding the ravages unleashed by the virulent second wave of the pandemic in April-May 2021. Large liquidity injections, including through the secondary market acquisition programme of government securities (G-SAP), ensured orderly conditions in financial markets. Concerns about a possible third wave, uncertainty over the path of the US Fed’s tapering of asset purchases, elevated inflation, and the large government borrowing programme kept market sentiments edgy. IV.1.1 Money Market Money market rates consistently traded below the reverse repo rate – the lower bound of the liquidity adjustment facility (LAF) corridor – during H1:2021-22 (Chart IV.1). The weighted average call rate (WACR) – the operating target of monetary policy – traded 17 basis points (bps) below the floor of the corridor on an average during H1. With the Reserve Bank becoming the major counterparty for banks, there was a shrinkage in inter-bank trading activity – average daily volume in the call money market declined to ₹7,381 crore in September 2021 from ₹10,126 crore in March 2021. 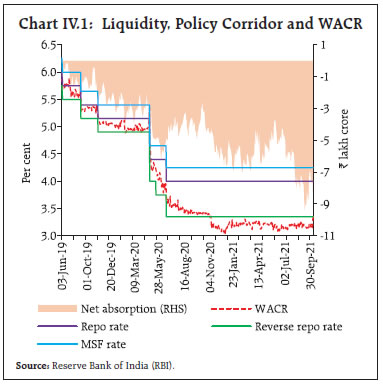 In the overnight call money segment, the weighted average rate (WAR) of traded deals generally remained above the reverse repo rate while that on reported deals1 remained below the reverse repo rate, reflecting market segmentation as small co-operative banks – principal lenders in reported deals – do not have the requisite information technology (IT) infrastructure to access the Negotiated Dealing System - Call (NDS-Call) and usually lend bilaterally towards the close of market hours at lower rates. The share of the reported deals in total volumes in the call money segment increased to 60 per cent in H1:2021-22 from 54 per cent in H2:2020-21 (Chart IV.2), driven by a rise in lending by co-operative banks from 65 per cent of the total volume of the call money segment to 80 per cent over the same period. The surplus liquidity conditions also led to a diminishing share of the uncollateralised segment in total overnight money market volume – from 6.0 per cent in February 2020 (pre-pandemic) to 2.0 per cent in September 2021. In the collateralised segment, the share of triparty repo in total overnight money market volume increased to 74 per cent in September 2021 from 72 per cent in March 2021 while the share of market repo declined to 24 per cent from 26 per cent during the same period (Chart IV.3). Mutual funds, the major lenders in both the collateralised segments, increased their participation further in H1 from 68 per cent to 70 per cent in the triparty repo segment and from 61 per cent to 63 per cent in market repos. On the borrowing side, there was an increase in the share of private banks in both the secured segments – from 24 per cent in March 2021 to 25 per cent in September 2021 for triparty repo and from 13 per cent to 14 per cent for market repo. 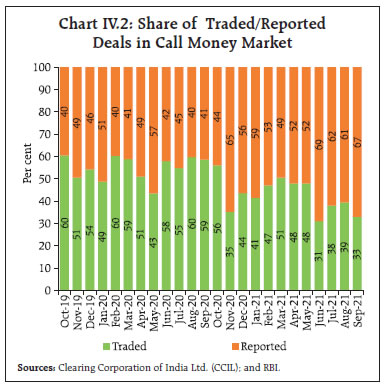 The rates in the secured overnight segments remained consistently below the reverse repo rate during H1:2021-22 on surplus liquidity (Chart IV.4). Interest rates on longer-term money market instruments like 91-day Treasury Bills (T-bills) and 3-month certificates of deposit (CDs) traded marginally above the reverse repo rate, on average, by 1 bp and 8 bps, respectively during H1:2021-22. Issuance of CDs increased to ₹56,658 crore during H1:2021-22 from ₹45,165 crore in the corresponding period of 2020-21, reflecting congenial financing conditions. 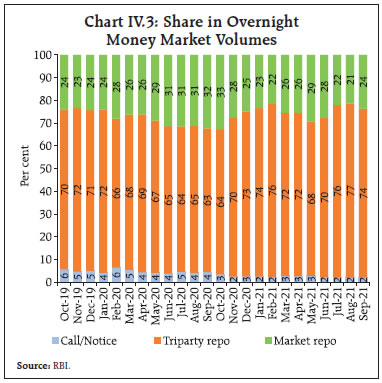
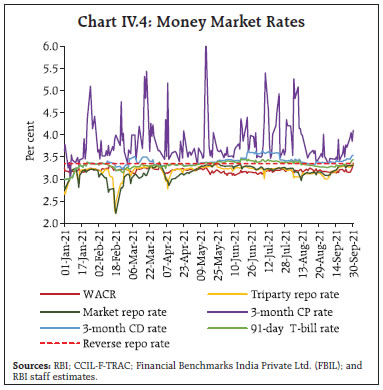 Riding on the surplus liquidity conditions, commercial paper (CP) issuances increased substantially to ₹10.1 lakh crore during H1:2021-22 from ₹7.9 lakh crore during the corresponding period of 2020-21 (Chart IV.5a). CP rates generally traded above the reverse repo rate, with an average spread of 46 bps during H1:2021-22. The weighted average discount rate (WADR) firmed up in July 2021 due to increased issuances by non-banking financial companies (NBFCs), partly to mobilise resources for investment in initial public offerings (IPOs), but moderated subsequently. The share of NBFCs in total CP issuances increased to 43.2 per cent in H1: 2021-22 from 21.9 per cent in the corresponding period of the previous year while that of corporates moderated to 46.2 per cent from 64.9 per cent over the same period (Chart IV.5b). IV.1.2 Government Securities (G-sec) Market During H1:2021-22, the 10-year G-sec yield softened by 11 bps, aided by a host of measures taken by the Reserve Bank to foster an orderly evolution of the yield curve. During April-May 2021, the 10-year G-sec yield softened by 6 bps on (i) the monetary policy committee (MPC) continuing with its accommodative growth-supportive stances; (ii) the announcement of G-SAP 1.0 of ₹1 lakh crore for Q1; and (iii) special OMOs (operation twist) of ₹10,000 crore, although fears of additional government borrowing to bridge the GST compensation cess shortfall imparted transient bearishness to market sentiment. Yields hardened in June by 8 bps over elevated May inflation print and higher crude oil prices. Overall, however, the 10-year yield remained range bound during Q1:2021-22. In Q2, the 10-year yield initially declined to 6.13 per cent on July 15, 2021 aided by a lower than expected CPI inflation print for June and issuance of a new 10-year benchmark security at a coupon of 6.10 per cent (Chart IV.6). In August, however, yields hardened by 5 bps in reaction to the MPC’s inflation forecast being revised upwards above expectations and fears of liquidity tightening on the announcement of a calendar for an enhanced scale of variable rate reverse repo (VRRR) auctions. In the first half of September, yields softened as these apprehensions were allayed, along with (i) the resumption of portfolio debt inflows; (ii), lower than expected fiscal deficit of the central government for April-July; and (iii) a softer CPI inflation print. Yields, however, firmed up during the second half of the month tracking US treasury yields and hardening crude oil prices. The dynamics of movements in the yield curve can be captured by its level and slope2 (Chart IV.7a). While the average level of yields softened by 3 bps, the slope steepened by 28 bps during H1. Short term yields remained anchored around the policy rate while long term yields reflected inflation concerns and the size of the government borrowing programme (Chart IV.7b). At the shorter end of the secondary market, yields on treasury bills (T-bills) softened and traded below the reverse repo rate for some maturities (Chart IV.8). In terms of the traded volume, 91-day T-bills remained the dominant segment in the secondary market with a share of about 41 per cent. In order to facilitate debt consolidation, the Reserve Bank conducted six switch operations on behalf of the central government amounting to ₹31,907 crore during H1:2021-22. The weighted average maturity (WAM) of the outstanding stock of G-secs increased to 11.57 years at end-September 2021 from 11.31 years at end-March 2021. The weighted average coupon (WAC) moderated to 7.15 per cent from 7.27 per cent over the same period.
State Development Loans The weighted average spread of cut-off yields on state development loans (SDLs) over G-sec yields of comparable maturities declined to 48 bps in H1:2021-22 from 53 bps in H1:2020-21 (Chart IV.9). The average inter-state spread on securities of 10-year tenor (fresh issuances) was 4 bps in H1:2021-22 as compared with 9 bps in H1:2020-21. IV.1.3 Corporate Bond Market Corporate bond yields softened during H1:2021-22 while risk premia (over G-sec yields of comparable maturities) exhibited a mixed trend amidst moderation in new issuances. The monthly average yield on AAA-rated 3-year bonds issued by NBFCs declined by 37 bps to 5.32 per cent, while those on corporates and public-sector undertakings (PSUs), financial institutions (FIs) and banks moderated by 32 bps to 5.24 per cent and by 48 bps to 5.33 per cent, respectively (Chart IV.10a). During the same period, the monthly average risk premium or spread on AAA-rated 3-year bonds (over 3-year G-sec yields) increased marginally from 48 bps to 49 bps for NBFCs and from 35 bps to 40 bps for corporates while moderating from 60 bps to 50 bps for PSUs, FIs and banks (Chart IV.10b). 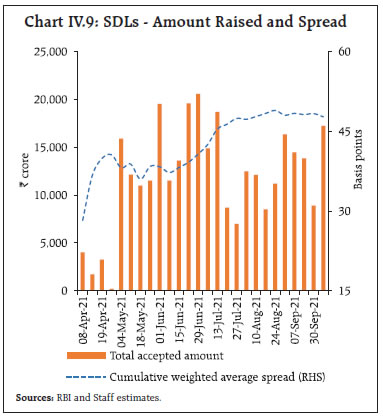
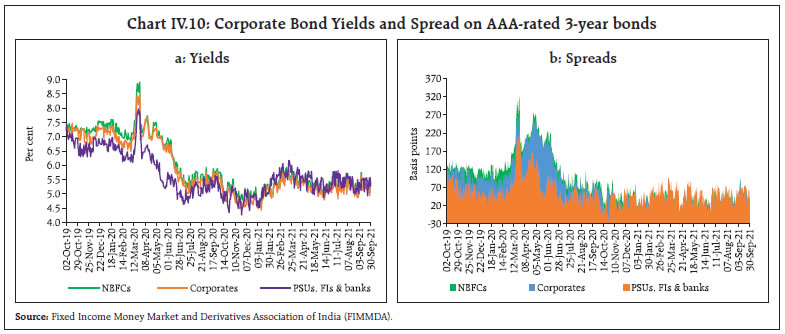 Corporate bond yields eased across tenors and ratings spectrum. For the lowest rated investment grade corporate bonds (BBB-), yields declined by 18 bps (Table IV.1). The market perception of credit risk also improved, with the 3-year credit default swap (CDS) spreads for the State Bank of India and the ICICI Bank moderating by 2 bps and 3 bps, respectively, during H1. Issuances of corporate bonds in the primary market declined to ₹1.81 lakh crore during H1:2021-22 (up to August 2021) from ₹3.17 lakh crore during the corresponding period of the previous year (Chart IV.11a). Resource mobilisation in the corporate bond market was overwhelmingly through the private placement route (97.0 per cent). Outstanding investments by foreign portfolio investors (FPIs) in corporate bonds declined marginally from ₹1.33 lakh crore at end-March 2021 to ₹1.28 lakh crore at end-September 2021. Consequently, their utilisation of the approved limits declined from 24.5 per cent to 22.3 per cent. The daily average secondary market trading volume declined by 26.0 per cent to ₹7,056 crore during H1 (up to August 2021) over the corresponding period of the previous year, in sync with the reduction in new issuances (Chart IV.11b). | Table IV.1: Financial Markets - Rates and Spread | | Instrument | Interest Rates (per cent) | Spread (bps) (over corresponding risk-free rate) | | Mar 2021 | Sep 2021 | Variation (in bps) | Mar 2021 | Sep 2021 | Variation (in bps) | | 1 | 2 | 3 | (4 = 3-2) | 5 | 6 | (7 = 6-5) | | Corporate Bonds | | | | | | | | (i) AAA (1-yr) | 4.30 | 4.17 | -13 | 32 | 35 | 3 | | (ii) AAA (3-yr) | 5.56 | 5.24 | -32 | 35 | 40 | 5 | | (iii) AAA (5-yr) | 6.27 | 5.88 | -39 | 17 | 4 | -13 | | (iv) AA (3-yr) | 6.31 | 6.07 | -24 | 110 | 124 | 14 | | (v) BBB-minus (3-yr) | 10.17 | 9.99 | -18 | 496 | 516 | 20 | | 10-yr G-sec | 6.19 | 6.18 | -1 | | | | Note: Yields and spreads are computed as monthly averages.
Source: FIMMDA and Bloomberg. |
Most of the debt issuances in H1:2021-22 were undertaken by firms in financial services, banking/term lending, and the housing finance sector (Chart IV.12). IV.1.4 Equity Market The Indian equity market scaled new highs in H1:2021-22, lifted by the gradual normalisation of economic activity post the second wave, strong corporate earnings, and pick-up in the vaccination drive. The BSE Sensex gained 19.4 per cent in H1 to close at 59,126 on September 30, 2021 (Chart IV.13a). Indian equities emerged as the best performing amongst peers on a year to date (YTD) basis (Chart IV.13b) with their share in world market capitalisation increasing to 2.93 per cent on September 30, 2021 from the long-term average of 2.43 per cent (Chart IV.13c). During H1:2021-22, FPIs were net buyers to the tune of ₹ 8,326 crore while net purchases of domestic institutional investors (DIIs) amounted to ₹47,763 crore (Chart IV.13d). 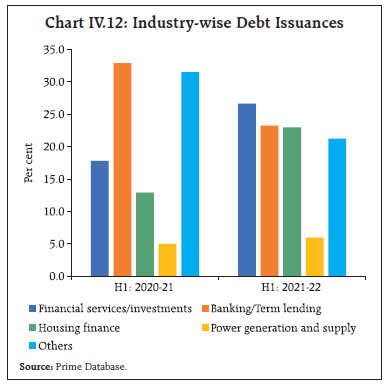 The bull run rode on higher domestic participation, buoyed by the increasing interest of retail investors. Direct retail holdings in NSE listed stocks rose to 7.2 per cent of market capitalisation in June 2021 from 6.4 per cent in December 2019 (Chart IV.14a). The number of dematerialised (Demat) accounts with the country’s two main depositories has gone up from 5.5 crore at end-March 2021 to 6.49 crore at end-July 2021. Furthermore, indirect retail participation through monthly systematic investment plans (SIPs) reached a new high of ₹9,923 crore in August – 8.1 per cent above March 2021. The number of retail SIP accounts surged to 4.3 crore with 24.9 lakh new accounts registered in August – the highest-ever monthly registration (Chart IV.14b). 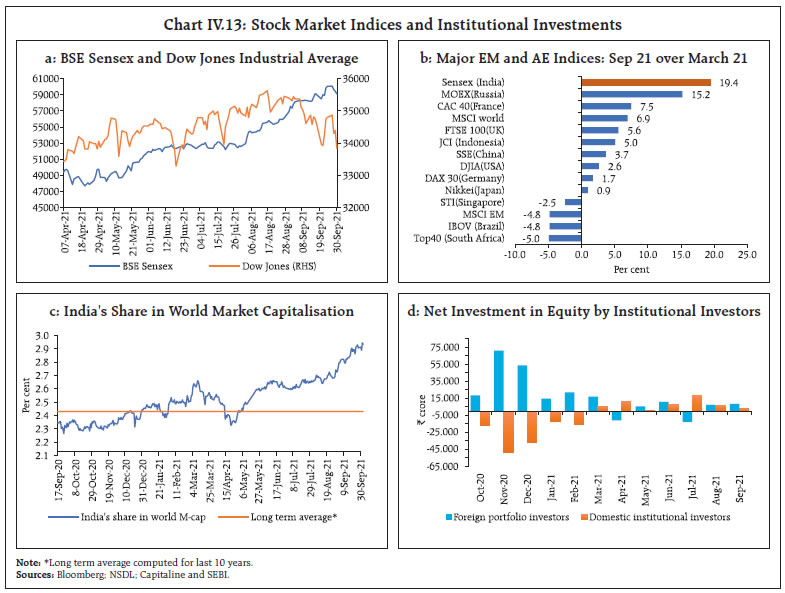 The exuberance in the equity market was also reflected in the IPO segment. During H1:2021-22, 22 IPOs were listed, mobilising ₹46,316 crore as against ₹1,798 crore in the corresponding period last year (Chart IV.15a). The amounts raised through rights issues, however, fell sharply to ₹793 crore in H1from ₹59,983 crore during the corresponding period of the previous year. The total mobilisation through public and rights issues reduced to ₹50,529 crore from ₹76,830 crore over the same period.
The equity risk premium (ERP)3 – the difference between returns on equity and the risk-free rate – eased through H1:2021-22 with the gradual recovery in market sentiments and moderated from 6.3 per cent at the height of the pandemic (end-March 2020) to 3.2 per cent by end-September 2021, moving below the pre-pandemic level (Chart IV.15b). IV.1.5. Foreign Exchange Market The Indian rupee (INR) exhibited two-way movements in H1:2021-22. It traded with a depreciating bias in April 2021 and touched ₹75.17 per US dollar on April 15 amidst FPI outflows and an appreciation of the US dollar (Chart IV.16). The depreciating bias quickly reversed as FPI flows rebounded with a sharp fall in domestic COVID-19 cases and a weakening US dollar. By May 28, the INR appreciated to ₹72.48. In June, it traded with a depreciation bias, despite robust FPI equity inflows, as the US dollar gained traction. Since then, the INR has moved in both directions driven by FPI flows, crude oil prices and incoming information on monetary policy normalisation plans of major advanced economies.
The depreciation of the INR in nominal terms (against the US dollar) as well as the appreciation of the real effective exchange rate (REER) in H1 was modest relative to EME peers (Chart IV.17). In terms of the 40-currency nominal effective exchange rate (NEER), the INR depreciated by 0.9 per cent (at end-September 2021 over the average of March 2021), while it appreciated by 1.3 per cent in terms of the 40-currency REER (Table IV.2). The divergence between the two indices essentially reflects India’s higher inflation vis-à-vis its major trading partners. Table IV.2: Nominal and Real Effective Exchange Rate Indices (Trade-weighted)
(Base: 2015-16 = 100) | | Item | Index: end-September 2021 (P) | Appreciation (+) / Depreciation (-) (Per cent) | end-September 2021 over
March (average) 2021 | | 40-currency REER | 105.3 | 1.3 | | 40-currency NEER | 94.2 | -0.9 | | 6-currency REER | 103.2 | 1.5 | | 6-currency NEER | 87.6 | -1.1 | | ₹/US$ | 74.26 | -2.0 | P: Provisional.
Sources: RBI; and FBIL. | IV.1.6 Credit Market During H1, credit offtake improved, with non-food credit growth (y-o-y) increasing to 6.8 per cent on September 24, 2021 from 5.1 per cent a year ago (Chart IV.18). Credit growth among public sector banks remained modest, while there has been some uptick in the case of the private sector banks (Chart IV.19a), which have provided the bulk (56.7 per cent) of the incremental credit extended by scheduled commercial banks (SCBs) on a y-o-y basis (as on September 24, 2021). They were followed by public sector banks (33.3 per cent) and foreign banks (10.0 per cent) (Chart IV.19b). Among the major sectors4, credit to agriculture continued to register double-digit growth since April 2021 and accelerated to 11.3 per cent (y-o-y) in August 2021 on the back of a favourable monsoon and measures to support the farm sector (Chart IV.20a). Industrial credit growth remained subdued, mainly due to a decline in credit to large industries (which account for more than 80 per cent of credit extended to the sector). Credit to medium, and micro and small industries improved, benefitting from the government’s support measures for the MSME sector and the enhancement of the emergency credit line guarantee scheme (ECLGS) to support COVID-19 affected sectors. Services sector credit growth decelerated, dampened by the second wave of the pandemic. In terms of the contribution of different sectors in incremental credit (y-o-y basis), personal loans accounted for the largest share (52.5 per cent) followed by the agriculture sector (22.2 per cent) (Chart IV.20b). The overall non-food credit growth in H1:2021-22 remains primarily driven by personal loans and credit to the agriculture sector (Chart IV.20c). Within industry, credit to textiles, and chemicals and chemical products registered accelerated growth in H1:2021-22 (up to August). Credit to infrastructure – which accounts for around 38 per cent of industrial credit – also showed improvement, led by credit to roads and airports. Credit growth to food processing, beverage and tobacco lost momentum, while credit to basic metal and metal products contracted (Chart IV.21a). The prime drivers of overall credit growth to industry were infrastructure and textiles (Chart IV.21b). 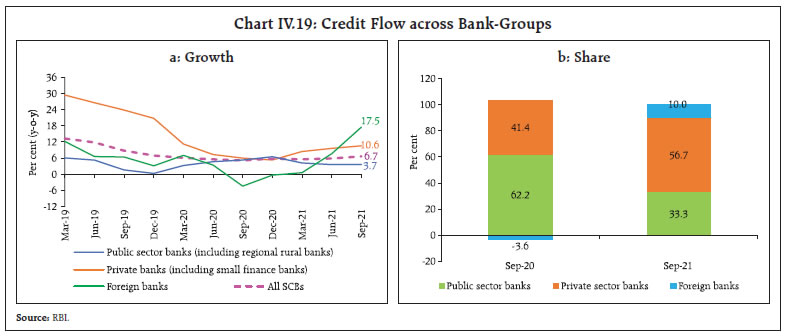
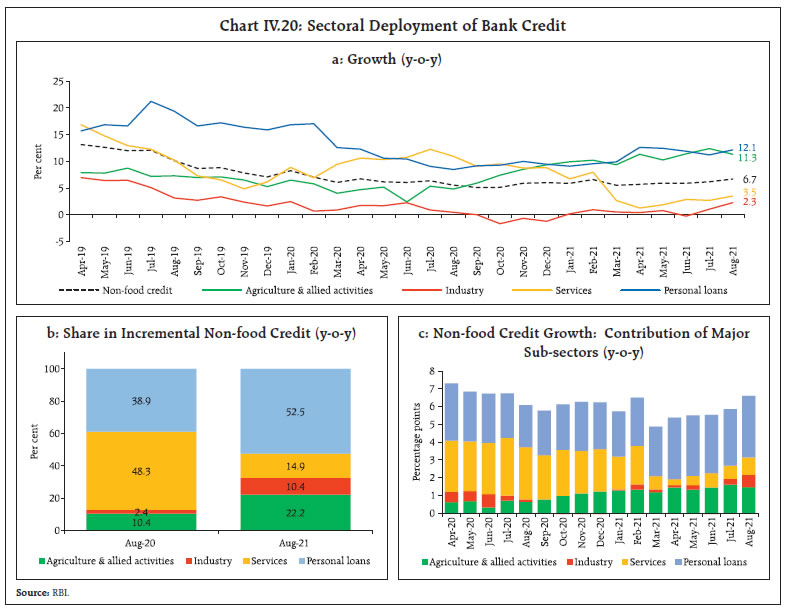 Credit growth to the services sector decelerated to 3.5 per cent in August 2021 from 10.9 per cent a year ago, largely due to slowdown in credit to NBFCs that have been raising resources mainly from money and debt markets. Credit growth to transport operators, however, recovered in August 2021 after slipping into negative territory in April 2021 (Chart IV.21c). Credit to the trade sector contributed 1.5 percentage points to the overall credit growth of the services sector in August 2021 (Chart IV.21d). Credit growth to personal loan segment accelerated to 12.1 per cent in August 2021 from 8.5 per cent a year ago, supported by special schemes of banks to support households during the pandemic. Credit to housing, the largest constituent of the personal loan segment, showed signs of recovery in H1: 2021-22 (up to August 2021). 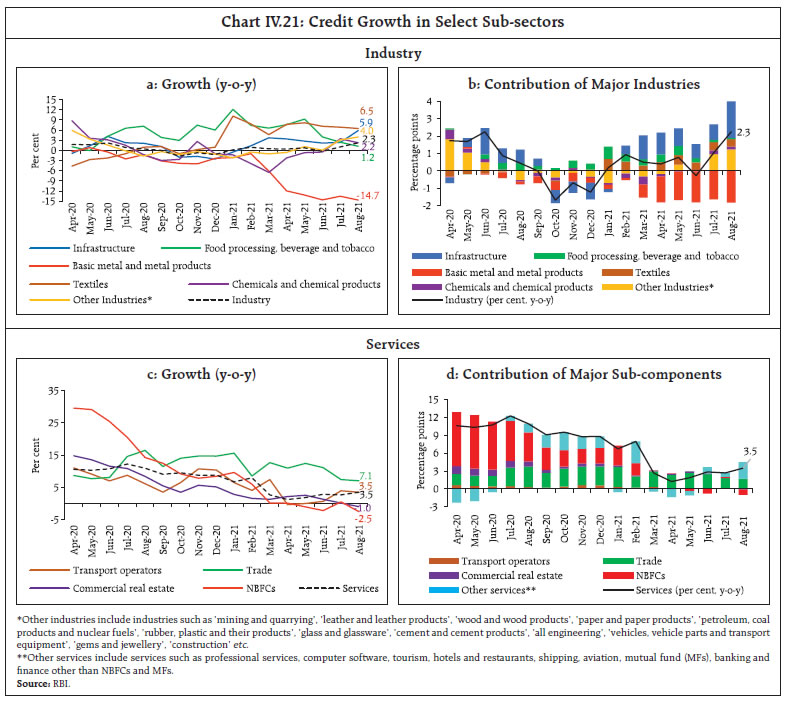 The asset quality of SCBs improved during 2021-22 (up to June), with the overall non-performing assets (NPA) ratio declining to 7.5 per cent in June 2021 from 8.0 per cent a year ago (Chart IV.22a). The NPA ratio in respect of retail loans and services increased over the same period (Chart IV.22b). Banks’ non-SLR investments – covering instruments like CPs, bonds, debentures and shares of public and private corporates – were lower during H1:2021-22 than a year ago mainly due to lower investment in bonds/shares and debentures (Chart IV.23a). Adjusted non-food credit5 growth increased from 5.1 per cent in Q2:2020-21 to 6.2 per cent in Q2:2021-22 (Chart IV.23b). With credit offtake remaining muted relative to deposit growth, banks augmented their statutory liquidity ratio (SLR) portfolios. Excess SLR investments rose to 12.5 per cent of net demand and time liabilities (NDTL) on September 10, 2021 from 11.0 per cent of NDTL at end-March 2021. This provides banks the cushion to meet their liquidity coverage ratio (LCR) requirements and collateral buffers for availing the liquidity adjustment facility (LAF) of the RBI (Chart IV.24). IV.2 Monetary Policy Transmission Monetary transmission to deposit and lending rates of banks improved further in H1:2021-22. The abundance of systemic liquidity, forward guidance by the MPC of continuing with the accommodative stance, subdued credit demand and the introduction of the external benchmark regime for select sectors in October 2019 aided monetary transmission. There has been a complete pass-through of the policy repo rate cuts to the weighted average lending rate (WALR) on fresh rupee loans since October 2019 (Table IV.3).
The transmission of policy repo rate cuts to the WALR on outstanding loans has also been sizeable at 120 bps in the external benchmark period (Box IV.1). | Table IV.3: Transmission from the Repo Rate to Banks’ Deposit and Lending Rates | | (Variation in basis points) | | Period | Repo Rate | Term Deposit Rates | Lending Rates | Median TDR
(Fresh Deposits) | WADTDR
(Out-standing Deposits) | 1 - Year Median MCLR | WALR
(Out-standing Rupee Loans) | WALR
(Fresh Rupee Loans) | | February 2019 - September 2019 (Pre-External Benchmark Period) | -110 | -9 | -7 | -30 | 2 | -43 | | October 2019 – September 2021 (External Benchmark Period) | -140 | -187 | -174 | -125 | -120 | -147 | | March 2020 - September 2021 (COVID period) | -115 | -154 | -135 | -103 | -102 | -121 | | February 2019 – September 2021 (Current Easing Cycle) | -250 | -213 | -181 | -155 | -118 | -190 | | Memo | | | | | | | | April 2021 – September 2021 | 0 | 0 | -18 | -5 | -12 | 1 | Note: Latest data on WALRs and WADTDR pertain to August 2021.
WALR: Weighted average lending rate; WADTDR: Weighted average domestic term deposit rate;
MCLR: Marginal cost of funds-based lending rate; TDR: Term deposit rate.
Source: RBI. |
Box IV.1: External Benchmark Regime and Transmission to Lending Rates While the Reserve Bank has periodically refined the process of interest rate setting by banks, transmission has hitherto been sluggish as banks relied on own cost of funds, i.e., internal benchmarks. The systems were also characterised by opacity, especially regarding the interest rate resetting practices for existing borrowers. To address these rigidities, the Reserve Bank decided to move to an external benchmark system – an interest rate outside the control of a bank and not necessarily linked to its internal costs – for select categories of loans (viz., all new floating rate personal or retail loans and floating rate loans to micro and small enterprises (MSEs) to the policy repo rate or 3-month or 6-month T-bill rate or other specified benchmarks effective October 1, 2019 and for medium enterprises effective April 1, 2020). Under this system, any change in the benchmark rate is mandated to be passed on to the lending rates for new and existing borrowers on a one-to-one basis and banks are prohibited from adjusting their spreads for existing borrowers for a period of three years in the absence of any significant credit event. Reflecting the regulatory requirement, the share of external benchmark-linked loans in total outstanding floating rate loans increased from 2.4 per cent in September 2019 to 32 per cent in June 2021, contributing to a faster and fuller transmission. | Table IV.1.1: Outstanding Floating Rate Rupee Loans of SCBs across Interest Rate Benchmarks | | (Per cent to total) | | Bank group | Base Rate | MCLR | External Benchmark | | Sep-19 | Mar-20 | Mar-21 | Jun-21 | Sep-19 | Mar-20 | Mar-21 | Jun-21 | Sep-19 | Mar-20 | Mar-21 | Jun-21 | | Public sector banks | 15.0 | 12.3 | 7.9 | 8.1 | 82.7 | 80.9 | 69.1 | 66.5 | 0.4 | 4.9 | 20.3 | 23.9 | | Private banks | 8.3 | 6.8 | 3.9 | 3.6 | 86.7 | 74.9 | 52.6 | 49.6 | 4.6 | 17.3 | 42.7 | 46.1 | | Foreign banks | 6.8 | 5.2 | 2.7 | 2.7 | 67.3 | 56.7 | 30.7 | 33.5 | 25.7 | 37.9 | 66.6 | 63.7 | | All SCBs | 12.7 | 10.5 | 6.5 | 6.5 | 83.6 | 78.5 | 62.9 | 60.2 | 2.4 | 9.4 | 28.5 | 32.0 | Note: Data pertain to 74 SCBs. Figures in table may not add up to hundred due to residual BPLR-linked loans.
Source: RBI. | There has been a concomitant fall in the share of MCLR-linked loans from 83.6 per cent to 60.2 per cent, over the same period, although these still have the largest share in outstanding floating rate loans (Table IV.1.1). As lending rates under the external benchmark regime undergo automatic adjustments with the changes in the benchmark rate, banks are incentivised to adjust their term as well as saving deposit rates to cushion their net interest margins and profitability, which then hastens the adjustment in banks’ marginal cost of funds, and MCLRs (Chart IV.2.1). An error correction model (ECM) using the autoregressive distributed lag (ARDL) framework (Pesaran et al., 2001) for the period January 2013 to June 2021 with the following variables – weighted average lending rate on fresh rupee loans (WALR_f ), repo rate (REPO) and credit to deposit ratio (CD Ratio) – indicates that a 100 bps change in the repo rate results in 93 bps change in the WALR on fresh loans over time (equation 1)6. 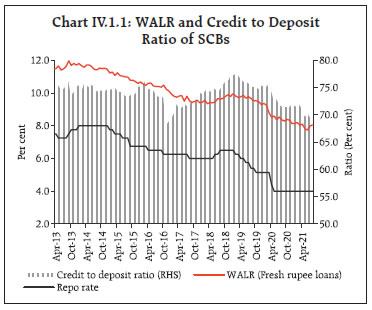
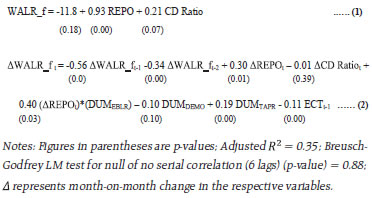 The adjustment, however, takes time as indicated by the error correction coefficient of 0.11 (equation 2), i.e., 11 per cent of the deviation from the equilibrium relationship is corrected every month7. Thus, it takes six months for one-half of the long-run pass-through. The speed of adjustment can be expected to improve as the proportion of external benchmark linked loans increases further. This is borne out by the statistical significance of the interaction between the changes in the repo rate and the dummy representing the external benchmark period (∆REPOt*DUMEBLR). References: Pesaran, M.H, Shin, Y. and Smith, R.J. (2001), “Bounds Testing Approaches to the Analysis of Level Relationships”, Journal of Applied Econometrics, 16, 289-326. Reserve Bank of India (2017), “Report of the Internal Study Group to Review the Working of the Marginal Cost of Funds-based Lending Rate System”. |
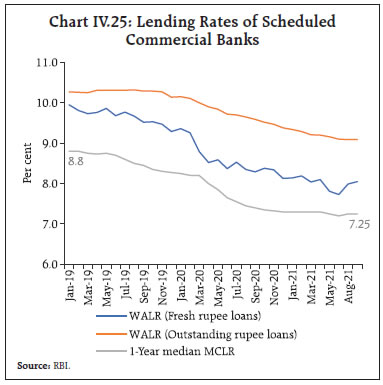 This has been facilitated by the sustained reduction in the marginal cost of funds-based lending rate (MCLR) – the one-year median MCLR fell from 8.8 per cent in January 2019 to 7.25 per cent in August 2021 (Chart IV.25)8. Across bank groups, foreign banks exhibited maximum transmission to lending and deposit rates, reflecting a higher proportion of their liabilities being made up of low cost and lower duration wholesale deposits, which facilitates a faster repricing of interest rates (Chart IV.26). Among domestic banks, public sector banks (PSBs) and private sector banks (PvBs) exhibited a similar degree of pass-through to lending rates. The WALRs of PSBs, however, remain lower than those of PvBs9. The decline in WALRs on fresh rupee loans as well as outstanding rupee loans has been broad-based across sectors. For fresh loans, the decline in WALR was the sharpest in the case of education loans, followed by other personal loans and loans to large industries (Chart IV.27).
Spreads of WALRs on fresh rupee loans (relative to 1-year MCLR) are the lowest in the large industry segment. Among retail loans, the spread charged by domestic banks was the lowest in respect of housing loans, given the lower risk of default and the availability of collateral. Other personal loans, i.e., loans other than housing, vehicle and education are mostly unsecured and carry higher credit risk, mirrored in higher spreads (Chart IV.28). The WALRs in respect of fresh rupee loans in the retail segment and loans to MSMEs declined significantly during the period October 2019-August 2021 (Chart IV.29). In respect of fresh rupee loans linked to the policy repo rate, the spread – WALR (fresh rupee loans) over the repo rate – charged by domestic banks during August 2021 was the lowest in the case of housing loans and the highest in the case of other personal loans, in line with their risk profiles. The spreads charged by PSBs for vehicle and education loans were lower than those of private banks, while they were higher for MSME loans and other personal loans (Table IV.4). 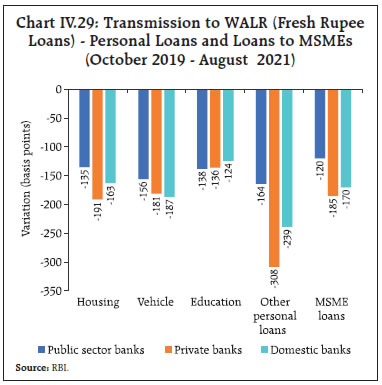 There has been a moderation in deposit rates across tenors (Chart IV.30a). The median term deposit rate on fresh deposits – based on average card rates on fresh deposits across all tenors – has declined by 154 bps since March 2020 with a perceptible moderation in shorter tenor deposits of up to one-year maturity (180 bps) (Chart IV.30b). Consequently, the weighted average domestic term deposit rate (WADTDR) on outstanding rupee deposits declined by 135 bps during the period March 2020 to August 2021. The median saving deposit rate for domestic banks, which had remained sticky at 3.5 per cent during October 2017 to May 2020, declined to 3 per cent in June 2020 and has remained at the same level since then. | Table IV.4: Loans Linked to External Benchmark – Spread of WALR (Fresh Rupee Loans) over the Repo Rate (August 2021) | | (Per cent) | | | Personal Loans | | | Housing | Vehicle | Education | Other personal loans | MSME loans | | Public sector banks | 3.20 | 3.56 | 4.40 | 5.04 | 4.83 | | Private sector banks | 3.19 | 3.89 | 6.07 | 4.31 | 3.97 | | Domestic banks | 3.19 | 3.60 | 4.75 | 4.98 | 4.47 | | Source: RBI. |
Amongst domestic banks, PvBs have exhibited higher pass-through to term deposit rates compared to PSBs, resulting in some convergence in the levels of their deposit rates (Chart IV.31). Interest rates on small saving schemes are administered by the Government of India and are fixed on a quarterly basis at a spread of 0-100 bps over and above G-sec yields of comparable maturities. The Government has left the interest rates on various small savings instruments unchanged since Q2:2020-21. The currently prevailing rates are 47-178 bps higher than the formula-based rates for Q3:2021-22 (Table IV.5). With the moderation in interest rates on bank deposits and unchanged interest rates on small savings, the latter have become attractive to depositors. The growth in accretions under small savings has consistently been above that of bank deposits since 2018 and the gap has widened, with implications for monetary transmission as and when credit demand picks up (Chart IV.32). 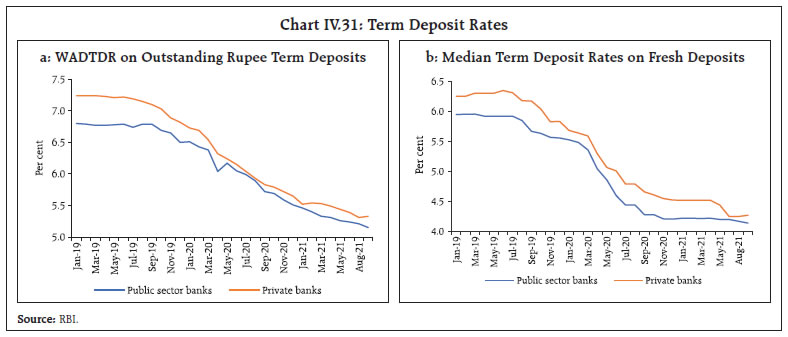
| Table IV.5: Interest Rates on Small Savings Instruments – Q3:2021-22 | | Small Savings Scheme | Maturity
(years) | Spread
(Percentage point) $ | Average G-sec Yield (%) of Corresponding Maturity
(June 2021 - August 2021) | Formula based Rate of Interest (%)
(applicable for Q3:2021-22) | Government Announced Rate of Interest (%) in Q3:2021-22 | Difference
(basis points) | | (1) | (2) | (3) | (4) | (5) = (3) + (4) | (6) | (7) = (6) - (5) | | Savings Deposit | - | - | - | - | 4.00 | - | | Public Provident Fund | 15 | 0.25 | 6.38 | 6.63 | 7.10 | 47 | | Term Deposits | | | | | | | | 1 Year | 1 | 0 | 3.72 | 3.72 | 5.50 | 178 | | 2 Year | 2 | 0 | 4.23 | 4.23 | 5.50 | 127 | | 3 Year | 3 | 0 | 4.74 | 4.74 | 5.50 | 76 | | 5 Year | 5 | 0.25 | 5.76 | 6.01 | 6.70 | 69 | | Recurring Deposit Account | 5 | 0 | 4.74 | 4.74 | 5.80 | 106 | | Monthly Income Scheme | 5 | 0.25 | 5.73 | 5.98 | 6.60 | 62 | | Kisan Vikas Patra | 124 Months# | 0 | 6.38 | 6.38 | 6.90 | 52 | | NSC VIII issue | 5 | 0.25 | 5.89 | 6.14 | 6.80 | 66 | | Senior Citizens Saving Scheme | 5 | 1.00 | 5.76 | 6.76 | 7.40 | 64 | | Sukanya Samriddhi Account Scheme | 21 | 0.75 | 6.38 | 7.13 | 7.60 | 47 | $: Spreads for fixing small saving rates as per Government of India Press Release of February 2016.
#: Current maturity is 124 months.
Note: Compounding frequency varies across instruments.
Sources: Government of India; FBIL; and RBI staff estimates. |
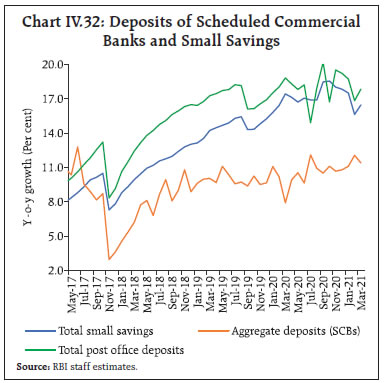 IV.3 Liquidity Conditions and the Operating Procedure of Monetary Policy The RBI Act, 1934 requires the Reserve Bank to place the operating procedure relating to the implementation of monetary policy and changes thereto from time to time, if any, in the public domain. In consonance with the MPC’s accommodative stance, the Reserve Bank continued with liquidity easing measures during H1:2021-22, aimed at nurturing and supporting the nascent growth impulses. The RBI announced a secondary market G-sec acquisition programme or G-SAP 1.0 in April 2021, with a commitment to a specific amount of open market purchases of government securities. The G-SAP is unconventional on several counts. First, the RBI commits upfront the amount to be purchased in contrast to regular OMO purchases which are discretionary. Second, it entails continued support to the market in view of the large government borrowing programme. Third, the size of the purchases is significantly larger than OMOs in normal times, thus boosting demand for G-secs amidst elevated supply during 2021-22. During Q1, the RBI conducted three auctions under G-SAP 1.0 and purchased G-secs (including SDLs) of ₹1.0 lakh crore, in line with the announced amount. In Q2, six auctions were conducted under G-SAP 2.0 aggregating ₹1.2 lakh crore. The G-SAP 2.0 auctions conducted on September 23 and September 30, 2021 for ₹15,000 crore each were accompanied by simultaneous sales of G-secs of identical amount. Overall, net liquidity injected through OMO purchases, including G-SAP, amounted to ₹2.4 lakh crore in HI. Under the G-SAP, the RBI purchased both on the run (liquid) and off the run (illiquid) securities across the maturity spectrum, with more than 68 per cent of the purchases concentrated in over 5 to 10-year maturity segment, thus imparting liquidity to securities across the term structure (Table IV.6). By containing volatility in G-sec yields – the benchmarks for the pricing of other financial market instruments – G-SAP helped to keep interest rates benign, thereby facilitating monetary transmission. | Table IV.6: G-SAP- Maturity Profile | Residual Maturity
(Years) | Type of security | G-SAP 1.0 | G-SAP 2.0 | Face value of G-sec purchased
(₹ crore) | Share in total purchases
(per cent) | Face value of G-sec purchased
(₹ crore) | Share in total purchases
(per cent) | | Up to 5 | On the run | - | - | 6,885 | 5.7 | | Off the run | 17,541 | 18.5 | 7,019 | 5.8 | | Total | 17,541 | 18.5 | 13,904 | 11.6 | | Over 5 to 10 | On the run | 42,635 | 45.1 | 4,377 | 3.6 | | Off the run | 20,774 | 22.0 | 79,763 | 66.5 | | Total | 63,409 | 67.0 | 84,140 | 70.1 | | Over 10 to 14 | On the run | 5,882 | 6.2 | 15,973 | 13.3 | | Off the run | 7,743 | 8.2 | 5,984 | 5.0 | | Total | 13,625 | 14.4 | 21,957 | 18.3 | | Grand Total | 94,575* | 100.0 | 1,20,001 | 100.0 | *: Total purchases made under G-SAP 1.0 amounted to ₹1.0 lakh crore, which includes G-sec of ₹0.95 lakh crore and SDLs of ₹0.05 lakh crore.
Source: RBI | Drivers and Management of Liquidity During Q1:2021-22, currency expansion, build-up of GoI cash balances and the restoration of the cash reserve ratio (CRR) to its pre-pandemic level were the main sources of liquidity leakage while its accretion was through G-SAP and forex purchases (Table IV.7). Surplus liquidity – as reflected in average daily net absorptions under the LAF – amounted to ₹5.1 lakh crore. | Table IV.7: Liquidity – Key Drivers and Management | | (₹ crore) | | | 2020-21 | Q1: 2021-22* | Q2: 2021-22* | H1: 2021-22* | | Drivers | | | | | | (i) CiC | -4,06,452 | -1,26,266 | 55,005 | -71,261 | | (ii) Net forex purchases | 5,10,516 | 1,60,843 | 1,42,395 | 3,03,238 | | (iii) GoI cash balances | 1,18,999 | -2,23,740 | -5,600 | -2,29,340 | | Management | | | | | | (i) Net OMO purchases | 3,13,295 | 1,38,965 | 97,960 | 2,36,925 | | (ii) CRR balances | -1,46,617 | 29,392 | -16,470 | 12,922 | | (iii) Net LAF operations | -152,302 | -60,759 | -2,86,162 | -3,46,921 | | Memo; | | | | | | 1. Average daily injection (LTRO, TLTRO, On tap TLTRO, SLTRO and MSF) | 1,58,491 | 82,948 | 84,488 | 83,722 | | 2. Average daily total absorption (i+ii) | 6,54,645 | 5,93,181 | 8,10,096 | 7,02,231 | | (i) Fixed rate reverse repo | 6,13,700 | 4,10,747 | 5,23,626 | 4,67,495 | | (ii) Variable rate reverse repo (VRRR) | 40,945 | 1,82,434 | 2,86,470 | 2,34,736 | | 3. Average daily net absorption during the period (2-1) | 4,96,154 | 5,10,233 | 7,25,609 | 6,18,509 | | 4. Outstanding total injection at the end of the period | 82,963 | 83,307 | 85,509 | 85,509 | | 5. Outstanding total absorption at the end of the period | 4,93,904 | 6,85,828 | 9,14,463 | 9,14,463 | | 6. Outstanding net absorption at the end of the period | 4,11,211 | 6,02,521 | 8,28,954 | 8,28,954 | *: Data on drivers and management are based on the last Friday of the respective periods.
Note: Inflow (+)to/outflow (-) from the banking system.
Source: RBI | Lower liquidity leakage due to subdued currency expansion added to the persistence of large surplus liquidity in H1:2021-22 (Chart IV.33). Despite the second wave of the pandemic being more virulent, the precautionary demand for cash remained muted. In Q2, the usual return of currency during the monsoon season, renewed vigour of capital inflows along with liquidity injections through G-SAP 2.0 augmented surplus liquidity. As a result, average daily net liquidity absorptions in Q2 soared to ₹7.3 lakh crore. Unabated capital inflows reflected on the forward premium curve in the forex market – its shape being determined by the interplay of institutional features and regulatory aspects with the market microstructure and flow factors, apart from macroeconomic fundamentals (Box IV.2). 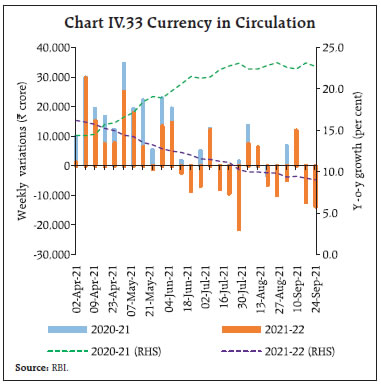
Box IV.2: Determinants of Forward Premia – A Macro-Finance Approach According to the covered interest rate parity (CIP) condition, the forward premium reflects the interest rate differential between two currencies of comparable maturity and risk profile. Capital controls and varying risk perceptions of investors can, however, lead to a wedge in this relationship. Qualitative attributes (such as market sentiments, expectations, political stability and financial news) and quantitative factors (like crude oil prices, central bank’s forex intervention and foreign exchange market turnover) also impact forward premia (Srikanth and Chittedi, 2014). While interest rate differentials explain the forward premia in the long-run in line with CIP, the volatility in the spot rate influences it in the short-run (Biswas et al, 2018). Drawing upon the macro-finance literature on modelling the shape of the yield curve through principal component analysis (Diebold et al, 2006), the forward premium curve can be decomposed into its latent factors – level, slope and curvature. An analysis based on monthly data (January 2015 to June 2021) for tenors spanning 1-12 months indicates that the first three principal components (PCs) explain more than 99 per cent of the variation in the data. The three PCs characterise the level, the slope and the curvature, respectively, of the forward premium curve.10 The determinants of forward premia for three tenors viz., 1-month, 3-months and 12-months are separately short-listed using a machine learning approach (random forest11 methodology) (Dilip et al, 2021). These variables are: (i) the differential between yields on 3-month T-bills for US and India (Int_Diff); (ii) domestic system liquidity as proportion to GDP (Net_LAF); (iii) global economic policy uncertainty index (GEPU); (iv) RBI’s forward intervention (net forward purchases) as proportion of forex reserves (Forward_Intervention); (v) CPI inflation volatility (Vol_Inf); (vi) 3-month realised volatility of NIFTY 50 (Vol_NIFTY50); and (vii) trade deficit as proportion to GDP [Trade_deficit]. The generalized method of moments (GMM) approach – more specifically, the continuously updating GMM estimation (CUE) methodology using appropriate instrument variables12 – is deployed to address endogeneity concerns, after conducting due diligence for the time series properties of the variables. The empirical results suggest positive and statistically significant impact of interest rate differentials and global uncertainty on the level of the forward premium curve (Table IV.2.1). Stock market turbulence (captured by NIFTY volatility) is associated with a marginal hardening of the level of the forward premia along with a steepening of the curve as traders seek to hedge their positions. The rise in the volatility in domestic inflation seems to increase risk aversion among market participants at shorter and longer tenors, thus moderating the extent of the hump in the forward premia curve. The increased availability of domestic liquidity moderates the level and shape of the forward premia curve. Finally, forward interventions by the RBI seems to flatten the slope and reduce the curvature while increasing the level of the premia. The analysis suggests that forward interventions generally discourage carry trade activities by reducing the steepness of the forward premia curve. In a situation of large surplus liquidity, a steeper curve can trigger a vicious cycle of higher inflows and even further increase in the forward premia. | Table IV.2.1: Determinants of the Forward Premia Curve | | Explanatory Variables/Dependent Variable | ∆Level | Slope | Curvature | | Lag of Dependent Variable | -0.40*(-1.97) | 0.38***(4.57) | 0.23***(3.16) | | ∆Int_Diff | 0.64***(3.65) | 0.20**(2.66) | - | | ∆Net_LAF | -0.56***(-3.90) | -0.15*(-1.73) | -0.04***(-3.04) | | ∆GEPU(-1) | 0.003**(2.15) | - | - | | ∆Forward_Intervention | 0.16*(1.77) | -0.09**(-2.80) | -0.03*(-1.69) | | Vol_NIFTY50 | 0.02***(3.81) | 0.01**(2.85) | - | | Vol_Inf | - | - | -0.05*(-1.99) | | Trade_deficit(-1) | | - | 0.03**(2.37) | | Constant | -0.32***(-2.90) | -0.23***(-4.23) | 0.15***(3.38) | | Adj R-squared | 0.21 | 0.32 | 0.30 | | Diagnostics | | | | | J-Statistic (p-value) (Over-identification test) | 0.55 | 0.95 | 0.44 | | Q-statistic (p-value) (Serial correlation test for 4 lags) | 0.36 | 0.12 | 0.28 | Note: ***, **, and * indicate 1 per cent, 5 per cent and 10 per cent levels of significance, respectively.
Figures in parenthesis are t-statistics based on heteroscedasticity and autocorrelation consistent (HAC) corrected standard errors. | References Biwas, D., S. Kumar, S., and A. Prakash (2018), “Do Spot Rate Volatility and Forward Market Intervention by the Central Bank Impact the Forward Premia in India?”, Asian Journal of Economics, Finance and Management, 1(1), pp 1-12. Diebold, F., G. Rudebusch, G., and S. B. Aruoba (2006), “The Macroeconomy and the Yield Curve: A Dynamic Latent Factor Approach”, Journal of Econometrics, 131(1-2), pp 309-338. Dilip, A., P. Kumar, P. Sachdeva, K.M. Kushawaha and I. Bhattacharyya (2021), “Recent Movements in Forward Premia – An Analytical Perspective”, RBI mimeo. Litterman R. B., and J. Scheinkman, (1991) “Common Factors Affecting Bond Returns”, The Journal of Fixed Income, Summer, 1(1) 54-61. Srikanth, M. and K. R. Chittedi (2014), “Perspectives on Forward Premia in India Forex Market: A Study of USD/INR”, Journal of Stock & Forex Trading, 3(4).
|
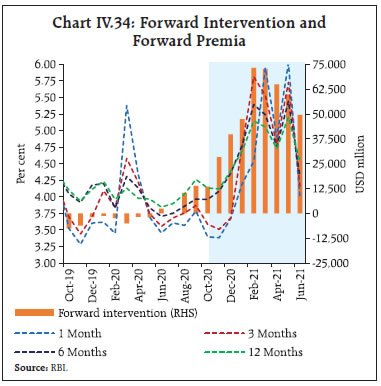 With the moderation of the forward book in H1:2021-22 (up to July), the pressure on the forward premia somewhat eased (Chart IV.34). The gradual normalisation of liquidity management operations in sync with the revised liquidity management framework instituted in February 2020 was a key feature of liquidity management during H1:2021-22. As a part of this process, the CRR was restored to its pre-pandemic level of 4.0 per cent of NDTL in two phases of 0.5 percentage point increase in the fortnights beginning March 27, 2021 and May 22, 2021. The surplus liquidity was mopped up through the overnight fixed rate reverse repo and the VRRR auctions of varying maturities under the LAF. Keeping in view the markets’ feedback and appetite for higher remuneration, the Reserve Bank enhanced the size of the fortnightly VRRR auctions in a phased manner from ₹2.0 lakh crore during April-July to ₹2.5 lakh crore on August 13, 2021; ₹3.0 lakh crore on August 27, 2021; ₹3.5 lakh crore on September 9, 2021; and ₹4.0 lakh crore on September 24, 2021. These were supported by fine-tuning operations conducted through VRRRs of 3, 4 and 7 days maturities. Notwithstanding the phased increase in the size of VRRRs, the surplus liquidity absorbed through fixed rate reverse repo remained around ₹4.7 lakh crore (on an average) in H1 (Chart IV.35). 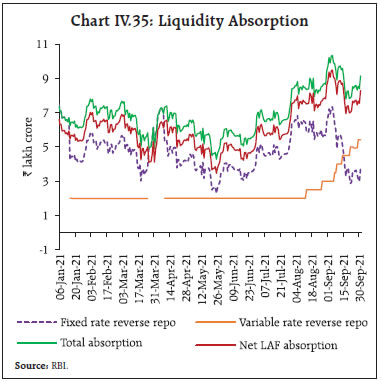 The enhancement in VRRR size was initially interpreted as a precursor to reversal of liquidity measures leading to a transient spike in G-sec yield on the policy day, i.e., August 7, 2021 (Chart IV.36a). Such fears, however, were unfounded as evident from the relative stability in the bid-cover ratios of 14-day VRRR auctions in the immediate fortnights after the policy announcement vis-à-vis before (Chart IV.36b). Reflecting the liquidity injections through G-SAP and capital inflows, reserve money (RM) increased by 14.7 per cent (y-o-y) as on September 24, 2021 (9.1 per cent adjusted for the first-round impact of the change in the CRR) while money supply (M3) increased by 9.3 per cent (y-o-y) as on September 24 (Table IV.8). 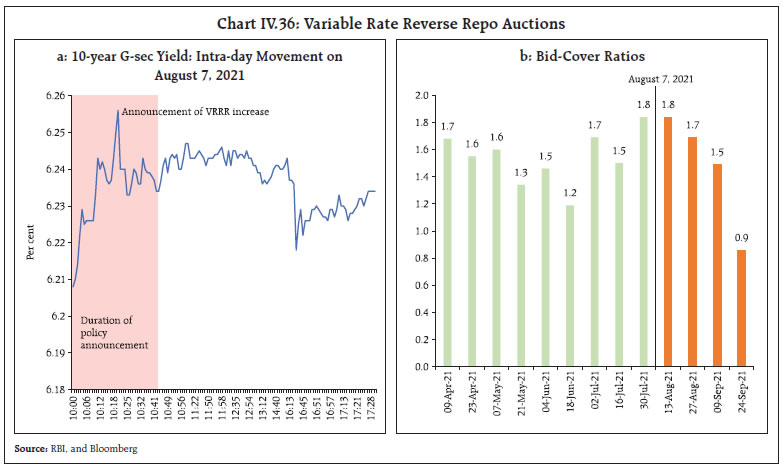
| Table IV.8: Key Banking and Monetary Aggregates in H1:2021-22 | | Indicator | Variation (in ₹ Crore) | | Financial Year | Y-o-Y | | 2020-21 | 2021-22 | 2020-21 | 2021-22 | | Reserve money | 1,59,682
(5.3) | 59,318
(1.6) | 4,01,195
(14.4)
[18.6]* | 4,69,910
(14.7)
[9.1]* | | Currency in circulation | 2,35,646
(9.6) | 71,261
(2.5) | 4,96,810
(22.7) | 2,42,067
(9.0) | | Broad money (M3) | 9,39,801
(5.6) | 5,47,546
(2.9) | 19,25,597
(12.2) | 16,52,360
(9.3) | | Aggregate deposits | 6,94,911
(5.1) | 4,81,525
(3.2) | 13,55,943
(10.5) | 13,32,634
(9.3) | | Demand deposits | -40,943
(-2.5) | -38,221
(-2.1) | 1,67,175
(11.9) | 2,46,911
(15.7) | | Time deposits | 7,35,854
(6.2) | 5,19,746
(3.9) | 11,88,768
(10.3) | 10,85,722
(8.6) | | Bank credit | -99,280
(-1.0) | 7,283
(0.1) | 5,04,727
(5.2) | 6,85,211
(6.7) | *: Growth rates adjusted for the first-round impact of the change in CRR.
Note: 1. Figures in parentheses indicate percentage change.
2. Data on deposits and bank credit pertains to scheduled commercial banks (SCBs). | Other Liquidity Measures Apart from G-SAP, the RBI continued with measures to meet targeted sectoral credit needs to nurture the nascent economic recovery in H1. These measures included (i) special refinance facilities of ₹66,000 crore to all-India financial institutions (AIFIs) comprising ₹25,000 crore to the National Bank for Agriculture and Rural Development (NABARD); ₹10,000 crore to the National Housing Bank (NHB); and ₹31,000 crore to the Small Industries Development Bank of India (SIDBI) to support and nurture the recovery; (ii) term liquidity facility of ₹50,000 crore to ramp up COVID-related healthcare infrastructure and services in the country; (iii) special long-term repo operations (SLTRO) for small finance banks (SFBs) of ₹10,000 crore to be deployed for fresh lending of up to ₹10 lakh per borrower; (iv) on-tap liquidity window of ₹15,000 crore in order to mitigate the adverse impact of the second wave of the pandemic on certain contact-intensive sectors13. Overall, the Reserve Bank has announced liquidity enhancing measures worth ₹17.2 lakh crore (8.7 per cent of nominal GDP of 2020-21) since February 6, 2020 (Table IV.9). Table IV.9: Liquidity Measures since February 6, 2020
(As on September 30, 2021) | | Measure | Announced Amount (₹ crore) | | 2019-20 | 2020-21 | 2021-22 | Overall | | (1) | (2) | (3) | (4 =1+2+3) | | LTRO | 2,00,000 | | | 2,00,000 | | Variable rate repo | 1,75,000 | 50,000 | | 2,25,000 | | SLF for PDs | 7,200 | | | 7,200 | | CRR cut | 1,37,000 | | | 1,37,000 | | MSF (dip by additional 1% in SLR) | 1,37,000 | | | 1,37,000 | | TLTRO | 25,000 | 75,000 | | 1,00,000 | | TLTRO (2.0) | | 50,000 | | 50,000 | | Net OMO purchases including G-SAP | 40,000 | 1,10,000 | 2,20,000 | 3,70,000 | | Special liquidity facility for mutual funds | | 50,000 | | 50,000 | | Refinance to NABARD, SIDBI, NHB and EXIM Bank | | 75,000 | 66,000 | 1,41,000 | | Special liquidity scheme for NBFCs | | 30,000 | | 30,000 | | 56-day term repo | | 1,00,000 | | 1,00,000 | | On Tap TLTRO | | 1,00,000 | | 1,00,000 | | SLTRO for small finance banks | | | 10,000 | 10,000 | | Term liquidity facility to ease access to emergency health services | | | 50,000 | 50,000 | | On-tap liquidity window for contact-intensive sectors | | | 15,000 | 15,000 | | Total | 7,21,200 | 6,40,000 | 3,61,000 | 17,22,200 | | As per cent of nominal GDP for 2020-21 | | | | 8.7 | | Source: RBI | IV.4 Conclusion Domestic financial markets broadly remained stable and in sync with the accommodative policy stance of the MPC and the Reserve Bank’s continued calibrated liquidity injection measures. Market activity was vibrant, with short-term rates easing appreciably along with thinning of spreads. The renewed vigour of capital inflows and the infusion of discretionary liquidity through G-SAP resulted in a substantial increase in surplus systemic liquidity, which was modulated through increases in VRRR amounts and fine-tuning operations. Monetary transmission improved further amidst nascent signs of an upturn in credit growth. Going forward, liquidity conditions are expected to continue to be accommodative in consonance with the monetary policy stance, through calibrated liquidity management operations. Imparting momentum to the nascent economic recovery process and putting it on a sustained and durable basis through efficient policy transmission would continue to assume primacy in the hierarchy of policy objectives. __________________________________________________________________________________
V. External Environment The global economic activity gained traction in Q2:2021 (April-June). In Q3, however, the momentum of the global recovery seems to have weakened across the board as the rapid spread of more virulent strains of the virus weighed on business conditions. Elevated commodity prices and overstretched supply chains are keeping input price pressures high, posing upside risks to headline inflation. The divergence in monetary policy actions and stances is amplifying the unequal and uneven nature of the global recovery and increasing the downside risks to the outlook, while global financial markets are turning volatile. In the aftermath of the April 2021 MPR, daily new infections appeared to have peaked in major advanced economies (AEs) and a few emerging market economies (EMEs), allowing easing of restrictions and global economic activity to gain traction in Q2:2021 at a diverging and unequal pace on the basis of scale and speed of vaccination. Starting June, however, the momentum of the global recovery seems to have weakened across the board as the rapid spread of more virulent strains of the virus weighed on business conditions in most major economies, pulling down global purchasing managers’ index (PMI) readings and is likely to reflect in lower GDP growth in Q3. Besides, still rising commodity prices and overstretched supply chains are keeping input price pressures high, posing upside risks to headline inflation. Several EME central banks and a few in the AEs have responded with policy rate hikes and unwinding of policy stimulus. The divergence in monetary policy actions and stances is amplifying the unequal and uneven nature of the global recovery and increasing the downside risks to the outlook. Global financial markets remained buoyant up to early-September before increasingly turning volatile. Even as stock markets in a few countries scaled fresh peaks in September 2021, most saw sharp correction. In the bond markets, yields remained range-bound up to August in most AEs but rose sharply in September. In EMEs, bond yields moved bi-directionally but rose in the latter part of September, in sync with the AEs. The US dollar has strengthened in anticipation of taper and higher inflation outcomes in the US. V.1 Global Economic Conditions Economic activity accelerated in major AEs and EMEs in Q2:2021, but faltered in Q3, with most economies yet to return to their pre-pandemic levels. In the US, the economic rebound that commenced in H2:2020 continued into H1:2021, with GDP bouncing back to its pre-pandemic level in Q2:2021 (Table V.1). Sustained policy support, easing of restrictions and vaccination supported a strong pick-up in consumer spending. Non-farm payroll showed signs of steady improvement during May-July indicating the mending of labour market conditions; however, it softened in August to a seven-month low amidst rising infections. Employment remains below the pre-pandemic level and the Federal Reserve (Fed)’s goal of maximum employment, beset with hiring difficulties and labour supply shortages. Incoming data for Q3 also suggest that the momentum of growth may have moderated – consumer sentiment plummeted in August to its lowest level in nearly a decade due to surging delta variant infections and inflation concerns, before rising marginally in September. The manufacturing PMI eased in July due to persistent supply side frictions but improved in the next two months even as the rising infections caseload weighed on the outlook. After slipping into a double dip recession in Q1:2021, the Euro area rebounded sharply in Q2, growing at 9.2 per cent [q-o-q, seasonally adjusted annualised rate (SAAR)], as most major constituent economies returned to growth following gradual withdrawal of restrictions. Significant progress on vaccination, together with falling rates of incidence, boosted consumer and business sentiments, and brightened the prospects for domestic demand and employment. In Q3, however, the economy seems to have lost some steam, as evident from high frequency indicators. The composite PMI, though in strong expansion, moderated in August and September from its 15-year high in July, as capacity constraints dragged on the manufacturing PMI, while services PMI fell to a four-month low in September. | Table V.1: Real GDP Growth | | (Per cent) | | Country | Q2-2020 | Q3-2020 | Q4-2020 | Q1-2021 | Q2-2021 | 2020 | 2021 (P) | 2022 (P) | | Quarter-over-quarter, seasonally adjusted, annualised rate (Q-o-q, SAAR) | | Canada | -38.0 | 41.7 | 9.3 | 5.5 | -1.1 | - | - | - | | Euro area | -39.1 | 60.9 | -1.7 | -1.1 | 9.2 | - | - | - | | Japan | -28.1 | 23.2 | 11.9 | -4.2 | 1.9 | - | - | - | | UK | -58.1 | 90.2 | 4.5 | -5.3 | 23.9 | - | - | - | | US | -31.2 | 33.8 | 4.5 | 6.3 | 6.7 | - | - | - | | Year-on-year (Y-o-y) | | Advanced Economies | | Canada | -12.6 | -5.1 | -3.1 | 0.3 | 12.7 | -5.3 | 6.3 | 4.5 | | Euro area | -14.5 | -4.0 | -4.4 | -1.2 | 14.3 | -6.5 | 4.6 | 4.3 | | Japan | -10.1 | -5.5 | -0.9 | -1.3 | 7.6 | -4.7 | 2.8 | 3.0 | | UK | -21.4 | -8.1 | -7.1 | -5.8 | 23.6 | -9.8 | 7.0 | 4.8 | | US | -9.1 | -2.9 | -2.3 | 0.5 | 12.2 | -3.5 | 7.0 | 4.9 | | Emerging Market Economies | | Brazil | -10.9 | -3.9 | -1.1 | 1.0 | 12.4 | -4.1 | 5.3 | 1.9 | | China | 3.2 | 4.9 | 6.5 | 18.3 | 7.9 | 2.3 | 8.1 | 5.7 | | India | -24.4 | -7.4 | 0.5 | 1.6 | 20.1 | -7.3 | 9.5 | 8.5 | | Indonesia | -5.3 | -3.5 | -2.2 | -0.7 | 7.1 | -2.1 | 3.9 | 5.9 | | Philippines | -17.0 | -11.6 | -8.3 | -3.9 | 11.8 | -9.6 | 5.4 | 7.0 | | Russia | -7.8 | -3.5 | -1.8 | -0.7 | 10.5 | -3.0 | 4.4 | 3.1 | | South Africa | -16.8 | -5.8 | -3.5 | -2.6 | 19.3 | -7.0 | 4.0 | 2.2 | | Thailand | -12.1 | -6.4 | -4.2 | -2.6 | 7.5 | -6.1 | 2.1 | 6.1 | | Memo: | 2020 | 2021 (P) | 2022 (P) | | World Output | -3.2 | 6.0 | 4.9 | | World Trade Volume | -8.3 | 9.7 | 7.0 | P: Projection.
Note: India's data correspond to fiscal year (April-March).
Sources: Official statistical agencies; Bloomberg; IMF WEO Update, July 2021; and RBI staff estimates. | The Japanese economy picked up in Q2 at a pace higher than expected, but much weaker than other major AE peers. Resilient external demand underpinned a recovery in exports and capital expenditure. In Q3, however, the country is less likely to maintain this momentum as the upsurge in cases of more virulent strains pushed the economy into its fourth state of emergency in early July which was extended till September. The fallout from the renewed wave is already getting reflected in incoming data as industrial growth turned weaker in July and August and the manufacturing PMI, though in expansion zone, moderated in Q3. The composite PMI remained in contraction zone up to September, reflecting a sharp deterioration in business activity in the services sector. In the UK, GDP grew sharply in Q2:2021 – as against a contraction in Q1 – as the gradual rollback of COVID-related restrictions together with rapid vaccine rollouts aided a strong rebound in household consumption and public spending. With increasing caseload intensifying the risk of another round of lockdown restrictions, the pace of recovery slowed in Q3. The composite PMI eased for the fourth consecutive month in September as output growth in both manufacturing and services weakened amidst stringent supply constraints. The Chinese economy expanded by 7.9 per cent (y-o-y) in Q2. Successful containment of several sporadic virus outbreaks together with sustained policy measures kept exports and manufacturing activity well supported, thus powering a steady recovery. Domestic consumption, however, remains a weak spot and the economy exhibited signs of slowing down in Q3. Both manufacturing and services PMI slipped back into contraction in August for the first time since April 2020 following the deterioration in business conditions. In September, manufacturing PMI had the neutral reading of 50, i.e., neither expansion nor contraction. The deterioration in real estate, rising input costs, regulatory crackdown on corporates in recent months and growing power outages are the major headwinds. An examination of key macroeconomic indicators of BRICS economies reveals that the macroeconomic performance of India is likely to remain resilient in 2021 when compared with most other counterparts (Table V.2). The Brazilian economy contracted marginally on q-o-q basis in Q2:2021, reversing three successive quarters of sequential expansion since Q3:2020. Contraction in both industry and agricultural sectors on account of the resurgence of COVID-19 infections, weighed on economic activity. On the demand side, a sharp decline in gross fixed capital investment, together with muted household consumption, led to the downturn. In Q3, indicators are pointing to mobility gains, with paced up vaccination having boosted sentiments. Manufacturing PMI moderated in August but picked up in September, with production rising for the fifth successive month owing to a robust expansion in sales. The Russian economy remained resilient with GDP having reached its pre-pandemic level in Q2:2021. A sustained recovery in consumer spending and investment demand supported the uptrend, while elevated commodity prices and the gradual recovery of oil output lent further support. Some slowing of momentum is evident in Q3 as a third wave of infections since end-June impacted both domestic and foreign demand conditions leading to a decline in production and slowdown in new order growth. The manufacturing PMI is back into the contraction zone since June, while the composite PMI recorded its first contraction since December 2020 in August but was back in expansion zone in September. | Table V.2: Select Macroeconomic Indicators for BRICS | | Real GDP growth rate (per cent) | Country | 2020 | 2021(P) | 2022(P) | General Govt. gross debt (as per cent of GDP) | Country | 2020 | 2021(P) | 2022(P) | | Brazil | -4.1 | 5.3 | 1.9 | Brazil# | 98.9 | 91.8 | 98.8 | | Russia | -3.0 | 4.4 | 3.1 | Russia | 19.3 | 18.0 | 17.7 | | India | -7.3 | 9.5 | 8.5 | India | 89.4 | 90.1 | 86.3 | | China | 2.3 | 8.1 | 5.7 | China | 66.3 | 70.3 | 73.7 | | South Africa | -7.0 | 4.0 | 2.2 | South Africa | 77.1 | 77.5 | 84.4 | | CPI inflation rate (per cent) | Country | 2020 | 2021(P) | 2022(P) | Current account balance (as per cent of GDP) | Country | 2020 (P) | 2021(P) | 2022(P) | | Brazil | 3.2 | 4.6 | 4.0 | Brazil | -0.9 | -0.6 | -0.8 | | Russia | 3.4 | 4.5 | 3.4 | Russia | 2.2 | 3.9 | 3.3 | | India | 6.1 @ | 4.9 | 4.1 | India | 1.0 | -1.2 | -1.6 | | China | 2.4 | 1.2 | 1.9 | China | 2.0 | 1.6 | 1.3 | | South Africa | 3.3 | 4.3 | 4.5 | South Africa | 2.2 | -0.4 | -1.5 | | General Govt. net lending/borrowing (as per cent of GDP) | Country | 2020 (P) | 2021(P) | 2022(P) | Forex reserves* (in US$ billion) | Country | 2020 | 2021 | | | Brazil | -13.4 | -8.3 | -7.2 | Brazil | 355.6 | 370.4 | | | Russia | -4.1 | -0.8 | -0.3 | Russia | 596.1 | 618.2 | | India | -12.3 | -10.0 | -9.1 | India | 588.4 | 633.6 | | China | -11.4 | -9.6 | -8.7 | China | 3536.0 | 3588.1 | | South Africa | -12.2 | -10.6 | -8.3 | South Africa | 54.2 | 58.3 | P: Projection.
*: Forex reserves for 2021 pertain to August 2021.
#: Gross debt refers to the nonfinancial public sector, excluding Eletrobras and Petrobras, and includes sovereign debt held by the central bank.
@: Average of the period from June 2020 to March 2021.
Note: India's data correspond to fiscal year (April-March).
Sources: Bloomberg; Official statistical agencies; WEO April 2021 database and July 2021 Update; and IRFCL, IMF. | The South African economy has exhibited gradual recovery with four consecutive quarters of q-o-q expansion up to Q2:2021. The recovery was underpinned by strong growth in transport and communication, personal services and the agricultural sector, while household spending and exports lent support. In Q3, however, the pace of growth is likely to have decelerated as social unrest, mounting infections, slow vaccine rollouts and power outages weakened business conditions as also domestic demand. Among the South-East Asian economies, recovery remains slow-paced with renewed waves of contagious strains of COVID-19 amidst lagged inoculation rates. Stringent containment measures have resulted in deterioration of business conditions, pushing manufacturing PMI for all major ASEAN economies into contraction territory in August, for the first time since May 2020. The PMI manufacturing for the ASEAN region was at the neutral level of 50 in September. The OECD composite leading indicators (CLIs) available up to August 2021 suggest moderate improvement just above trend level across most major AEs, while for major EMEs it reflects diverging developments (Chart V.1a). The global composite PMI has moderated within the expansion zone, hitting a 7-month low in August, before rising marginally in September with PMI manufacturing remaining flat (Chart V.1b). Global trade showed signs of revival during Q4:2020 and recovered swiftly during H1:2021 across AEs and EMEs (Chart V.2a). Following the recent resurgence in global trade, the WTO has revised its growth forecast of merchandise trade volume to 10.8 per cent for 2021. However, persisting worldwide shortages in semiconductors and port congestion may moderate global trade recovery in certain sectors (Box V.1). The Baltic Dry Index, which measures shipping costs for a wide variety of bulk commodities such as coal, iron ore and grain, rose to a new high by end-September (Chart V.2b). 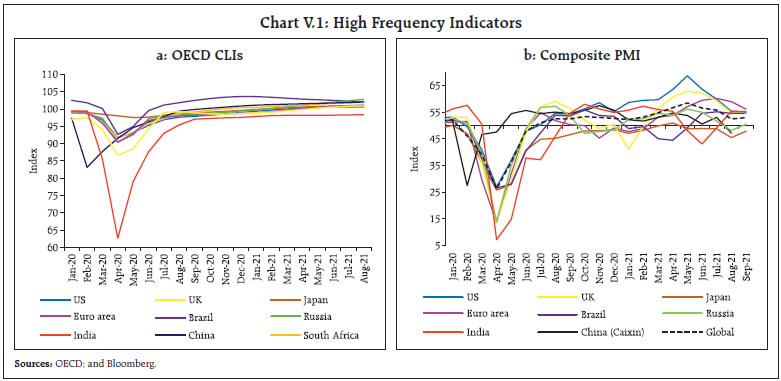
Box V.1: Global Semiconductor Shortage: Opportunities and Challenges The world is currently facing an acute shortage of semiconductors, which is the fourth most traded item globally after crude oil, refined oil and cars (BCG-SIA Report, 2021). The global semiconductor market is valued at US$440 billion accounting for around 5 per cent of global goods trade and is expected to grow by 25.1 per cent (US$551 billion) in 2021, driven by key segments such as mobile phones, information and communications technology (ICT) infrastructure, personal computers, industrial applications, consumer electronics and automobiles (Chart V.1.1a). The buoyant demand for electronic gadgets, cloud computing solutions and auto industry following COVID-19 pandemic led to a huge supply-demand mismatch in the semiconductor industry, causing production delays and inflationary pressures across segments forcing companies to reinvent their supply chains. Alix Partners (2021) estimates that the ongoing semiconductor shortage may lead to revenue loss of around US$210 billion in 2021 in the automotive sector. According to Gartner (2021), normalcy is expected to return to semiconductor industry by the second quarter of 2022. Realising critical geo-political concerns associated with semiconductor industry, countries are offering huge incentives to scale up their domestic semiconductor manufacturing capacity (Chart V.1.1b). Furthermore, leading semiconductor manufacturers like TSMC and Intel have also planned huge capital expenditure to the tune of US$100 billion and US$43.5 billion, respectively, to tap the elevated demand. The recent investment boom to meet shortages may lead to overcapacity in the long run. The semiconductor industry is at the core of India’s digital transformation into a US$1 trillion digital economy by 2025. The size of the world market for 111 frontier technologies is expected to increase to US$3.2 trillion by 2025 (UNCTAD, 2021) and drive the demand for semiconductors in future. Moreover, the share of software-related automotive electronics in car industry is estimated to increase from 27 per cent in 2010 to 45 per cent by 2030 (Deloitte, 2019). The semiconductor industry is highly capital-intensive with a long gestation period. Annual energy requirements to run large fabrication facilities are estimated at around 169 MWh, sufficient to power an Indian city (Kumar, 2021). Moreover, it requires on average 2-4 million gallons of ultra-pure water daily (Baskaran, 2017). Furthermore, wastage disposal associated with semiconductor industry is also capital intensive and raises environmental concerns. The semiconductor industry is also highly cyclical in nature and determined by two variables, namely semiconductor inventory and fabrication plant capacity (Liu W. H., 2005). Using a Markov regime-switching model, the expected duration of an expansionary cycle (8 months) is obtained as twice that of a contractionary phase (4 months) (Liu and Chyi, 2006). We extend that line of analysis to the period September 2003 to June 2021 with the following empirical specification:
where WMBt is defined as the growth rate of worldwide semiconductor sales. The equations (1) - (5) represent the model set up as an AR (4) process where St = 1 stands for expansion of the semiconductor industry and St = 2 stands for contraction of the semiconductor industry. The transition probability from expansion to expansion(i.e., from St-1 = 1 to St = 1) is defined as p. On the other hand, the transition probability from contraction to contraction (St-1 = 2 to St = 2) is defined as q. The empirical results suggest that the expected duration of expansion and contraction in the semiconductor industry is around 16 months and 4 months, respectively. The higher expansionary period reflects the increasing demand for semiconductors across industries post COVID-19 (Charts V.1.2a and V.1.2b). 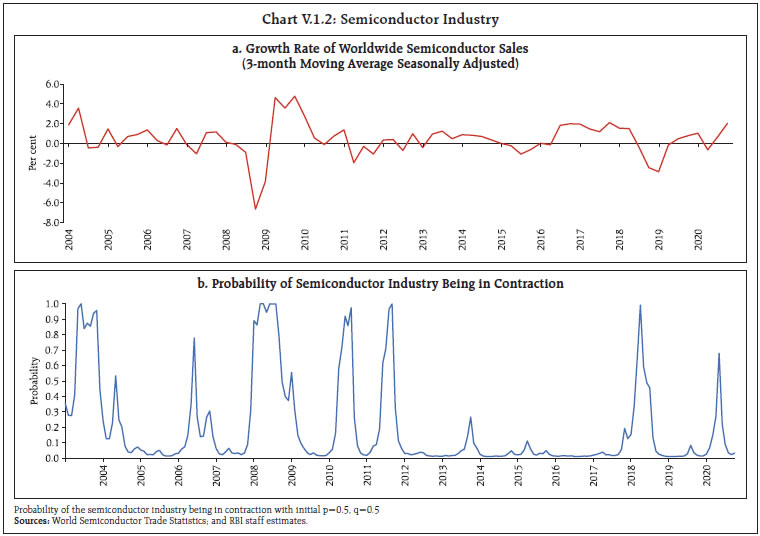 Given the renewed focus on digitalisation and increasing domestic demand for electronic goods with large import dependency, the government has initiated the Production Linked Incentive (PLI) scheme and Scheme for Promotion of Manufacturing of Electronic Components and Semiconductors (SPECS) to encourage its domestic production. Incentives in line with those provided by major countries would help develop semiconductor fabrication facilities in India. Fiscal incentives and provision of adequate infrastructure like uninterrupted supply of electricity and ultra-pure water could contribute to India’s emergence as a major player in this industry and provide a conducive environment for the hardware segment to complement the software industry. Select References Kumar, M. J. (2021). Is India going to be a major hub of semiconductor chip manufacturing? IETE Technical Reviews, 279-281. Liu, W. H. (2005). Determinants of the semiconductor industry cycles. Journal of Policy Modelling, 27 (2005), 853-866. Liu, W.H., & Chyi, Y.L. (2006). A Markov regime-switching model for the semiconductor industry cycles. Economic Modelling, 23 (2006), 569-578. UNCTAD. (2021). Technology and Innovation Report. | V.2 Commodity Prices and Inflation Global commodity prices have soared in 2021 so far, with intermittent corrections – the Bloomberg commodity price index increased by 20.7 per cent during April-September 2021. The food price index of the Food and Agriculture Organization (FAO) increased by 7.0 per cent between March and August 2021 (Chart V.3a). Prices of vegetable oil, cereal and dairy sub-indices have eased more recently because of seasonal production gains and softening import demand. In contrast, sugar and meat prices have continued to increase due to tightening supplies from major exporters amidst rising import demand. Crude oil prices rallied unevenly since April on improved demand prospects. Brent crude crossed US$70 per barrel in June, reaching its then highest level of 2021 in early July. From the second week of July, however, crude oil prices turned volatile – downward bias was imparted by rapid spread of the contagious delta variant, OPEC plus agreement to ease supply with an additional output of 400,000 barrels per day each month from August and rising stockpiles in the US. Price have firmed up since the latter part of August on tightening US supplies owing to slow recovery from disruption caused by Hurricane Ida and lower stockpiles in China. Brent crude prices ruled at nearly three-year highs at end-September, surging by 54.0 per cent on year-to-date basis. 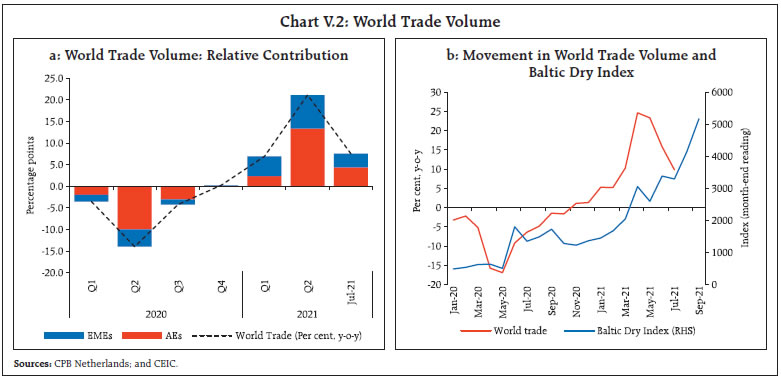
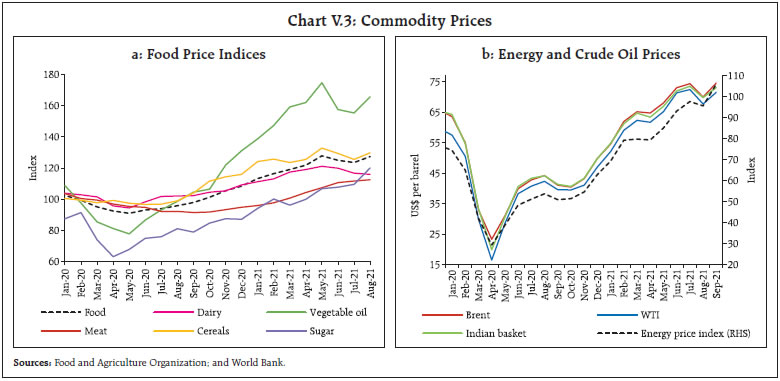 Base metal prices measured by the Bloomberg’s base metal spot index increased by 11.4 per cent during April-September 2021. The strong rally in prices witnessed in Q1:2021 continued into the first half of Q2 (Chart V.4). Most industrial metals, including copper and iron peaked in mid-May. The steady recovery in manufacturing activity across most major economies, along with rising supply bottlenecks, underpinned the metals bull run of H1:2021, sparking a debate on potential emergence of a fresh commodity super-cycle (Box V.2). Thereafter, prices for most metals have turned volatile in Q3, with iron giving up all early gains following China’s pro-climate measures. Gold prices rose in April and May on strong safe haven demand, but lost sheen in June on account of a strong US dollar. After remaining range-bound around the psychological level of US$1,800 per troy ounce during July to early September, prices plummeted in September with sharp rise in the US treasury yields and the US dollar. 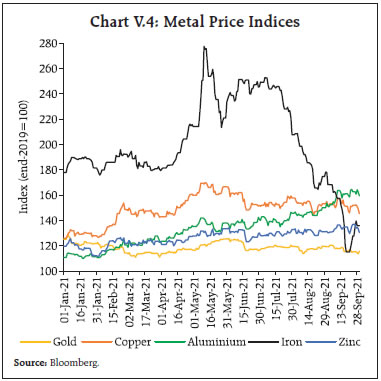
Box V.2: Global Commodity Prices: Is a Super Cycle Forming? Global commodity markets have picked up momentum in 2021, with a 69.4 per cent increase in the Bloomberg commodity price index from the low of March 2020 (Chart V.2.1a). Metal prices have remained the frontrunner in the recovery (Chart V.2.1b). Prices of iron and tin surged to historic peaks, while copper and aluminium recorded over a decadal high as recovering demand was further propelled by speculative trading. Super cycles are long-period cycles with periods of price upswings of roughly 10-35 years, and are generally perceived to be broad-based, affecting a wide range of commodities (Heap, 2005). They are rare but long-lasting. Such elongated cycles are attributed to structural shifts in the economy, characterised by prolonged period of strong demand outpacing supply. Three demand-driven super cycles have occurred since the late 19th century: during the US industrialisation which began in late 1800s through early 1900s; reconstruction in Europe and Japan in the aftermath of the second world war; and the most recent one driven by rapid industrialisation and urbanisation of China beginning in the early 2000s (Jerrett, 2021). Following Cuddington and Jerrett (2008), the statistical filtering technique of an asymmetric Christiano and Fitzgerald band-pass (BP) filter was deployed to decompose real metal prices (RP) into three components2: a long term trend (RP_LTT); a super cycle component (RP_SC); and other relatively shorter cyclical components (RP_STC) such that: In line with Heap’s (2005) analysis, a super cycle ranges from 20 to 70 years and, therefore, a BP (20,70) filter has been applied on each price series to obtain its super cycle component. The long run trend is defined as a cyclical component with periods above 70 years and is extracted using a BP (70,∞) filter3, while short-term cyclical components are defined as cycles with periods of 2 to 20 years and extracted by using BP (2,20) filter. The results corroborate the occurrence of three super cycles since the late 1800s (Chart V.2.2). Moreover, the super cycles in the six metals under consideration have strong contemporaneous correlation, except for aluminium-lead and aluminium-zinc (Table V.2.1). The super-cycle component of each of these metals, barring aluminium and nickel, peaked around 2014-2016 though they remain above their long-term trend.
| Table V.2.1: Correlations between Super-Cycle Components of Real Prices | | | Aluminium | Copper | Lead | Tin | Nickel | Zinc | | Aluminium | 1.00 | | | | | | | Copper | 0.32* | 1.00 | | | | | | Lead | -0.00 | 0.74* | 1.00 | | | | | Tin | 0.35* | 0.56* | 0.73* | 1.00 | | | | Nickel | 0.81* | 0.61* | 0.47* | 0.50* | 1.00 | | | Zinc | -0.07 | 0.67* | 0.71* | 0.60* | 0.26* | 1.00 | *: Statistically significant at 1 per cent level.
Source: RBI staff estimates. | This suggests that commodities might still be in the downswing phase of the super cycle that began in early 2000s. In contrast, the shorter cycle components for all metals are showing an upturn, likely reflecting supply-side factors such as escalating transport and logistics frictions and costs. Moreover, the recent reversal in prices of some metals weakens the narrative of a new super cycle. Hence, it is too early to classify the ongoing broad-based price escalation as a new commodity super cycle. References: Christiano, L. and T. Fitzgerald, 2003, ‘‘The Band Pass Filter,’’ International Economic Review, Vol. 44, No. 2, May, pp. 435-465. Cuddington, J.T. and D. Jerrett, 2008, “Super Cycles in Real Metals Prices?”, IMF Staff Papers, Vol. 55, No. 4, December, pp. 541-565. Heap, A., 2005, “China - the Engine of a Commodities Super Cycle,” Equities Research: Global, Citigroup Smith Barney, March 31. Jerrett, D., 2021, “How Super is the Commodity Cycle?”, Global Commodities Applied Research Digest, Summer 2021, http://www.jpmcc-gcard.com/digest-uploads/2021-summer/Page%2074_79%20GCARD%20Summer%20 2021%20Jerrett%20042021.pdf. | Prices firmed up across major AEs, pushing inflation above targets for most of them, barring Japan (Table V.3). For major EMEs, barring Indonesia and Thailand, headline inflation has remained close to the upper bound of the official target band or beyond, while for China, inflationary pressures have remained subdued in terms of consumer prices, notwithstanding strong upside pressures from producer prices. The return of inflation in the US has been stark. CPI inflation hit a 13-year high, reaching levels not seen since the global financial crisis. Fed’s preferred measure of inflation, the personal consumer expenditures (PCE) inflation, lagged CPI inflation but was at 30-year high level during July-August due to high energy and food prices. The surge in pent-up demand following the re-opening of economy, persistent supply-side constraints and high input costs are lending upside to inflation. The Fed attributes the spike in inflation to transitory factors. In the Euro area, the inflation rate moved beyond the European Central Bank (ECB)’s target of 2 per cent, surging to a 13-year high of 3.4 per cent in September on rising energy costs and prices of non-energy industrial goods and services, besides unfavourable base effect. The ECB too, attributes the recent rise in inflation to transitory factors and expects it to moderate back to the target once pandemic-induced shocks wane. CPI inflation in the UK edged up above the target in May-June and eased back to the 2 per cent target in July. In August, however, the inflation rate soared to 3.2 per cent, the highest ever jump in rate, mainly due to an unfavourable base effect. In Japan, unlike its AE counterparts, CPI remained in deflation for the eleventh consecutive month in August as COVID-19 continued to impact demand, keeping core inflation subdued, while a sharp drop in monthly mobile phone charges added to the downside (Chart V.5a). | Table V.3: Inflation | | (Per cent) | | Country | Inflation Target (current) | Q3:2020 | Q4:2020 | Q1:2021 | Q2:2021 | Q3:2021 | | Advanced Economies | | Canada | 2.0 | 0.2 | 0.8 | 1.4 | 3.4 | 3.9 | | Euro area | 2.0 | 0.0 | -0.3 | 1.0 | 1.8 | 2.9 | | Japan | 2.0 | 0.2 | -0.8 | -0.5 | -0.8 | -0.4 | | South Korea | 2.0 | 0.7 | 0.4 | 1.1 | 2.4 | 2.6 | | UK | 2.0 | 0.6 | 0.5 | 0.6 | 2.0 | 2.6 | | US | 2.0 | 1.2 | 1.2 | 1.8 | 3.9 | 4.2 | | Emerging Market Economies | | Brazil | 3.75 ± 1.5 | 2.6 | 4.3 | 5.3 | 7.7 | 9.3 | | Russia | 4.0 | 3.6 | 4.4 | 5.6 | 6.0 | 6.6 | | India | 4.0 ± 2.0 | 6.9 | 6.4 | 4.9 | 5.6 | 5.4 | | China | - | 2.3 | 0.1 | 0.0 | 1.1 | 0.9 | | South Africa | 3.0-6.0 | 3.1 | 3.2 | 3.1 | 4.8 | 4.8 | | Indonesia | 3.0 ± 1.0 | 1.4 | 1.6 | 1.4 | 1.5 | 1.6 | | Philippines | 3.0 ± 1.0 | 2.5 | 3.1 | 4.5 | 4.4 | 4.6 | | Thailand | 1.0-3.0 | -0.7 | -0.4 | -0.5 | 2.4 | 0.7 | | Turkey | 5.0 ± 2.0 | 11.8 | 13.5 | 15.6 | 17.1 | 19.3 | Notes: (1) Inflation for US is in terms of personal consumption expenditure price index.
(2) Quarterly inflation is the simple average of inflation in each month of the quarter. For Q3:2021, it is the July-August average for all countries except Euro area, South Korea, Indonesia, Phillipines, Thailand and Turkey, for which it is full quarter average.
(3) The ECB adopted new monetary policy strategy from July 8, 2021 under which a symmetric 2 per cent inflation would be targeted over the medium term unlike the earlier target of “below but close to 2 per cent’. The Bank of Canada aims to keep inflation at the 2 per cent mid-point of an inflation control target range of 1-3 per cent.
(4) Brazil’s inflation target for 2020 was 4.0 ± 1.5 per cent.
Sources: Central bank websites; and Bloomberg. | Among major EMEs, CPI inflation in Brazil has been above the upper bound of the tolerance band around the inflation target since February 2021. In August, CPI inflation rose to its highest reading since February 2016, primarily led by a surge in electricity and fuel prices amidst supply disruptions brought in by the worst drought witnessed by the country in almost a century. High global commodity prices, the depreciating Brazilian real and reviving demand are imparting upward pressure on prices. In Russia, inflation has been above the official target level since November 2020, scaling to a five-year high in August as rising inflation expectations, recovery in demand and strained supply capacity have kept inflationary pressures elevated. In South Africa, CPI inflation picked up from April due to increase in fuel costs, and high food and beverage prices. In June-July, however, inflation eased due to softening transport prices and favourable base effect before rising again in August on high fuel and food prices. China, on the other hand, remains an outlier with CPI inflation remaining highly subdued, primarily due to decline in food prices as also easing costs of transportation and communication amidst weak services sector demand (Chart V.5b). China’s producer price index, however, has risen sharply, pushing factory-gate inflation to its highest level in 13 years in August as high raw material costs and persistent disruptions due to global supply shortages exert upward pressure. 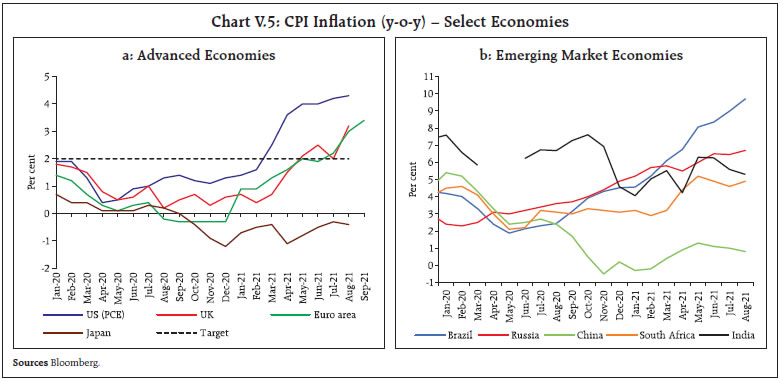 V.3 Monetary Policy Stance Extraordinary policy measures by monetary and fiscal authorities continue to support economies and ease financial conditions, helping to contain financial stability risks. The IMF estimates that since March 2020, US$16.5 trillion or about 15.9 per cent of global GDP had been pledged as fiscal support in response to the pandemic, with higher support extended by AEs vis-à-vis the EMEs (Table V.4). While most of the fiscal measures in the EMEs had expired in 2020, almost US$4.6 trillion worth of measures remain available to AEs as of early July 2021. The total monetary support extended globally by central banks is estimated to be about US$18.0trillion as of August 20214. This support has been predominantly in the form of asset purchases, around US$11.6 trillion, followed by lending operations of US$4.4 trillion. | Table V.4: Fiscal Support in Response to COVID-19 | | (Amount in US$ billion; Per cent as proportion of GDP) | | Country | Amount | Per cent | | Advanced Economies | - | 28.7 | | of which, | | | | Canada | 326 | 19.8 | | European Union | 1,361 | 10.5 | | Japan | 2,260 | 44.8 | | UK | 893 | 33.0 | | US | 5,838 | 27.9 | | Emerging Market Economies | - | 6.7 | | of which, | | | | Brazil | 221 | 15.4 | | Russia | 89 | 6.0 | | India | 232 | 8.7 | | China | 903 | 6.1 | | South Africa | 30 | 9.9 | | World | 16,500 | 15.9 | | Source: World Economic Outlook Update, July 2021, IMF. | Monetary policy stances have diverged across countries, with a few major AEs and EMEs continuing to maintain an accommodative stance while others have begun/continued with the withdrawal of monetary stimulus. The US Fed maintained the target range for the federal funds rate at 0 to 0.25 per cent and the monthly pace of asset purchases at US$120 billion in all its meetings held in Q2 and Q3. In June, the Fed effected a hike of 5 basis points (bps) in the interest rate paid on required and excess reserve balances to 0.15 per cent. The interest rate on overnight reverse repurchase agreement (ON RRP) operations was also increased by 5 bps to 0.05 per cent. Effective July 29, the Fed merged the interest rates on excess reserves and required reserves to a single interest rate on reserve balances. The Fed also announced two standing lending facilities, both overnight and collateralised, viz., domestic standing repurchase agreement facility and a repo facility for foreign and international monetary authorities. The latter – initially a temporary facility introduced in end-March 2020 and extended up to September 2021 – is now a permanent facility. The September Federal Open Market Committee (FOMC) statement noted that if the progress towards its maximum employment and inflation goals continued as expected, a moderation in the pace of asset purchases would be warranted soon. The FOMC also doubled the per-counterparty limit for ON RRP operations to US$160 billion per day, effective September 23, 2021. The ECB maintained a hold on its policy rate and the quantum of asset purchases in its meetings in April and June. On July 8, the ECB unveiled its new monetary policy strategy under which a symmetric 2 per cent inflation target was adopted, as against the earlier target of below but close to 2 per cent. The Harmonised Index of Consumer Prices (HICP)remains the measure of the price level5 and the primary monetary policy instrument is the set of ECB policy rates. With the policy rates ruling close to their effective lower bound, the ECB would likely resort to other instruments such as forward guidance, asset purchases, longer-term refinancing operations and other new policy instruments as required. As part of the strategy review, the ECB also announced a detailed roadmap up to 2024 for its comprehensive action plan on climate change. In its July meeting, the first under the new framework, the ECB maintained an accommodative monetary policy stance to meet its inflation target and provided forward guidance that interest rates would remain at their current level or lower till the inflation target was durably achieved. In its September meeting, the ECB announced a moderately lower pace of asset purchases under the Pandemic Emergency Purchase Programme (PEPP), without reducing the overall quantum of the purchase programme that is scheduled to end by March 2022. It has kept purchases under the Asset Purchase Programme (APP) unchanged. The Bank of England (BoE) maintained a pause on the bank rate at its all-time low of 0.1 per cent and kept the total quantum of asset purchases unchanged in its meetings in May, June, August and September. In its August meeting, the BoE indicated that a modest tightening of monetary policy over its three-year forecast period is likely and it signalled that, given appropriate economic circumstances, it would begin unwinding its quantitative easing by not re-investing maturing assets once the bank rate is raised to 0.5 percent6. The Bank of Japan (BoJ) in its meetings in April, June, July and September kept the monetary policy parameters – the key policy rates and the quantum of asset purchases – unchanged. In July, the BoJ sketched the preliminary outline of the Fund-Provisioning Measure to Support Efforts on Climate Change. The new measure would come into effect in 2021 under which the BoJ would provide interest-free loans against collateral for up to one year, with possibility of rollover, for on-lending to projects that addressclimate change7. Moreover, banks would be allowed to add twice the amount of any borrowing under the scheme to their macro add-on balances, which would earn 0 per cent interest as against the policy rate, which is currently (-) 0.1 per cent. The Bank of Canada (BoC) maintained its policy rate and the forward guidance in its meetings in April, June, July and September but effected tapersof CAD$1 billion (approximately US$0.8 billion)8 in its weekly purchases of government bonds in the April and July meetings, reducing the weekly pace of asset purchases to CAD$2 billion (approximately US$1.6 billion). Central banks of four AEs, viz., Iceland, Czech Republic, South Korea and Norway have raised their policy rates in 2021 so far. The central bank of Iceland has effected two hikes of 25 bps each and the Czech National Bank has raised rates thrice to a cumulative increase of 125 bps. Bank of Korea and Norges Bank raised policy rates by 25 bps in August and September, respectively (Chart V.6a). Within the EMEs, there has mostly been status quo or a move towards unwinding monetary accommodation, though some countries have extended the stimulus also. For instance, the People’s Bank of China (PBoC) increased the liquidity in the system by lowering the reserve requirement for most financial institutions by 50 bps effective July 15, freeing up about 1 trillion yuan (approximately US$154.3 billion) of liquidity to support the real economy. The PBoC has, however, maintained the one-year Loan Prime Rate (LPR) at 3.85 per cent since April 2020. Amongst other BRICS central banks, Banco Central do Brasil followed up on its 75 bps rate action of March with equal hikes of 75 bps each in May and June and 100 bps each in August and September. The Bank of Russia followed up on its 25 bps rate hike of March with hikes of 50 bps each in April and June, 100 bps in July and 25 bps in September. The South African Reserve Bank maintained a pause in its May, July and September meetings. The central bank of Turkey, which had maintained status quo since a hike of 200 bps in March 2021, cut rates by 100 bps in September attributing high inflation to transitory factors and noting that monetary tightening had lowered credit and domestic demand. Amongst other EME central banks, Banco de México hiked rates by 25 bps each in June, August and September, while the Central Bank of Chile raised rates by 25 bps in July and 75 bps in August (Chart V.6b). The central banks of Peru and Hungary have also raised rates in recent months. V.4 Global Financial Markets Global financial markets remained buoyant and easy financing conditions prevailed; however, volatility returned to the markets in September. Stock markets in a few AEs and EMEs scaled fresh peaks in September but slid in most countries. Bond yields, which had remained low up to August, edged up in September due to large sell-offs. The US dollar rallied in the wake of higher inflation and inflation expectations and the Fed announcement on commencement of the US taper in the near future. The EME financial markets, unlike 2013, did not experience a major upheaval in Q3 despite taper guidance by the Fed. Among AEs, the US equity markets continued to scale a new peak every month in Q2 and Q3, even after the Fed indication of likely taper. After peaking in early-September, the US market fell, led by technology stocks, and recorded its first monthly decline since January. Among other major AEs, European stock markets had seven consecutive months of gains up to August – the longest rally since the end of the sovereign debt crisis in 2012 – which came to an end in September. Strong corporate earnings and the accommodative monetary policy stance of the ECB had helped keep the markets bullish. The UK stock indices rose during Q2 due to the rapid pace of vaccination, attractive valuations and high dividend yield but have been flat thereafter. The Nikkei, which was trending down since Q2 as Japan lagged the other three major AEs in its pace of vaccination and infection control, rose from the last week of August due to election fever and increased pace of vaccination overtaking the US. EME stock indices had been essaying the fault lines in global recovery, and trending down since June due to the two-speed nature of the recovery, moderation of capital flows and rapid spread of the delta variant of the virus (Chart V.7). The EME stock markets got buffeted in August with China’s regulatory crackdown and continued to fall in September on concerns relating to China and change in monetary policy stance of several AEs. Stock markets in EMEs such as India and Russia, however, notched all-time highs in September. 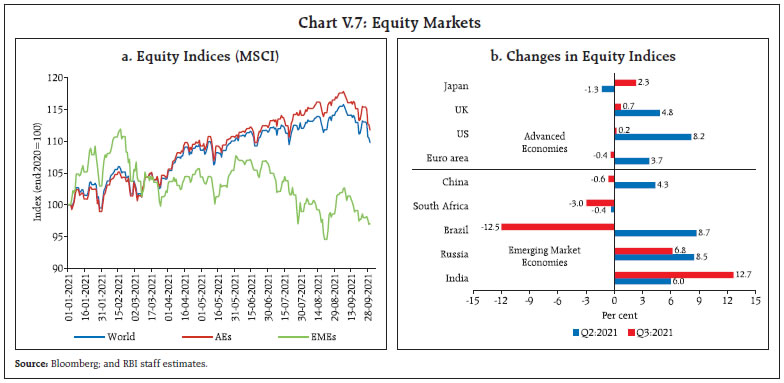 Bond yields in major AEs trended down in Q2:2021 and remained range-bound in Q3 up to August, reflecting the accommodative monetary policy stance maintained by the Fed, the ECB and the BoJ. Also, due to the persistent threat to recovery with rapid spread of the delta variant, the safe haven demand for government bonds continued. Since the September monetary policy meetings of the Fed and BoE, bond yields shot up sharply in most AEs led by large sell-offs. In the US, long-term treasury yields, which had risen at a rapid clip in Q1:2021 in line with rise in inflation expectations, treaded down in April-July even as inflation and inflation expectations remained high (Chart V.8a). In August, however, movements in long-term yields were more range-bound. Despite the significant rise in September, the 10-year yield at end-September was 25 bps lower than that prevailing at end-March 2021. 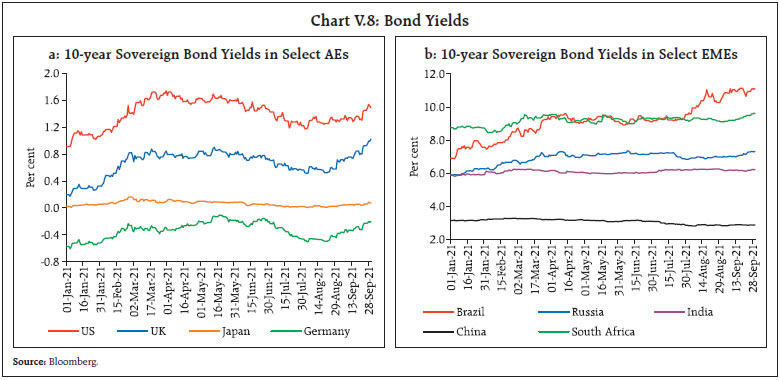
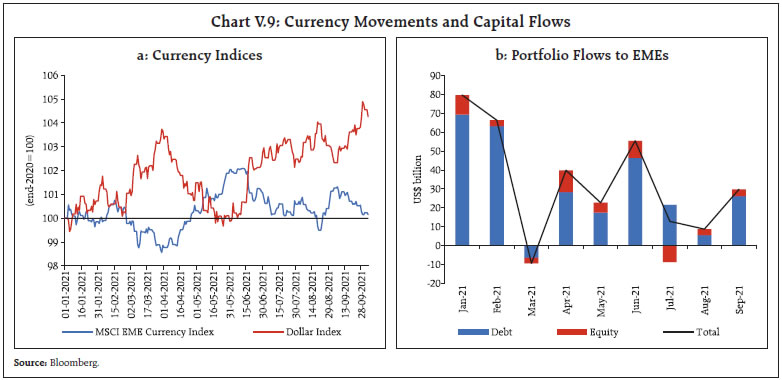 Yields in the EMEs moved bi-directionally till August – rising in those countries that began normalising monetary policy, while remaining soft in those with continued central bank support. EME bond yields rose in September, in line with the global trend (Chart V.8b). In currency markets, the US dollar has been strengthening since June 2021 on better economic prospects for the US as also higher inflation outcomes. The dollar rally strengthened in September in expectation of commencement of US taper later in 2021. In contrast, the emerging market currencies have depreciated after peaking in the second week of June (Chart V.9a). This was mainly triggered by retrenchment of capital flows following the release of the FOMC statement where dot plots suggested two likely rate rises in 2023 as against no rate hike forecast in March. Nevertheless, overall capital flows in September were higher than in August due to large sovereign bond issuances by EMEs (Chart V.9b). The MSCI Emerging Market Currency Index increased by 2.2 per cent in Q2:2021 but declined by 0.9 per cent in Q3:2021. V.5 Conclusion The multi-speed economic recovery across countries is becoming increasingly susceptible to renewed bouts of rapid spread of infections. There has been a perceptible slowdown of economic activity across the globe in recent months, particularly in Asia. Inflation remains high across the world, with supply disruptions becoming more widespread. There is a risk that above target inflation may persist longer than anticipated in several economies. The pervading threat of the delta variant has led monetary authorities – that had earlier signalled unwinding – to be on hold, while incremental inflationary pressures have made others signal a sooner unwinding. __________________________________________________________________________________
ABBREVIATIONS | AEs | Advanced Economies | | AEs | Advance Estimates | | AIDC | Agriculture Infrastructure and Development Cess | | AIFIs | All India Financial Institutions | | APP | Asset Purchase Programme | | AR | Autoregressive | | ARDL | Autoregressive Distributed Lag | | ASEAN | Association of Southeast Asian Nations | | ATM | Automated Teller Machine | | BE | Budget Estimates | | BIC | Bayesian Information Criterion | | BIES | Business Inflation Expectations Survey | | BIS | Bank for International Settlements | | BoC | Bank of Canada | | BoE | Bank of England | | BoJ | Bank of Japan | | BP | Band-Pass | | bps | Basis Points | | BRICS | Brazil, Russia, India, China and South Africa | | BSE | Bombay Stock Exchange | | CAD$ | Canadian Dollar | | CCIL | Clearing Corporation of India Limited | | CD | Certificate of Deposit | | CDS | Credit Default Swap | | CGA | Controller General of Accounts | | CI | Confidence Interval | | CiC | Currency in Circulation | | CII | Confederation of Indian Industry | | CIP | Covered Interest Parity | | CLI | Composite Leading Indicator | | CMIE | Centre for Monitoring Indian Economy | | COVID-19 | Coronavirus Disease 2019 | | CP | Commercial Paper | | CPI | Consumer Price Index | | CPI-AL | Consumer Price Index for Agricultural Labourers | | CPI-IW | Consumer Price Index for Industrial Workers | | CPI-RL | Consumer Price Index for Rural Labourers | | CRR | Cash Reserve Ratio | | CU | Capacity Utilisation | | DCA | Department of Consumer Affairs | | DEH | District as Export Hub | | DGCA | Directorate General of Civil Aviation | | DGCI&S | Directorate General of Commercial Intelligence and Statistics | | DII | Domestic Institutional Investor | | EBIT | Earnings Before Interest and Taxes | | ECB | European Central Bank | | ECI | Eight Core Industries | | ECLGS | Emergency Credit Line Guarantee Scheme | | EMDEs | Emerging Market and Developing Economies | | EMEs | Emerging Market Economies | | EPFO | Employees’ Provident Fund Organisation | | EU | European Union | | EXIM | Export-Import Bank of India | | FAO | Food and Agriculture Organization | | FBIL | Financial Benchmarks India Pvt. Ltd | | FDI | Foreign Direct Investment | | FE | Final Estimates | | Fed | Federal Reserve | | FICCI | Federation of Indian Chambers of Commerce and Industry | | FIMMDA | Fixed Income Money Market and Derivatives Association of India | | FIs | Financial Institutions | | FL | Family Labour | | FOMC | Federal Open Market Committee | | FPI | Foreign Portfolio Investment | | FRE | First Revised Estimate | | FRL | Full Reservoir Level | | F-TRAC | FIMMDA Trade Reporting and Confirmation System | | FY | Financial Year | | GDP | Gross Domestic Product | | GFCE | Government Final Consumption Expenditure | | GFCF | Gross Fixed Capital Formation | | GFD | Gross Fiscal Deficit | | GMM | Generalised Method of Moments | | GNDI | Gross National Disposable Income | | GoI | Government of India | | G-SAP | Government Securities Acquisition Programme | | G-Secs | Government Securities | | GST | Goods and Services Tax | | GVA | Gross Value Added | | H1 | First Half of the Financial Year (April-September) | | H2 | Second Half of the Financial Year (October-March) | | HICP | Harmonised Index of Consumer Prices | | HSD | High Speed Diesel | | ICICI | Industrial Credit and Investment Corporation of India | | ICR | Interest Coverage Ratio | | IIP | Index of Industrial Production | | IMD | India Meteorological Department | | IMF | International Monetary Fund | | INR | Indian Rupee | | IOCL | Indian Oil Corporation Limited | | IPO | Initial Public Offering | | IRDAI | Insurance Regulatory and Development Authority of India | | IRFCL | International Reserves and Foreign Currency Liquidity | | IT | Information Technology | | LAF | Liquidity Adjustment Facility | | LCR | Liquidity Coverage Ratio | | LM | Lagrange Multiplier | | LPA | Long Period Average | | LPG | Liquefied Petroleum Gas | | LPR | Loan Prime Rate | | LTROs | Long Term Repo Operations | | MAEQ | Maximum Admissible Export Quota | | M-cap | Market Capitalisation | | MCLR | Marginal Cost of Funds Based Lending Rate | | MFs | Mutual Funds | | MGNREGA | Mahatma Gandhi National Rural Employment Guarantee Act | | MMRP | Modified Mixed Reference Period | | MOAFW | Ministry of Agriculture and Farmers’ Welfare | | MoH&FW | Ministry of Health and Family Welfare | | m-o-m | Month-on-Month | | MOSPI | Ministry of Statistics and Programme Implementation | | MPC | Monetary Policy Committee | | MPR | Monetary Policy Report | | MSCI | Morgan Stanley Capital International | | MSEs | Micro and Small Enterprises | | MSF | Marginal Standing Facility | | MSMEs | Micro, Small and Medium Enterprises | | MSP | Minimum Support Price | | NABARD | National Bank for Agriculture and Rural Development | | NBFCs | Non-Banking Financial Companies | | NCAER | National Council of Applied Economic Research | | NDS | Negotiated Dealing System | | NDTL | Net Demand and Time Liabilities | | NEER | Nominal Effective Exchange Rate | | NGNF | Non-Government Non-Financial | | NHB | National Housing Bank | | NIP | National Infrastructure Plan | | NMEO-OP | National Mission on Edible Oil - Oil Palm | | NMP | National Monetisation Pipeline | | NPA | Non-Performing Asset | | NSC | National Savings Certificate | | NSDL | National Securities Depository Limited | | NSO | National Statistical Office | | NSS | Net Sentiment Score | | NSSO | National Sample Survey Office | | ODOP | One District One Product | | OECD | Organisation for Economic Co-operation and Development | | OMO | Open Market Operations | | ON RRP | Overnight Reverse Repurchase Agreement | | OPEC | Organisation of the Petroleum Exporting Countries | | OTC | Over-the-Counter | | PADO | Public Administration, Defence and Other services | | PBoC | People’s Bank of China | | PC | Principal Component | | PCE | Personal Consumption Expenditure | | PDS | Public Distribution System | | PD | Primary Dealer | | PE | Provisional Estimates | | PEPP | Pandemic Emergency Purchase Programme | | PFCE | Private Final Consumption Expenditure | | PIB | Press Information Bureau | | PLI | Production Linked Incentive | | PMGKAY | Pradhan Mantri Garib Kalyan Anna Yojana | | PMI | Purchasing Managers’ Index | | POL | Petroleum, Oil and Lubricants | | POSOCO | Power System Operation Corporation Limited | | PPAC | Petroleum Planning and Analysis Cell | | PRN | Production Weighted Rainfall | | PSB | Public Sector Bank | | PSU | Public Sector Undertaking | | PvB | Private Sector Bank | | Q1 | First Quarter | | Q2 | Second Quarter | | Q3 | Third Quarter | | Q4 | Fourth Quarter | | q-o-q | Quarter-on-Quarter | | QPM | Quarterly Projection Model | | RBD | Refined Bleached Deodorised | | RBI | Reserve Bank of India | | RD | Revenue Deficit | | REER | Real Effective Exchange Rate | | RHS | Right Hand Side | | RL | Rural Labourers | | RM | Reserve Money | | SAAR | Seasonally Adjusted Annualised Rate | | SCB | Scheduled Commercial Bank | | SDL | State Development Loan | | SEBI | Securities and Exchange Board of India | | SFB | Small Finance Bank | | SIAM | Society of Indian Automobile Manufacturers | | SIDBI | Small Industries Development Bank of India | | SIP | Systematic Investment Plan | | SLF | Special Liquidity Facility | | SLR | Statutory Liquidity Ratio | | SLTRO | Special Long-Term Repo Operation | | SPECS | Scheme for Promotion of Manufacturing of Electronic Components and Semiconductors | | T-Bill | Treasury Bill | | TLTRO | Targeted Long Term Repo Operation | | TSMC | Taiwan Semiconductor Manufacturing Company | | UK | United Kingdom | | UNCTAD | United Nations Conference on Trade and Development | | US | United States | | US$ | US Dollar | | USGS | United States Geological Survey | | VAR | Vector Autoregression | | VECM | Vector Error Correction Model | | VRRR | Variable Rate Reverse Repo | | WAC | Weighted Average Coupon | | WACR | Weighted Average Call Money Rate | | WADR | Weighted Average Discount Rate | | WADTDR | Weighted Average Domestic Term Deposit Rate | | WALR | Weighted Average Lending Rate | | WAM | Weighted Average Maturity | | WAR | Weighted Average Rate | | WEO | World Economic Outlook | | WMA | Ways and Means Advances | | WPI | Wholesale Price Index | | WTI | West Texas Intermediate | | WTO | World Trade Organization | | y-o-y | Year-on-Year | | YTD | Year to Date | |