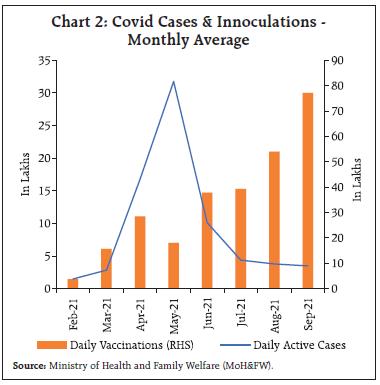
Amidst an accentuation of global risks, the Indian economy is picking up steam, although the recovery is uneven and trudging through soft patches. The step up in vaccination, slump in new cases/mortality rates and normalising mobility has rebuilt confidence. Domestic demand is gaining strength while aggregate supply conditions are recouping, powered by the robust performance of kharif agricultural production and revival in manufacturing and services. Softer than expected food prices have eased headline inflation into a closer alignment with the target. Introduction As the southwest monsoon begins its retreat, ushering in festivals of lights, sound and music, India gets set to resume exports of COVID-19 vaccines – grants and commercial deals1 - to the rest of the world. The world’s biggest vaccine manufacturer, India exported 66 million doses to 95 countries before being forced to suspend them in early April 2021 to deal with the perilous waves of the pandemic raging domestically (Chart 1). Now she re-engages from a position of strength, having vaccinated more than two-thirds of the adult population (95 crore) with a single dose and fully vaccinated over a quarter. The current inoculation rate of over 60 lakhs per day needs to be stepped up to 1.17 crore doses daily to fully cover the adult population by the end of the year (Chart 2). Indian vaccine manufacturers have trebled their output from April levels while companies have set up capacity to produce up to 3 billion vaccine doses annually. Under the QUAD initiative2 of producing at least 1 billion doses of vaccines for the Indo-Pacific region by the end of 2022, the vaccines will be produced in India with the US financing capacity expansion, Japan providing concessional loans to India and Australia giving last mile delivery support. India will finance 50 per cent of the first consignment of 1 million doses in October. 
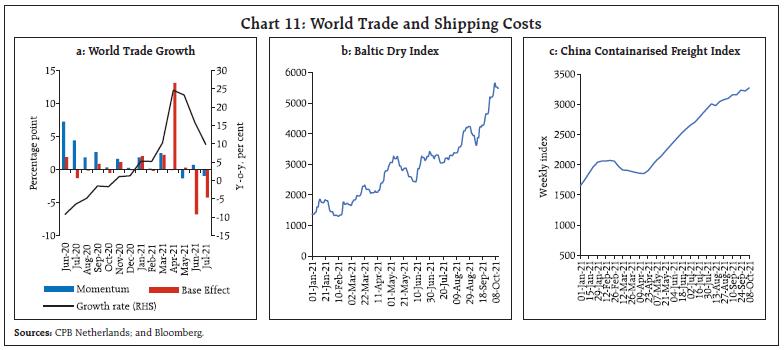
 With the 7-day rolling average of infections in India plunging from the world’s highest on May 9 to among the lowest by early October3, the green shoots of revival have spilled out of the high frequency indicators and on to the headline metrics in a recovery that is progressively solidifying. 2021-22 Kharif food grains production is slated to touch an all-time record. India has emerged as the world leader in exports of rice in 2021 – more than the combined exports of the next three exporters4 - and the third largest rice exporter has started buying the grain from India. On October 12 the Ministry of Statistics and Program Implementation (MoSPI) indicated that industrial production had rebounded past its 2019 level, with all constituents sharing in the breakthrough in sequential improvement, including the laggard - manufacturing – but excluding consumer durables which are in a slower catch-up. Merchandise exports have maintained their turbo-charged trajectory right into September, up 29.9 per cent from their corresponding monthly level before the pandemic. In fact, the swing in the current account balance from a deficit to a surplus of 0.9 per cent of GDP in the first quarter of 2021-22 is driven by a shift in gears from weak domestic and external demand to the robust strength of export performance of both merchandise and software. Meanwhile domestic demand is gaining strength, pushing non-oil non-gold imports 23.8 per cent above their level in September 2019 (Chart 3). Based on these developments, the latest update of the 21-factor nowcast, i.e., the Economic Activity Index (EIA) indicates that real GDP grew by 9.6 per cent in July-September 2021 (Kumar, 2021). 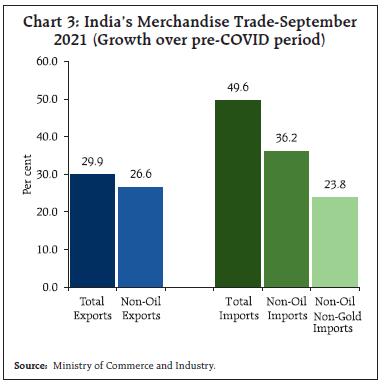 How is India preparing for the recovery? From the suite of forward-looking surveys conducted by the Reserve Bank of India (RBI) at the time of the meetings of the monetary policy committee (MPC) and other independent survey-based information, it is evident that there is an uptick in consumer confidence about the current situation though it is still in the contraction zone; however, expectations for the year ahead have broken through into positive territory in respect of the general economic situation; employment; households’ income and spending (Chart 4). Although the latter’s current perceptions indicate elevated inflation, their expectations over a year ahead have dipped 60 basis points. Housing sales are surging in the top seven cities. 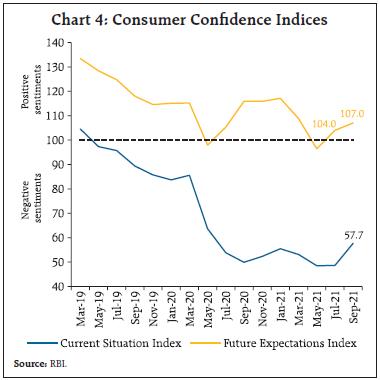 Turning to the corporate sector, it enters the recovery with distinctly improved fundamentals. Its credit profile has strengthened, with ratings upgrades having outpaced downgrades in the first half of 2021-22, according to various rating agencies. BSE Sensex companies are expected to register 25 per cent plus growth in their earning per share (EPS) (Chart 5).5 Sectors such as capital goods, metals and basic materials are expected to register sharp growth in their earnings. The renewable energy sector has gained impetus from two large acquisitions by an Indian conglomerate, setting the stage for consolidation in the solar industry, and a comprehensive, end-to-end ecosystem of cost-efficient green energy for Indian consumers. 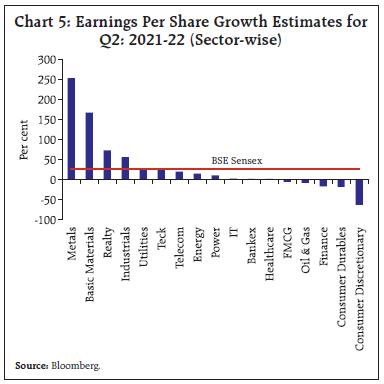 Our surveys also indicate that Government spending, strong order books and the improving pace of execution is lifting demand conditions across infrastructure-linked and services sectors, with downgrades confined to contact-intensive hospitality and aviation, power, real estate and textiles. Business conditions have recovered from second wave lows across firms in manufacturing, services and infrastructure in respect of demand parameters, financing conditions, demand for credit and profitability. Input cost pressures remain elevated across sectors, putting pressure on selling prices. Overall, business expectations for the second half of 2021-22 and the first quarter of 2022-23 are upbeat regarding capacity utilisation, production, order books and employment, with improvement expected in financing and credit conditions. Accordingly, the outlook on profit margins is bright (Chart 6). Looking ahead from here, the main downside to the prospects for the Indian economy, abstracting from the pandemic, is the possibility of a sudden accentuation of global risks. First, there are now clearer indications that the momentum of global growth is slowing, especially in the countries that were to be its key drivers. Retail sales spending, global car sales, industrial production and world merchandise trade have moderated, with shortages widening in key sectors such as semi-conductors and shipping. Longer supplier delivery times are also holding back output in some industries. Calculations by the OECD indicate that global output in mid-2021 was 3.5 per cent lower than projected before the pandemic – this represents a shortfall of one year of global output growth in normal times. The drag from the pandemic and supply bottlenecks is not likely to ease in 2021, with worries that rising infections in Asia may have downstream consequences for the availability of critical supplies and hence for the pace of global growth. The highly uneven nature of the global recovery is also imposing very different policy challenges across countries. 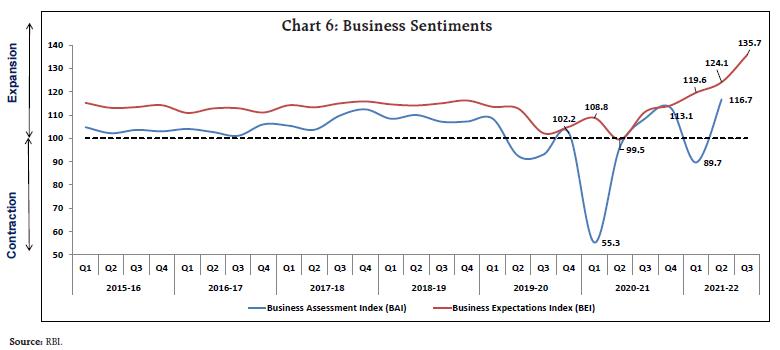 Second, the pandemic has put world trade at risk. It has had an unprecedented impact on container shipping and global supply chains, forces that had kept globalisation going strong. Congestion at ports in the US, Europe and Asia have disrupted sailing schedules and equipment shortage, particularly in exporting countries, and has created breaks in supply chains. Accumulated delays, pandemic protocols and poor schedule reliability are causing containers to remain in transit for longer, reducing the effective number of containers in active circulation, while armadas of vessels wait outside ports. The average cost of shipping a standard large container (a 40-foot-equivalent unit, or feu) is five times higher than a year ago (Chart 7). The average door-to-door shipping time for ocean freight has gone from 41 days a year ago to 70 days6. At the same time, in the first seven months of 2021, cargo volumes between Asia and North America were up by 27 per cent compared with pre-pandemic levels7. The most optimistic estimate is that disruptions could take a year to unwind, while the worst case scenario is of a slowing down and reordering of world trade. With order books bulging, shipping firms may be preparing for more regionalised trade and for smaller vessels replacing mega-vessels that can only be handled at the biggest ports. With the persistence of high costs and delays, conversations about deglobalisation are starting (Chart 8). 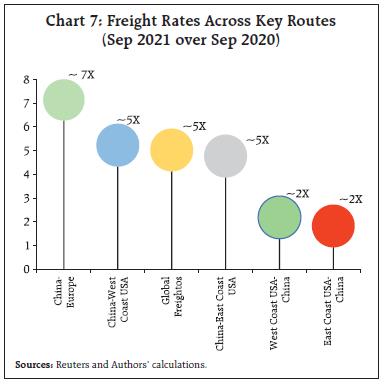 Third, elevated inflation levels among developed and developing countries alike are widely regarded as transitory but the sense is that it is expected to stay for longer, at least into 2022. Broad-based increases in export prices in Asia are being mirrored in import prices elsewhere. The OECD estimates that higher commodity prices and global shipping costs are currently adding 1.5 percentage points to G20 CPI inflation. In a scenario in which commodity prices rise further in the last quarter of 2021 and shipping costs remain elevated throughout 2022, G20 CPI inflation would be pushed up by 1.75 percentage points in the last quarter of 2021 and by more than 1 percentage point in 2022. Fourth, Evergrande and recent trepidations relating to the US debt ceiling have shone light on an area of “social silence”8 – the wider trend of inexorably rising indebtedness. According to the Institute of International Finance (IIF), total global debt hit a record level of US $ 296 trillion or 353 per cent of world GDP at the end of the second quarter of 20219. With the global economy three times leveraged, existential questions come to the fore: will high inflation be unleashed to reduce the debt? Will there be wide-spread debt forgiveness to avoid a social explosion? Will interest rates be forced to remain ultra low for longer, Or will there be mass defaults and financial crises? 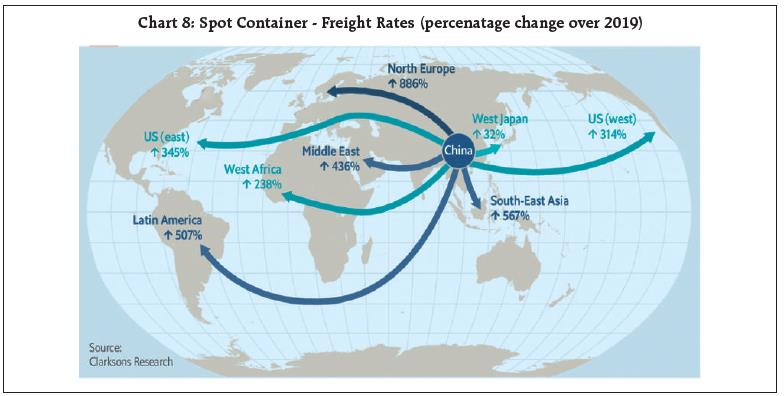 As pent-up demand collides with supply shortfalls, price pressures are inducing policy authorities to scale back stimuli. Yet, with the recent easing of the pace of the global recovery, there is a risk that fiscal and monetary policies may normalise just as activity loses momentum. The global economy may have to deal with new waves of the pandemic and withdrawal of stimulus simultaneously. In this challenging environment, the RBI’s monetary policy committee (MPC) maintained status quo on the policy rate and its accommodative stance in its 33rd meeting during October 6-8. With inflation easing for two months in a row, the MPC decided to keep prioritising the case for the recovery. The MPC’s decision was consistent with expectations and was well received by market participants. In keeping with this stance, the RBI committed to engage in a calibrated rebalancing of liquidity from passive absorptions under the fixed rate reverse repo to a more active modulation of liquidity through the main 14-day variable rate auctions and fine-tuning operations, including possibly 28 days tenor, as part of the graduated resumption of regular liquidity management operations. Apart from the higher rate of remuneration that these auctions entail, they also enable the dynamic discovery of the price of surplus liquidity or - from the point of view of banks - excess reserves. The RBI’s steadfast commitment to accommodation is reflecting in it extending the window of on tap long term repos for small finance banks and in permitting banks to on-lend through NBFCs under the priority sector. In its regulatory and developmental policies, the RBI intensified its focus on promoting digitalisation through the introduction of digital payments in offline mode, enhancement of the ‘per transaction’ limit under the Immediate Payment Service (IMPS) of the National Payments Corporation of India (NPCI), and a framework for geo-tagging (capturing geo-coordinates such as latitude and longitude) of the physical payment acceptance infrastructure for wider access to digital payments. The rest of the article is structured into four sections. Section II outlines recent global economic developments. An assessment of domestic macroeconomic conditions is presented in section III. Section IV reviews financial conditions in India and the last section concludes the article. II. Global Developments The global economic recovery is encountering outbreaks of the Delta variant, with supply shocks imposing restraints that are increasingly becoming binding. Moreover, with divergent output, employment and inflation outcomes across sectors and demographic groups, the recovery remains highly skewed, posing difficult policy choices. In its World Economic Outlook released on October 12, 2021 the International Monetary Fund (IMF) has revised down the global growth forecast for 2021 by 0.1 percentage point to 5.9 per cent from its July projection (Chart 9)10. The revision reflects markdowns in projections for the advanced economy group – primarily due to supply disruptions – and Association of Southeast Asian Nations (ASEAN) countries on account of the worsening pandemic situation. Upward revisions in projections have been made for some commodity exporters, partially offsetting the downgrades. In the IMF’s view, the impact of fault lines – unequal vaccine access; and policy support – are turning out to be more persistent than expected. On the other hand, the United Nations Conference on Trade and Development (UNCTAD)11 expects that the global economy is set for a strong rebound with a growth forecast of 5.3 per cent for 2021, albeit with considerable uncertainty clouding over the second half of the year. 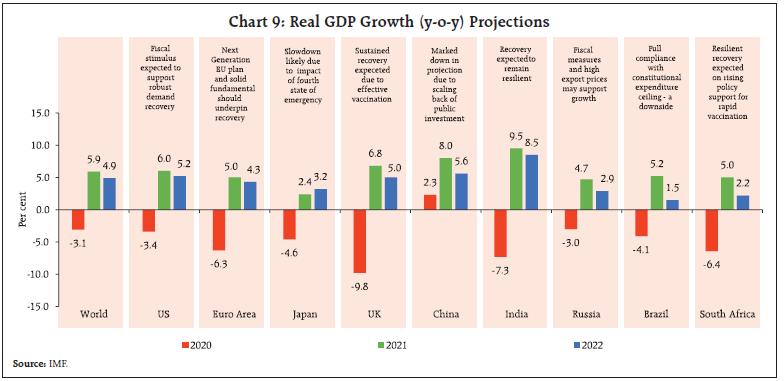 The global composite Purchasing Managers’ Index (PMI) registered an upturn in September, driven primarily by strengthening performance of the Euro area, while output growth in other major economies, including the US and India, expanded at a slower pace than in August (Chart 10). The global services PMI marked some improvement, while the global manufacturing PMI remained unchanged in expansion zone, besieged by persistent supply chain constraints and raw material shortages. U.S. GDP growth remained strong at 6.7 percent in the second quarter of 2021, sufficient to push output above its pre-pandemic level. It was led by consumer spending, benefiting from two rounds of stimulus. Non-residential fixed investment, government spending and exports also contributed to growth. The UK economy grew faster than anticipated in the second quarter at 5.5 per cent, aided by strong growth in household consumption and public spending. Similarly, Eurozone growth was revised up to 2.2 per cent in Q2, recording a solid rebound from two consecutive quarters of contraction. In October, the World Trade Organization (WTO) scaled up its projection for world merchandise trade volume in 2021 to 10.8 per cent from 8.0 per cent made in March. In Q2, trade volume growth had accelerated to 22.0 per cent (y-o-y). Over the rest of the year, it is expected to slow down to 10.9 per cent in Q3, followed by 6.6 per cent in Q4. Fresh COVID-19 outbreaks, strained global supply chains, semiconductor shortages and port congestion remain major headwinds to these upward revisions. Granular data for monthly merchandise trade show that y-o-y growth decelerated for three months up to July (Chart 11a). Shipping charges as measured by the Baltic Dry index continue to spiral, notching a new peak in early October (Chart 11b). Even the China (export) Containerised Freight Index (CCFI) continues to tread at elevated levels (Chart 11c). 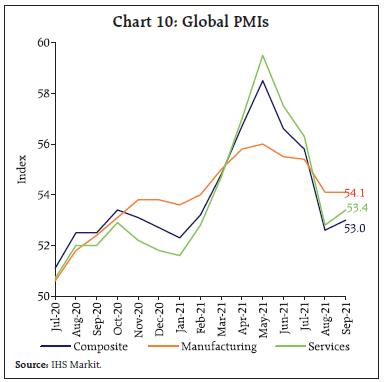
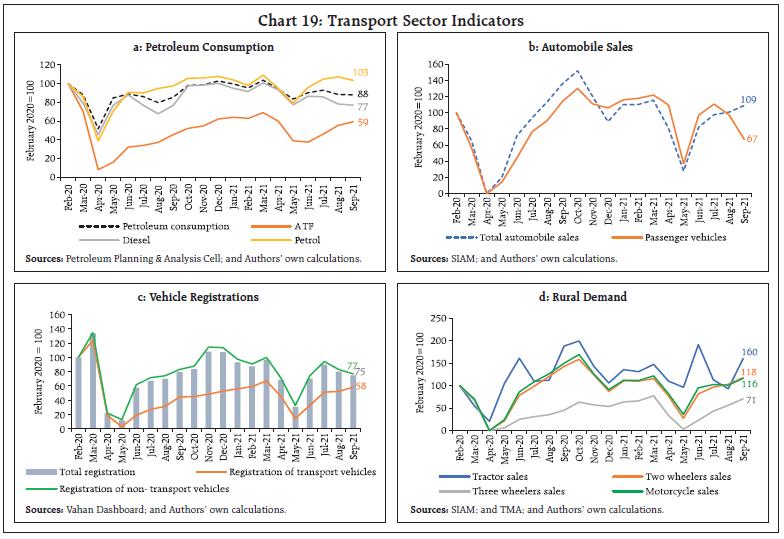
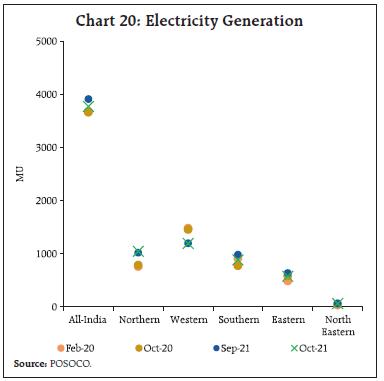
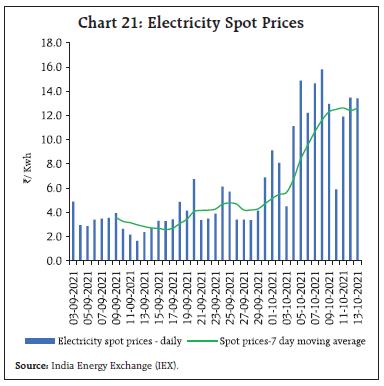
 Hard-hit sectors such as travel and leisure are likely to keep trade in services behind goods trade. The latest reading of the WTO’s Services Trade Barometer at 102.5, released in September, suggests that the recovery in services trade is expected to remain slow paced and may stabilise at below pre-pandemic levels this year. Mirroring widening supply-demand imbalances, commodity prices have rallied again from end-August, with the Bloomberg commodity price index soaring to a five-year high in early October (Chart 12a). Crude oil prices too have surged to a 3-year high in early October, crossing US$ 80 per barrel on improved demand prospects amidst persistent supply deficits. While the slowdown in the recovery in US output following disruptions from Hurricane Ida, and drawdown of inventories in China, have tightened supplies, the decision of OPEC plus in its meeting dated October 4, 2021 to maintain status quo on the pace of increase in crude oil supplies at levels agreed in the July meeting has added to the upside. At US$ 83.90 on Oct 11, 2021, Brent crude clocked year to date gains of almost 64 per cent (Chart 13b). Natural gas and coal prices have also surged to record highs on a worsening supply crunch amidst increasing demand ahead of the winter (Chart 13c). Gold prices, however, eased for the most part of September, ending the month with a decline of 3.1 per cent over August as the strengthening US dollar and rising US treasury yields dimmed the sheen of the yellow metal (Chart 12d). Prices of most industrial metals remain at elevated levels, barring iron ore, which has plummeted by more than 50 per cent below the high of May, albeit with some gain in early October (Chart 12e). Food prices picked up further in September, with prices firming up across all sub-indices, barring meat, reflecting tightening export availabilities due to weather disruptions in the face of strong import demand (Chart 12f). 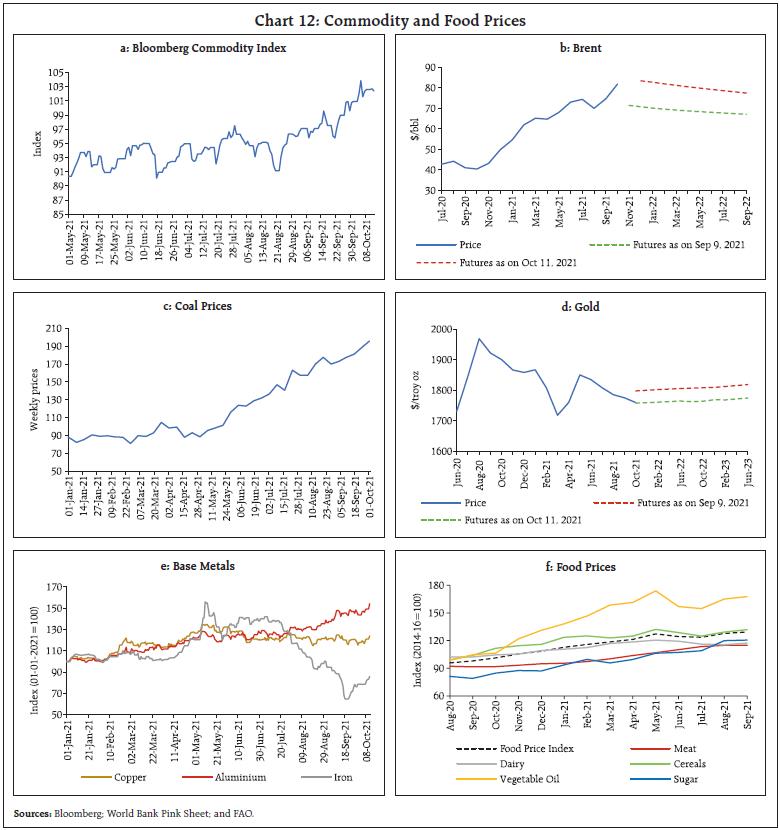 Inflation remains a cause of concern across advanced and emerging market economies. In the US, inflation measured by the personal consumption expenditure (PCE) deflator, ruled at a 30-year high in August due to energy and food prices. In the Euro area too, inflation scaled a 13-year high to 3.4 per cent in September, primarily driven by surging energy costs. In the UK as well, an unfavourable base effect due to last year’s discounted restaurant prices under the government’s ‘Eat Out to Help Out’ scheme and low value added tax pushed inflation to 3.2 per cent, its highest level since March 2012 (Chart 13a). Among major BRICS economies, inflation hardened to 7.4 per cent in Russia in September – its highest since June 2016 - while in Brazil, it shot up to 10.25 per cent for the same month, a level not seen since February 2016. In China, consumer price inflation has remained subdued, but producer prices have been scaling up on surging raw material costs amid supply disruptions (Chart 13b). 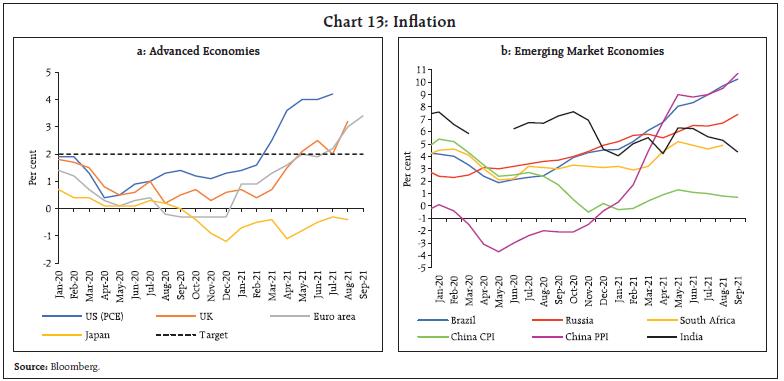 Global financial markets turned volatile from mid-September on rising concerns about inflationary pressures becoming persistent. Brewing crises in real estate and energy sectors and shifting monetary policy stances across major economies triggered a broad-based decline in global equity markets in September, erasing earlier gains and ending the quarter in the red (Chart 14a). The US S&P index fell from its recent peak in early September to register its worst monthly decline since March 2020, primarily due to sharp sell-offs in technology stocks. In October, however, the index pared some losses with the US Senate reaching an agreement to extend the debt ceiling up to early December. Stock markets in other major AEs underwent a similar correction. EME stock markets, barring India and Russia, sold off and remain bearish in reaction to Evergrande’s debt crisis, with the regulatory crackdown in China exacerbating the downtrend in September before exhibiting some reversal in early October (Chart 14b). Bond yields have surged across the globe, driven down by large sell-offs. In the US, the 10-year treasury yield has risen sharply following the FOMC’s statement on September 22, while bond yields in the UK have nearly doubled from end-August levels, moving above 1.0 per cent for the first time since May 2019 (Chart 14c). Tracking global cues, bond yields have been hardening across major EMEs, even for countries still holding on to an accommodative stance (Chart 14d). After a brief spell of correction towards end August, the US dollar has rallied through September and into October so far, mainly on safe haven flights (Chart 14e). Concomitantly, most EME currencies have depreciated, with retrenchment in capital flows amplifying the downswing (Chart 14f). 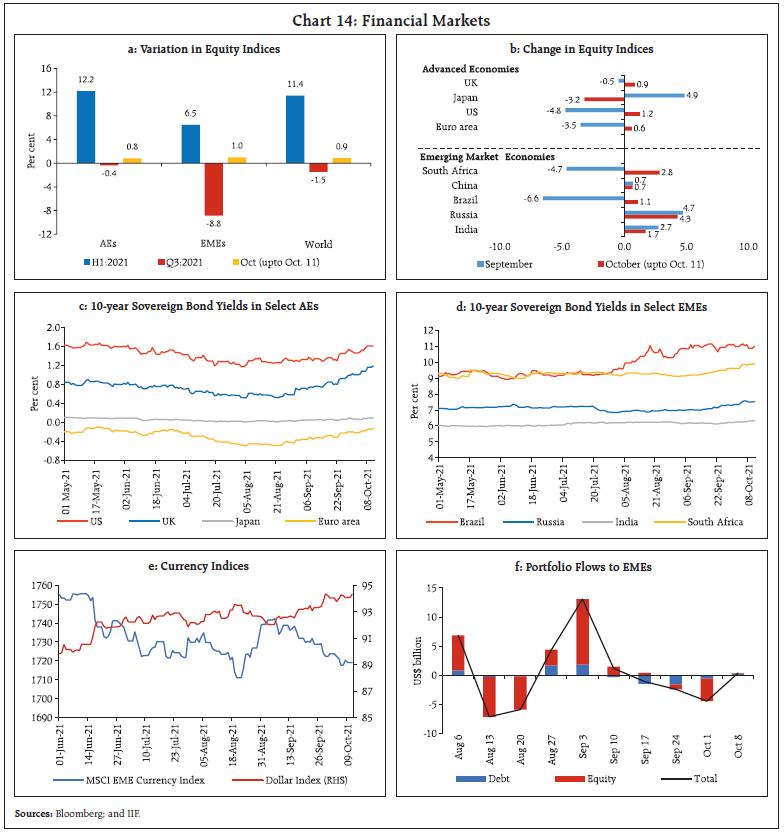 Reflecting these dissonant global macroeconomic and financial conditions, monetary policy actions and stances continue to diverge across countries, with more AE central banks joining their EME counterparts in either undertaking or indicating policy normalisation. In its September meeting, the US Federal Reserve kept the target federal funds rate and the quantum of asset purchases unchanged, but indicated that if the progress towards maximum employment and inflation goals continued as expected, a moderation in the pace of asset purchases would be soon warranted. Two other AE central banks – the Reserve Bank of New Zealand and Norges Bank - joined the league of AE central banks which have effected rate hike since the outbreak of the pandemic, taking the total count to five. Both the central banks raised their policy rates by 25 basis points (bps) each (Chart 15). Among other AEs, Iceland effected its third consecutive hike of 25 bps in October, while the Czech Republic resorted to its third hike at a higher magnitude of 75 bps. South Korea, on the other hand, maintained a pause in October after effecting its first hike in August. 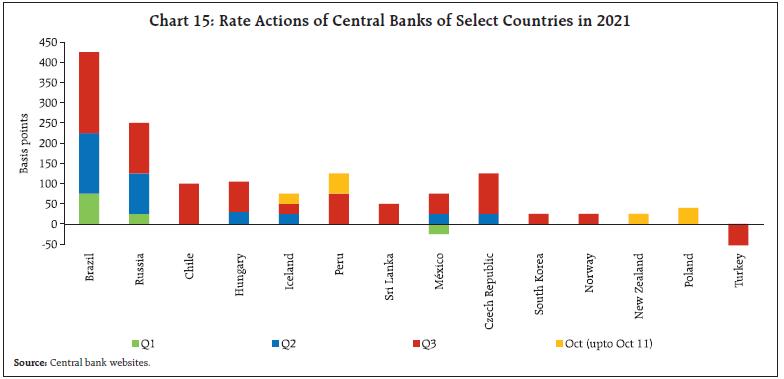 Among major EMEs, Brazil continued with policy tightening, raising its rate by another 100 bps in September and taking the total cumulative increase to 425 bps in 2021 so far. Hungary tempered the magnitude of increase to 15 bps in its fourth rate hike of 2021 in September, while Mexico and Peru effected their third consecutive rate hikes at a magnitude of 25 bps and 50 bps, respectively. Poland is the new addition among rate-hiking EMEs, effecting an increase of 40 bps in October for the first time since 2012. The Central Bank of Turkey, on the other hand, after maintaining a status quo since a hike of 200 bps in March 2021, slashed rates by 100 bps in September, attributing high inflation to transitory factors and dampening credit and domestic demand to earlier monetary tightening. Overall, the near-term outlook remains clouded, with renewed waves of infections keeping the global recovery uneven and fragile. With mounting inflation concerns leading to faster policy normalisation than envisaged earlier, risks to recovery as also financial stability have increased, especially in EMEs. III. Domestic Developments With signs of the second wave abating and mobility and activity returning towards normalcy, the Indian economy is picking up steam, although the recovery is uneven and trudging through soft patches. Even though a few high frequency indicators of economic activity have slowed down in September and early October, the step up in vaccination and slump in new cases and mortality rates has rebuilt confidence. The 7-day moving average of daily new cases plunged further during this period to an ebb of 18,060 on October 14, 2021 from 35,464 on September 12, 2021. Active cases comprise just 0.61 per cent of total infections, the lowest since March 2020, while the national COVID-19 recovery rate has risen to 98.07 per cent, the highest since the same reference date12. The pace of vaccination has been stepped up, with daily vaccinations surpassing the record 1-crore mark multiple times. The total number of doses administered has crossed 96 crore as on October 11, 2021 (Chart 16a and 16b). 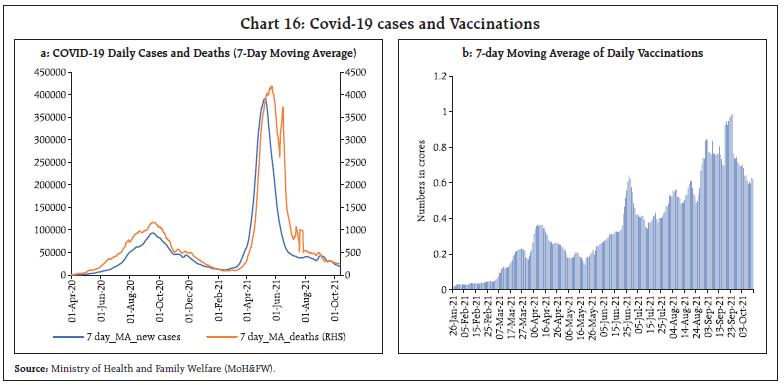 With the festive season setting in and offices opening up, the Google and Apple mobility indices have recorded growing footfalls in September-October. The Google mobility index for groceries and pharmacies surged beyond pre-pandemic levels, as did the Apple mobility index, led by the cities of Hyderabad and Mumbai (Chart 17a and 17b). Aggregate Demand With mobility on the rise, E-way bill collections in September remained buoyant sequentially, staying well above the pre-pandemic level of February 2020 in respect of both intra-state and inter-state bills (Chart 18a). Toll collections jumped by 75.9 per cent y-o-y (Chart 18b). Fuel consumption rebounded in September 2021, with the consumption of petrol sustaining beyond pre-pandemic levels and aviation turbine fuel (ATF) logging sequential improvement, even as diesel consumption eased marginally (Chart 19a). Automobile wholesales continued to surge although shortages of semiconductor chips impacted sales of passenger vehicles. Retail sales of motor vehicles moderated with festival season discounts around the corner. The decline in registrations was led by non-transport vehicles; however, the demand for transport vehicles improved y-o-y as well as sequentially (Chart 19c). As regards rural demand, tractor sales registered a m-o-m growth of 72.1 per cent in September (14.8 per cent decline y-o-y) (Chart 19d). Industrial and commercial demand has driven up electricity generation readings above their pre-pandemic levels (Chart 20). The production of coal, however, has not been able to keep pace during April-September 2021, the demand for power increased by 13.0 per cent y-o-y while the production of coal by Coal India Limited (with over 80 per cent share in domestic production) grew by 5.8 per cent. At the same time, the surge in international prices of coal has dampened imports, increasing dependence on domestic production. Production bottlenecks in view of heavy rains in September have added to the stress on coal stocks with power plants.13 This has caused spot prices of electricity to spiral on the India Energy Exchange (IEX) (Chart 21). According to the Ministry of Power’s Press Release of October 5, 2021, dispatches from coal mines have picked up on October 4, 2021 and are expected to increase further. 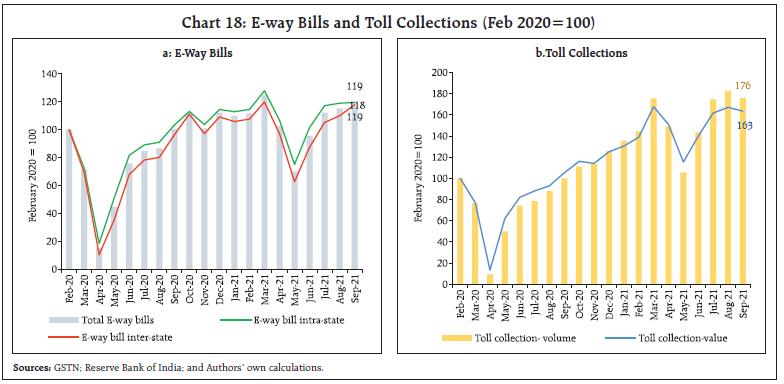
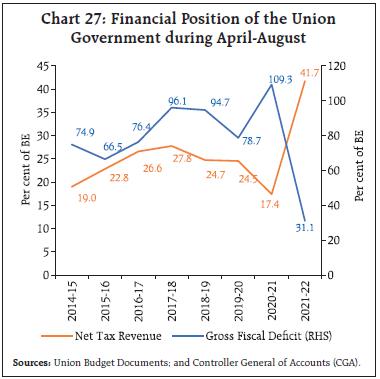
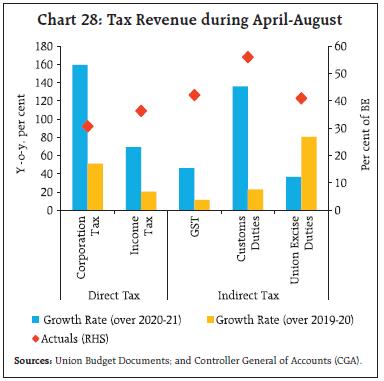
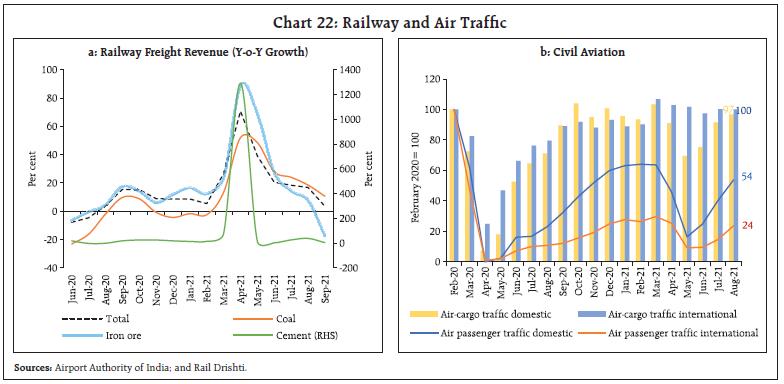 Turning to the services sector, railways freight traffic remained resilient, marking an increase of 3.6 per cent in September over its level a year ago and 19.7 per cent over its level in September 2019 (Chart 22). Normalised to February 2020 levels, high frequency indicators of the construction sector - steel consumption and cement production - trailed below the baseline. Over the corresponding pre-pandemic month in 2019, however, cement production posted a robust growth (Chart 23). In the aviation sector, both passenger and cargo traffic is picking up, with the cargo segment outperforming passenger business. In September and the first half of October, domestic air travel accelerated further on the back of festive season demand, with seating capacity increasing to 85 per cent from 72.5 per cent in August. Daily domestic airport footfalls14 averaged 4.6 lakhs/ day in September, an increase by 8.5 per cent over August and 5.3 lakhs/ day in October (up to October 10). International airport footfalls improved by 37.3 per cent m-o-m in September and 23.4 per cent m-o-m in October. 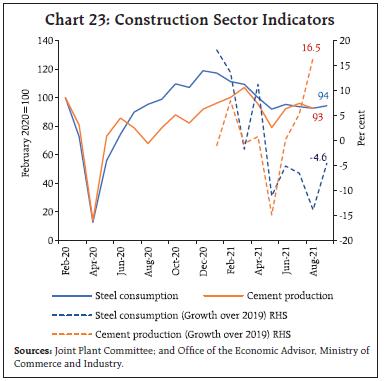 Sales of fast-moving consumer goods (FMCG) intensified in the first three weeks of September in the run-up to the festive season, led by discretionary products. Sales of commodities or staples have also seen a consistent rise. On-the-go products such as beverages and single serve packages that depend mainly on increased mobility also recorded a spurt. Digitisation is empowering kiranas and opening up new growth vistas for the FMCG sector.15,16 The household survey of the Centre for Monitoring Indian Economy (CMIE) indicated that the labour participation rate improved to 40.66 per cent in September, the highest in the past 12 months. As a result, the employment rate (worker population ratio) rose to 37.87 per cent, its highest in the last eight months. The unemployment rate slumped to 6.86 per cent in September from 8.32 per cent a month ago (Chart 24). Organised sector labour market data, as captured by the Employees’ Provident Fund Organisation (EPFO) and the Employees’ State Insurance Corporation (ESIC), show that the impact of the second wave on employment has been relatively muted (Chart 25). Labour market recovery is likely to be almost complete with the number of workers employed in September 2021 nearing levels seen in September 2019 (Chart 26). During April-August, the fiscal deficit of the Centre was contained at 31.1 per cent of budget estimates (BE), the lowest in 18 years (Chart 27). Direct tax collections surged by 101.1 per cent over 2020-21 levels. Indirect taxes grew by 52.4 per cent during the period on the same basis (Chart 28).17 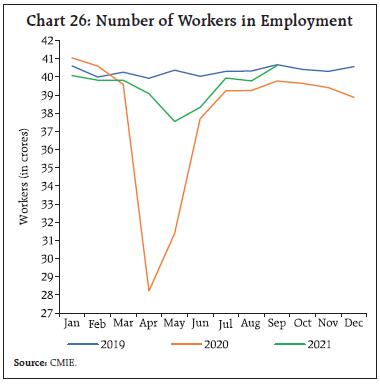
 Capital expenditure grew by 27.8 per cent, led by the Ministry of Road Transport and Highways, which has exhausted 67.0 per cent of its budgeted capital expenditure for 2021-22. In contrast, revenue expenditure contracted. During September-March 2021-22, revenue expenditure less of interest payments and major subsidies (RE-IP-S) of Centre is expected to grow by 13.8 per cent to meet budgeted levels. States are also likely to step up their expenditure as their revenue positions improve on the back of the receding threat of a third wave of infections. For 24 states, revenue expenditure less interest payments has to grow by 25.6 per cent through August-March 2021-22 to meet budgeted levels. For general government (Centre and states), this works out to a growth of 22.4 per cent during August-March, which is higher than in the preceding three years (Chart 29). In September, total GST collections (Centre plus states) stood at ₹1.17 lakh crore - a growth of 22.5 per cent y-o-y (Chart 30). Advance tax collections and provisional estimates of direct tax revenues for the Centre as on September 22, 2021 also indicate sustained buoyancy in tax revenues (Table 1). During H1:2021-22, India’s merchandise exports were in sight of the half-way mark of the annual export target of US$ 400 billion set for 2021-22. Merchandise exports remained above the US$30 billion mark for the seventh straight month in September 2021, driven by buoyant external demand for engineering goods, petroleum products and chemicals (Chart 31a and b). Export growth remained broad-based as 9 major commodity groups accounting for more than 70 per cent of exports recorded an expansion above their pre-COVID levels (Chart 32a). During April-September 2021, key commodity groups covering around half of exports were able to sustain growth consistently (Chart 33a to 33d). | Table 1: Tax Collections during April-September | | | Actuals (₹ thousand crore) | Growth Rate (per cent) | | 2019-20 | 2020-21 | 2021-22 | 2021-22
(over 2019-20) | 2021-22
(over 2020-21) | | Advance Tax | 221 | 162 | 253 | 14.6 | 56.4 | | Direct Tax | 449 | 327 | 571 | 27.1 | 74.4 | | Note: Based on data up to Sep 22, 2021. | Mirroring the spurt in domestic economic activity, India’s merchandise imports touched a historic monthly high of US$ 56.4 billion in September, riding on strong momentum (Chart 34a and 34b). Imports grew by almost 50 per cent during the month over the corresponding pre-pandemic level, fuelled by strong domestic demand for petroleum products, gold, vegetable oil and electronic goods. Imports of vegetable oil doubled from last year’s level due to a reduction in customs duty and stockpiling ahead of festivals. Higher electronic goods imports reflected mega sales planned by e-commerce companies in October 2021, apart from inventory management due to the ongoing chip shortage (Chart 32b). 
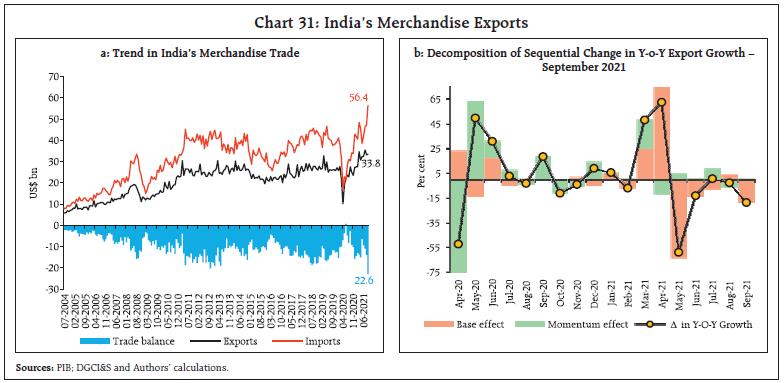 Purchases of coal, coke and briquettes from abroad have witnessed a massive spurt in the last two months in view of low coal stock positions of thermal plants (Chart 35a). Overall, non-oil-non-gold imports rose by more than 20 per cent in September over the pre-pandemic level (Chart 35b). The trade deficit widened to a record level of US$ 22.6 billion, increasing both sequentially and over pre-pandemic levels.
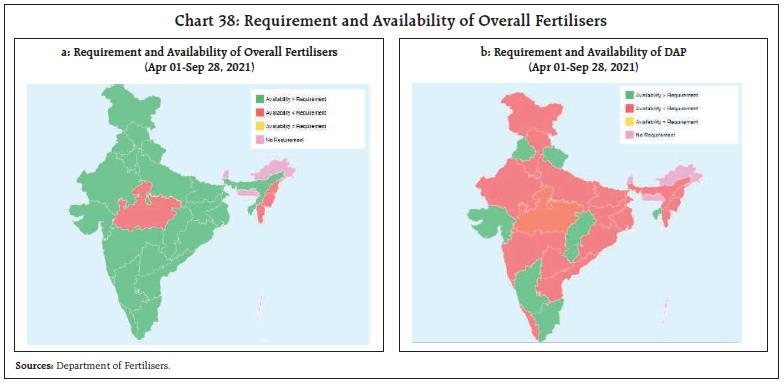
Aggregate Supply September turned out to be a month of revival rather than retreat for this year’s south-west monsoon (SWM). The rain deficit during the critical sowing months of July and August was offset by excess rains in September to the extent of 35 per cent, particularly in Central (85 per cent above LPA) and North-West (40 per cent above LPA) regions. The SWM season closed as ‘normal’ with a shortfall of only 1 per cent from the LPA. The September rainfall has brightened the prospects of Kharif crops, barring for some standing crop losses due to excess precipitation/flooding in respect of groundnut, soyabean, tur, urad, paddy and moong. It also bodes well for the forthcoming Rabi season with adequate soil moisture and replenished water storage levels. Over the last two decades, Rabi foodgrains production levels have gradually caught up with that of Kharif production and has even surpassed the latter in some years, especially when reinforced by heavy rains in September (Chart 36a). The average deviation of September rains from the LPA has narrowed from (-)2.9 per cent during 1981-2000 to (-)1.0 per cent during 2001-2020. The MSPs that were recently announced for the upcoming Rabi season have been higher than in the previous year by 2.0 per cent (wheat) and 8.6 per cent (rapeseed and mustard). Key inputs such as availability of seeds also augur well for Rabi prospects (Chart 37a and b). As regards fertilisers, urea and other major fertilisers, except Di-ammonium Phosphate (DAP), are available in surplus (Chart 38a and b). The Government has hiked the subsidy on DAP (critical for growing vegetable crops) thereby insulating farmers from higher input costs. The month of September also marks the end of the Kharif Marketing Season (KMS) for 2020-21. Rice procurement for KMS 2020-21 has progressed smoothly, with a purchase record of 89.1 million tonnes of paddy (including kharif 71.8 million tonnes plus rabi 17.3 million tonnes) as against 76.7 million tonnes a year ago (Chart 39). Over 13 million farmers have benefitted from KMS procurement operations, with MSP outflow of ₹1.7 lakh crore (at MSP rate of ₹1888/quintal). Meanwhile, as of October 1, 2021, the public stocks of rice and wheat were 3.4 and 2.3 times the buffer norms, respectively, auguring well for food security, including the ongoing third phase of the Pradhan Mantri Garib Kalyan Anna Yojana. 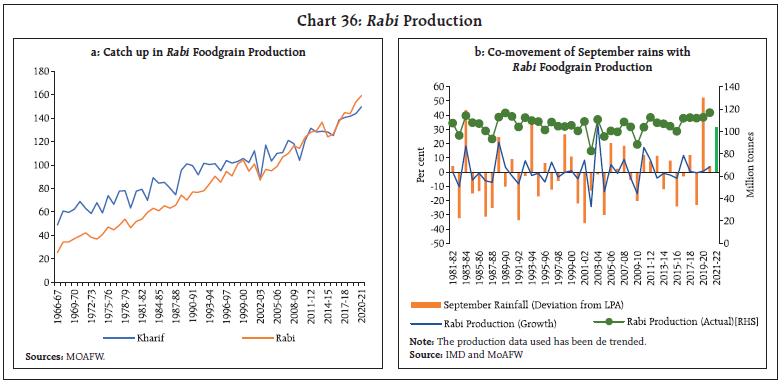

 In the industrial sector, the headline PMI Manufacturing Index improved to 53.7 in September from 52.3 a month ago, expanding for the third consecutive month. Improvement in demand and pick up in global sales led firms to scale up production and employ more inputs. After staying in contraction during May-July 2021, the services PMI expanded sequentially in August-September. Reopening of outlets and increased footfalls boosted consumption of services. The Business Expectations Index (BEI) for services emerged out of contraction zone in July 2021 and surged to a five-month high in August before expanding to 53.5 in September (Chart 40). Parts of the services sector recorded strong growth y-o-y, as indicated by improvement in trade, hotels, transport and communication, and also reflected in GST e-way bills (Table 2). Policy measures to address constraints faced by the telecom sector; and the PLI scheme for textiles, auto and drone industries are imparting confidence in the recovery. A ₹100 trillion plan for multi-modal connectivity, Gati Shakti, aimed at accelerating economic growth by building infrastructure, integrating key modes of transportation — road, rail, air, waterways — and reducing logistics cost has also been announced.18 Thus aggregate supply conditions are recouping as supply disruptions and bottlenecks get alleviated.
Inflation In September 2021, headline CPI inflation fell by one percentage point to 4.3 per cent, according to the National Statistical Office (NSO)’s data release on October 12 (Chart 41a). A large favourable base effect (month-on-month change in prices a year ago) of 1.1 percentage points overwhelmed the price momentum (month-on-month change in prices in the current month) of around 20 bps to bring about this desirable outcome. Among constituents, food and beverages inflation registered a sharp moderation on large favourable base effects, easing to 1.6 per cent in September from 3.7 per cent a month ago. These base effects pushed vegetables prices further into deflation – to (-) 22.5 per cent in September from (-) 11.7 per cent in August. While inflation in prices of eggs, meat, fish, fruits, spices and non-alcoholic beverages moderated, it edged up in oils and fats, milk, sugar and prepared meals sub-groups. Cereals prices remained in deflation. Food (with a weight of 45.86 per cent in the CPI basket) contributed only 18 per cent of headline inflation in September (Chart 41b). Fuel inflation surged by close to 70 bps in September to scale an all-time high of 13.6 per cent (in the 2012=100 base year series). This is attributable to a substantial pick up in LPG prices. Fuel (weight of 6.84 per cent in the CPI basket) contributed 20 per cent of headline inflation in September (Chart 41b). CPI inflation excluding food and fuel19 or core inflation at 5.9 per cent in September (as against 5.8 per cent in August) stayed elevated. Price inflation in respect of clothing and footwear, personal care and effects, household goods and services, recreation and amusement, and pan-tobacco and intoxicant sub-groups firmed up. High frequency food price data from the Ministry of Consumer Affairs, Food and Public Distribution (Department of Consumer Affairs) for October so far (October 1-12, 2021) points to some uptick in prices of cereals. In case of pulses, tur and moong prices registered a decline, but masoor, gram and urad prices edged up. Among edible oils, prices of mustard oil and vanaspati increased, while those of sunflower oil declined. Among vegetables, prices of tomato and onion have seen sharp increases in October so far; however, these prices remain lower than a year ago (Chart 42).
Pump prices started to register increases towards the end of September and as on October 12, 2021, petrol price stood at ₹105.43 per litre (average of the pump prices in the four major metros) and diesel was at ₹97.02 per litre. Both kerosene and LPG prices edged up in the first half of October (Table 3). Input costs, as reflected in the PMIs, increased in September across manufacturing and services. The pass-through of higher input costs to selling prices remained muted, especially in services. The firms polled by the Reserve Bank’s in-house surveys on manufacturing, services and infrastructure outlook indicated a likely amplification of input cost pressures in Q3:2021-22. | Table 3: Petroleum Product Prices | | Item | Unit | Domestic Prices | Month-over-month (per cent) | | Oct-20 | Sep-21 | Oct-21^ | Sep-21 | Oct-21 | | Petrol | ₹/litre | 83.88 | 102.30 | 104.22 | -0.7 | 1.9 | | Diesel | ₹/litre | 74.32 | 92.62 | 95.52 | -0.8 | 3.1 | | Kerosene (subsidised) | ₹/litre | 21.45 | 33.18 | 34.56 | -3.2 | 4.2 | | LPG (non-subsidised) | ₹/cylinder | 604.63 | 895.13 | 910.13* | 2.9 | 1.7 | ^: For the period October 1-12, 2021.
*: Since October 6, 2021.
Note: Other than kerosene, prices represent the average Indian Oil Corporation Limited (IOCL) prices in four major metros (Delhi, Kolkata, Mumbai and Chennai). For kerosene, prices denote the average of the subsidised prices in Kolkata, Mumbai and Chennai.
Sources: IOCL; Petroleum Planning and Analysis Cell (PPAC); and RBI staff estimates. | IV. Financial Conditions Through September and into October, the Reserve Bank engaged in proactively rebalancing systemic liquidity. The daily net liquidity absorption under the liquidity adjustment facility (LAF) averaged ₹7.8 lakh crore in the second fortnight of September to October (up to Oct 13), reducing from ₹8.9 lakh crore in the first fortnight of September (Chart 43). During this period, the Reserve Bank also resorted to fine tuning operations of varying maturities and amounts on top of its main 14-day variable rate reverse repo (VRRR) operation, which was conducted for ₹4.0 lakh crore by end-September. On October 8, the Reserve Bank announced that it would further augment the size of 14-day VRRR auctions conducted every fortnight in the following manner: ₹4.0 lakh crore on October 8; ₹4.5 lakh crore on October 22; ₹5.0 lakh crore on November 3; ₹5.5 lakh crore on November 18; and ₹6.0 lakh crore on December 3. For the first time, the Reserve Bank conducted G-SAP ‘twists’, by buying government securities of ₹30,000 crore through two auctions on September 23 and September 30, with simultaneous sale of an identical amount in both the auctions so that in the net, these operations were rendered liquidity neutral. In its policy statement on October 8, the Reserve Bank noted that the need for undertaking further G-SAP operations does not arise at this juncture given the liquidity overhang, but it committed to maintaining the readiness to undertake G-SAP as and when warranted by the evolving liquidity conditions. With these operations, the overnight money market rates particularly in the collateralised segment – the tri-party repo and the market repo rates – inched closer to the lower bound of the LAF corridor, though softened again in October (up to October 13). On an average, both the rates stayed below the reverse repo rate by 14 bps and 10 bps, respectively. In the outer term money market segments, the 3 month T-bill rate moved above the reverse repo rate, the spreads on certificate of deposits (CDs) and commercial paper (CP)-NBFCs (over the reverse repo rate) firmed up to an average of 12 bps and 21 bps, respectively (Chart 44). 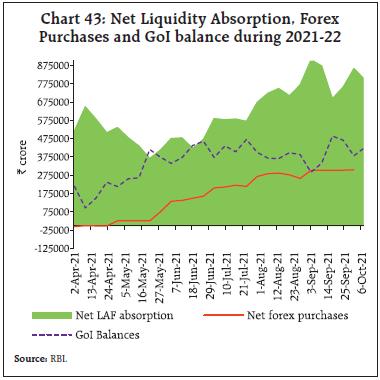 In the government securities market, the yield on 10 year G-sec hardened towards the end of September and on October 14, it closed at 6.33 per cent (Chart 45a). Global factors, including rising US treasury yields and crude oil prices, imparted a hardening bias to domestic yields. In the primary segment, positive impact of the announcement of the Central Government’s borrowing calendar for H2:2021-22 – which essentially subsumes GST compensation cess related shortfalls within its envelope was overshadowed by global spillovers. During September and October so far, all auctions sailed through smoothly. Tracking the movement in G-sec yields, yields on corporate bonds too shed their softening bias and trended higher from end-September (Chart 45b). 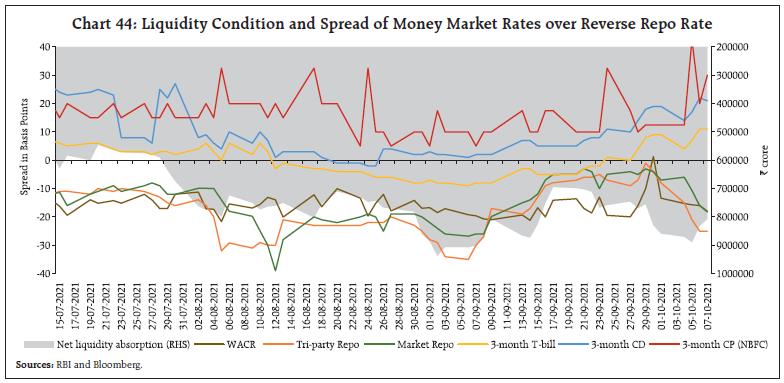 Overall monetary and credit conditions remained congenial. The growth in scheduled commercial banks’ (SCBs’) credit to the commercial sector picked up, but remained muted by pre-pandemic standards, at 6.7 per cent (5.2 per cent a year ago) (Chart 46). Monetary transmission in the credit market improved since March 2020 on the back of abundant surplus liquidity. Between March 2020 and September 2021, the one-year median marginal cost of funds-based lending rate (MCLR) of SCBs softened cumulatively by 103 bps, mirroring the reduction in the overall cost of funds (Table 4).
There has been a moderation in deposit rates across all tenors. The median term deposit rate on fresh deposits has softened by 154 bps through March 2020 to September 2021. A dip of 180 bps is discernible across shorter tenor deposits of up to one-year maturity (Chart 47). The weighted average domestic term deposit rate (WADTDR) on outstanding rupee deposits has eased by 135 bps during March 2020 to August 2021. Across domestic banks, private banks have exhibited higher pass-through to term deposit rates, compared to their public sector counterparts, on account of vigorous deposit growth. 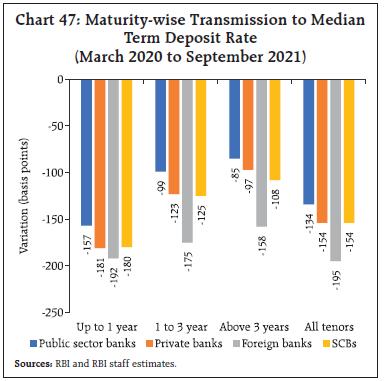
| Table 4: Transmission from the Repo Rate to Banks’ Deposit and Lending Rates | | (Variation in basis points) | | Period | Repo Rate | Term Deposit Rates | Lending Rates | Median TDR
(Fresh Deposits) | WADTDR
(Out-standing Deposits) | 1 - Year Median MCLR | WALR
(Out-standing Rupee Loans) | WALR
(Fresh Rupee Loans) | | Feb 2019 - Sept 2019 | -110 | -9 | -7 | -30 | 2 | -43 | | Oct 2019 – Sept 2021* | -140 | -187 | -174 | -125 | -120 | -147 | | Mar 2020 - Sept 2021* | -115 | -154 | -135 | -103 | -102 | -121 | | Feb 2019 – Sept 2021* | -250 | -213 | -181 | -155 | -118 | -190 | *: Latest data on WALRs and WADTDR pertain to August 2021.
WALR: Weighted average lending rate;
WADTDR: Weighted average domestic term deposit rate;
MCLR: Marginal cost of funds-based lending rate; TDR: Term deposit rate.
Source: RBI. | The Government of India (GoI) left interest rates on small savings instruments (SSIs) unchanged for the sixth straight quarter.20 The currently prevailing rates on various schemes range 47-178 bps higher than the formula-based rates for Q3:2021-22 (Table 5). The stock market continued its bull run, with the BSE Sensex crossing the historical 60,000 mark in September 2021 (Chart 48a). Indian stock markets have more than doubled in terms of index value for Sensex and Nifty since the lows of March 2020. The announcement of the Production Linked Incentive (PLI) scheme for automobile and drone industries, relief measures for the telecom sector, and approval of a guarantee programme for issuance of securities by the National Asset Reconstruction Company Limited (NARCL) buoyed the mood of the market. Buoyed further by prospects of robust corporate earnings results in Q2: 2021-22, the BSE Sensex extended gains to October 2021, closing at 61,306 on October 14, 2021. The implied equity risk premium, a measure of expected excess return on equities over G-secs, closed at its lowest level in September 2021. | Table 5: Interest Rates on Small Savings Instruments – Q3:2021-22 | | Small Savings Scheme | Maturity (years) | Spread (Percentage point) $ | Average G-sec Yield (%) of Corresponding Maturity
(June - August 2021) | Formula based Rate of Interest (%) (applicable for Q3:2021-22) | Government Announced Rate of Interest (%) in Q3:2021-22 | Difference (basis points) | | (1) | (2) | (3) | (4) | (5) = (3) + (4) | (6) | (7) = (6) - (5) | | Savings Deposit | - | - | - | - | 4.00 | - | | Public Provident Fund | 15 | 0.25 | 6.38 | 6.63 | 7.10 | 47 | | Term Deposits | | | | | | | | 1 Year | 1 | 0 | 3.72 | 3.72 | 5.50 | 178 | | 2 Year | 2 | 0 | 4.23 | 4.23 | 5.50 | 127 | | 3 Year | 3 | 0 | 4.74 | 4.74 | 5.50 | 76 | | 5 Year | 5 | 0.25 | 5.76 | 6.01 | 6.70 | 69 | | Recurring Deposit Account | 5 | 0 | 4.74 | 4.74 | 5.80 | 106 | | Monthly Income Scheme | 5 | 0.25 | 5.73 | 5.98 | 6.60 | 62 | | Kisan Vikas Patra | 124 | 0 | 6.38 | 6.38 | 6.90 | 52 | | | Months# | | | | | | | NSC VIII issue | 5 | 0.25 | 5.89 | 6.14 | 6.80 | 66 | | Senior Citizens Saving Scheme | 5 | 1.00 | 5.76 | 6.76 | 7.40 | 64 | | Sukanya Samriddhi Account Scheme | 21 | 0.75 | 6.38 | 7.13 | 7.60 | 47 | $: Spreads for fixing small saving rates as per Government of India Press Release of February 2016.
#: Current maturity is 124 months.
Note: Compounding frequency varies across instruments.
Sources: Government of India; FBIL; and RBI staff estimates. |
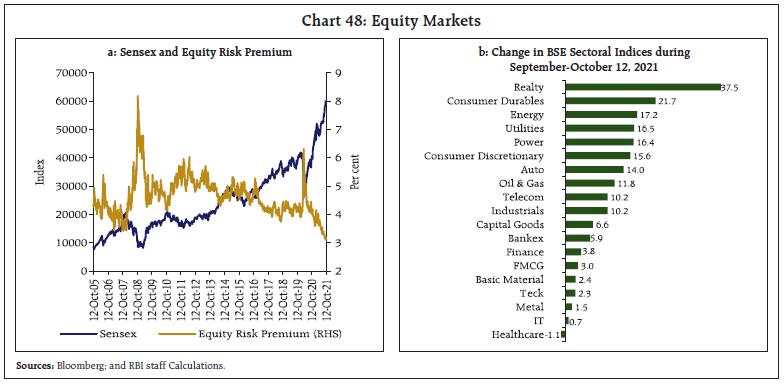 Among sectors, the BSE Realty index registered sharp gains, hitting a 11-year high on signs of pickup in demand (Chart 48b). India’s stock market capitalisation soared to US$3.5 trillion, surpassing that of France and becoming the sixth most valuable market in the world.21 India’s share in global stock market capitalisation has increased to 3 per cent on October 13, 2021 (Chart 49). Net inflows from small towns and cities into mutual funds are growing rapidly. The share of ‘other cities’ (beyond the top 110 cities) in assets under management (AUM) data has surged to 15.44 per cent at end-June 2021 from 10.21 per cent at end-June 2020. Floating rate mutual funds or ‘floater funds22’ have witnessed higher inflows in the recent period. During H1: 2021-22, floater funds witnessed net inflows of ₹33,083 crore, considerably higher than ₹12,170 crore a year ago. The AUM of floater funds has risen to ₹1.01 lakh crore at end-September 2021 from ₹46,425 crore a year ago (Chart 50a). Concomitantly, floating rate corporate bond issuances have also risen in recent months (Chart 50b). 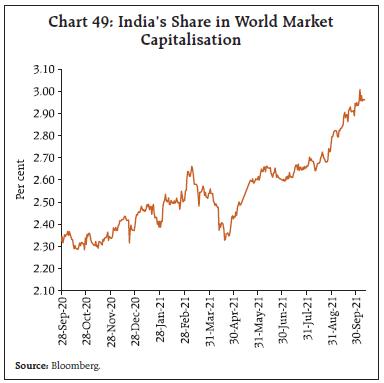 In April-August 2021, gross inward foreign direct investment (FDI) at US$ 36.3 billion was comparable with its level a year ago (Chart 51). A rise in outward FDI during the period resulted in net FDI of US$ 19.2 billion. The major FDI equity recipient sectors include manufacturing, communication services, computer services, education, research and development, and transport. Foreign portfolio investors (FPIs) were net purchasers for the second consecutive month in the domestic equity market in September 2021, driven by the anticipation of stronger recovery and the performance of the domestic stock market (Chart 52). India was the second largest recipient of FPI equity investment among the emerging markets, after China.23 FPIs remained net buyers in the domestic debt market in the third straight month in September. Total FPI investment in equity and debt instruments was US$ 3.0 billion in September, about the same as a month ago (US$ 3.1 billion). Foreign exchange reserves were at US$ 639.5 billion on October 8, 2021 (Chart 53), providing cover equivalent to 14 months of imports projected for 2021-22 or 112 per cent of total external debt outstanding or 52 per cent of total external liabilities at end-June 2021.24 In the foreign exchange market, the Indian rupee (INR) appreciated against the US dollar in September 2021 by 0.8 per cent (m-o-m) on the back of robust FPI inflows. This was reflected in the movement of the INR in terms of the 40-currency real effective exchange rate (REER) index, which appreciated by 0.7 per cent over its level a month ago (Charts 54a & 54b).
Payment Systems Digital payment transactions maintained a steady growth momentum (y-o-y) in September 2021 (Table 6) and October 2021 (up till October 8). Real Time Gross Settlement (RTGS) wholesale transfers posted double-digit growth, both in volume and value terms. In the retail segment, transactions through the National Electronic Funds Transfer (NEFT), the Immediate Payment Service (IMPS), the National Electronic Toll Collection (NETC), and the Bharat Bill Payment System (BBPS) also expanded strongly. Transaction values processed under the Unified Payments Interface (UPI) channel remained resilient and well above the ₹6 lakh crore mark for the third successive month, while volumes scaled a new peak of 365 crore transactions. The number of banks live on the platform has also risen from 174 in September 2020 to 259 in September 202125, attesting to the growing ubiquity of UPI as a payment mode in the digital space. In line with the goal to review the corridor and charges for inbound cross-border remittances in the Payment System Vision 2021, the Reserve Bank has decided to link UPI with the PayNow - Singapore’s fast payment system - by July 2022. This is aimed at facilitating instant, efficient, and frictionless cross-border payments that can further incentivise trade and investments between the countries. As India is the largest recipient of remittances globally26, this linkage can be a breakthrough in the evolution of a robust multi-country payments ecosystem that can potentially spearhead the transition towards ‘payments without borders’.
As a measure to streamline customer onboarding and level playing field for non-banks, the Reserve Bank has allowed NBFCs, payment system providers, and payment system participants to apply for Aadhaar e-KYC authentication licence. On the innovation front, six entities have successfully exited the first cohort on retail payments under the Regulatory Sandbox (RS) scheme for FinTechs, while the test phase has commenced for eight entities in the second cohort on cross-border payments. The Bank has also announced the opening of the third cohort with ‘MSME Lending’ as its theme. The fact that India has the highest FinTech adoption rate of 87 per cent, as compared with the global average of 64 per cent27, underscores the potential of initiatives like RS to devise alternatives that can address credit gaps, drive financial inclusion and further bolster the digital revolution underway. Under the PM Street Vendor’s Atma Nirbhar Nidhi (PM SVANidhi) scheme, the Ministry of Electronics and Information Technology (MeitY) and the Ministry of Housing and Urban Affairs (MoHUA) have recently launched an initiative to increase digital onboarding of street vendors across 223 cities in the country.28 This is expected to expand the formal credit ecosystem and further the agenda of an inclusive Digital India. With the festival season in the offing, the digital payment ecosystem is poised for stronger growth on the back of the growing footprint of e-commerce in lower-tier cities and rising awareness about digital modes. Mirroring such optimism, the National Payments Corporation of India (NPCI) expects the UPI to hit transactions worth US$1 trillion annually.29 V. Conclusion Everywhere, resurgent demand is being choked by supply bottlenecks, placing the global recovery at risk. In fact, supply chain disruptions seem to be feeding on one another, amplified simultaneously by decarbonisation drives and trade wars. As people opt out of the workforce, global labour shortages are hamstringing factory output and stalling vital services like transportation. As margins get squeezed and prices get pushed up, elevated levels of inflation with considerable cross-country heterogeneity are reflecting these demand-supply imbalances as well as the intense competition among countries for natural resources and key intermediates – the most recent one being energy. These developments are forcing the hands of central banks and fiscal authorities to scale back their pandemic policies, led by emerging economies, and this is shaping into another headwind to global growth. The consensus seems to veer around the prognosis that supply gaps and impediments will last at least through the better part of 2022. The fear is that in the interregnum, second-round effects may set in, entrenching inflation while growth suffers stagnation. There is also the possibility of facing an inventory recession when the supply backlogs are eventually cleared. There is an urgency now around speeding up vaccination of the world, but in these evolving configurations, it is becoming increasingly clear that vaccination alone will not boost the global economy. The other factors that are at work need to be addressed by the right mix of policies and coordinated across borders to keep the recovery going. Already financial markets are sending warning signals - equity prices are wobbling, spooked by the rise in bond yields, and currencies are wilting in the face of the strength of the US dollar. Markets fear that the inevitable rise in interest rates is going to be driven by a rise in inflation rather than a rise in the pace of growth. Premature tightening could bring about the stagflation that all fear, quashing growth just as the economy is recovering. In an influential view, history is thick with examples of central banks under doing it - underestimating the need for continuing stimulus.30 Perhaps the need of the hour is not to focus so single-mindedly on normalisation but on supply side reforms to ease the bottlenecks and disruptions, labour shortages and high commodity prices, especially of crude. Climate, infrastructure, digitalisation, education and re-skilling are areas for longer-term investment and supply expansion that have nearer-term demand boosting effects. Meanwhile, financial stability concerns are rising to the fore as markets and financial intermediaries rebalance to calibrate to near-term prospects. Going forward, the focus is likely to be on the normalisation of prudential policies and the strengthening of insolvency frameworks and restructuring mechanisms, including for the overhang of public and private debt. In this uncertain and volatile global environment, we maintain our view that India crossed a turning point in August-September, as we wrote in the August issue of the State of the Economy. On inflation, the MPC’s call has turned out to be correct, with the softer than expected food prices providing the impetus for a further disinflation of the headline to a closer alignment with the target. On the other hand, the economy may be healing but it is still digging out of one of the deepest contractions to hit any major economy during the pandemic – we were among the first hit and our recovery started late, towards October-November 2020. In the second wave, we did not impose a nation-wide lockdown, but daily infections at over 400,000 were at that time the highest in the world and it clearly moderated the recovery that was underway till then. Consequently, policy support for a sustained and inclusive recovery may be needed for longer. In particular, the choice of policy mix will need careful consideration and sensitivity as it is expected that employment may weigh on the recovery, with people having lost incomes and jobs, and those that have jobs have lost purchasing power. Already, hiring prospects are brightening ahead of the festivals, with entry level hiring growing at the fastest pace. The IT sector is the leader in terms of the intent to hire, followed by education services, healthcare and pharmaceuticals. India will need policies that channel these energies to regain the demographic dividend. We can do it - recent outlook upgrades cite India’s strong fundamentals, the receding risks of a negative feedback between the real economy and the financial system, high capital cushions and ample liquidity. The time is right for setting India on a new trajectory of sustainable and inclusive growth. After all, October marks the ending and beginning of things, a symphony of permanence and change.
Annex 1: Quarterly Employment Survey (Contd.) The Ministry of Labour and Employment on September 27. 2021 released the Quarterly Employment Survey (QES) report on organised sector employment. The scope of the QES is limited to establishments employing 10 or more persons (Organised Segment) as identified by the Sixth Economic Census (2013-14) and covers nine sectors which account for 85 per cent of employment in the organised sector. Between 2013-14 and 2020-21, organised sector employment increased by 29 per cent, i.e., at an annual average of 4.1 per cent, with the maximum increase occurring in the Information Technology-Business Process Outsourcing sector (Chart 1). Only two sectors, viz., accommodation and restaurants, and trade, witnessed a decline in employment during this period. The manufacturing sector accounts for 40.6 per cent of employment in the organised sector. However, many labour-intensive sectors like trade and construction have low shares in organised sector employment. A comparison with the Periodic Labour Force Survey (PLFS) Report 2018-1931, which provides employment at household level reveals this divergence in sectoral shares, as in the latter, trade and construction have a higher share in employment reflecting the large informal labour force that these sectors employ. 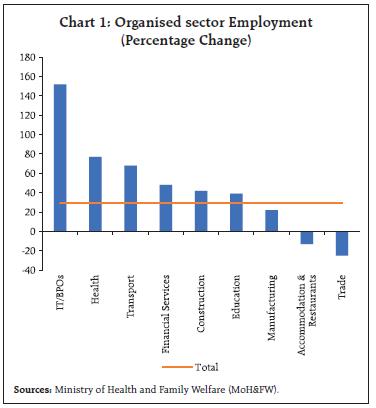 The QES survey also provides information on the loss of employment and wages during the nation-wide lockdown under the first wave of Covid-19. With the exception of health and financial services, operation of all sectors was affected, with only 34 per cent of units operational during March 25, 2020 to June 30, 2020. However, in the case of wage loss, the impact on the organised sector was soft as 80.7 per cent of employees received full wages and only 2.7 per cent went without wages (Chart 3). Within the organised sector, construction faced the major brunt with employment loss of 13.2 per cent and only 66 per cent getting full wages.
|
|