Renewable Energy (RE) has played a pivotal role in India’s transition to a power surplus country. Empirical evidences suggest that sustained fall in generation costs for RE sources are already exerting downward pressures on electricity tariffs in the spot and wholesale markets. This article examines India’s current electricity market structure and identifies several impediments that prevent efficient price discovery and thereby promote resource misallocation. It argues that India’s impressive progress on the generation of RE in recent years and the potential promise of RE in contributing to a greener and low-cost economy in the medium-run warrants strategic policy changes, focusing on curbing cross-subsidisation, speedier resolution of stress facing DISCOMs, promotion of decentralised production and distribution and creating an environment for innovations and adoption of green technology. Introduction A silent revolution in India’s Renewable Energy (RE) sector has played a pivotal role in India’s transition from a power deficit country to a power surplus one in the past few years, exerting significant influence on the dynamics that determine electricity tariffs in the country. According to Ministry of Power, the share of REs in overall installed capacity has more than tripled from 11.8 per cent at end-March 2015 to 37.9 per cent at end-August 2021. The fall in the cost of generation of RE has helped raise its competitive advantage relative to other energy sources. Even without subsidy, the generation cost of REs has become cheaper than thermal and conventional sources (NITI AAYOG and RMI, 2020). According to International Renewable Energy Agency (IRENA), RE generation technologies have become the least-cost option for new capacity addition in almost all parts of the world ((IRENA), 2020). In India, the lowest realised auction price for solar has been ₹2.43 per unit and ₹2.44 per unit for wind energy in the last five years. The cost of solar power is expected to fall further and stabilise around ₹1.9 per unit by 2030 (TERI and CPI, 2019). The falling cost of RE and spot price of electricity has posed a viability challenge for long-term price contracts agreed between thermal plants and distribution companies (DISCOMs) under the Power Purchase Agreements (PPAs) scheme. The average electricity price in auctions of renewable energy has been lower than the PPAs of thermal plants by around 30 per cent during 2016-18 (Agarwal, Gulati, & Thangzason, 2019). There are several affirmative macroeconomic implications of this silent revolution, which include promoting sustainable development by mitigating environmental hazards caused by conventional energy sources, conserving foreign exchange by reducing the amount of imported coal used for generating thermal electricity, reducing electricity tariffs for consumers while improving power availability, and creating space for the fiscal policy through a reduction in subsidies towards LPG and electricity. This article, however, focuses on only one dimension of the revolution, i.e., to examine the impact of renewable energy on energy market dynamics and its potential in increasing power consumption in India. The article is divided into 7 sections including this introduction. Section 2 presents the structure of the electricity market in India, followed by electricity price dynamics in section 3. Section 4 looks into the impact of renewable energy on electricity prices. Section 5 provides an inter-country comparison of electricity consumption and analyses the potential of renewable energy in increasing electricity consumption in India. Section 6 explores the structural issues in the electricity market, followed by a conclusion in Section 7. II. Structure of Electricity Market in India Electricity, a subject in the concurrent list of the Indian Constitution, is guided by the Electricity Act, 2003. The Act sets out the contours of the electricity market in India. Besides generation, transmission, wheeling and retail sale of electricity, tariff regulations and determination of tariffs are guided by the Electricity Act 20031. The code for tariff determination of the central power sector utilities is framed by the Central Electricity Regulatory Commission (CERC). In states and private utilities, it is the respective State Electricity Regulatory Commissions (SERCs). Accordingly, the Indian electricity market is divided into two broad segments, i.e., wholesale and retail. The wholesales market is the primary market where transactions happen between primary power suppliers, i.e., power generators, distribution companies, load dispatch centres and wholesale electricity traders2. A broad microstructure of the wholesale electricity market is provided in Figure 1. The wholesale market comprises power producers, distribution companies and bulk consumers. It could be further classified in terms of the tenure of contracts (Figure 2). Contracts with a maturity of 7 years and above are considered long-term procurement contracts. Those with the maturity of more than one year but less than seven years are deemed medium-term procurement contracts. On the other hand, contracts with a life span of less than a year are defined as short-term. Tariffs for long-term and medium-term contracts are decided by bidding-based power purchase agreements (PPAs). These PPAs are generally signed before the commencement of generation activity. Long-term tariffs don’t change on day to day basis. Contrary to this, the short-term wholesale market operates through power exchanges and bilateral trades. In these markets, price discovery happens on a real-time basis based on prevailing demand-supply conditions. The short-term wholesale market plays a vital role by clearing short-term demand-supply mismatches involving different stakeholders. 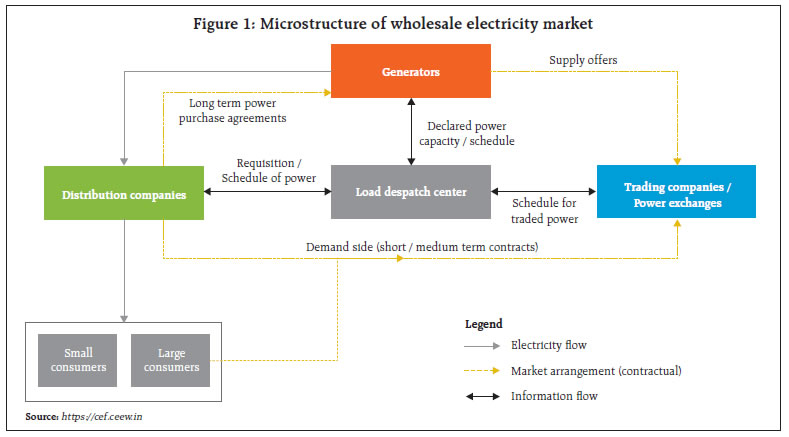 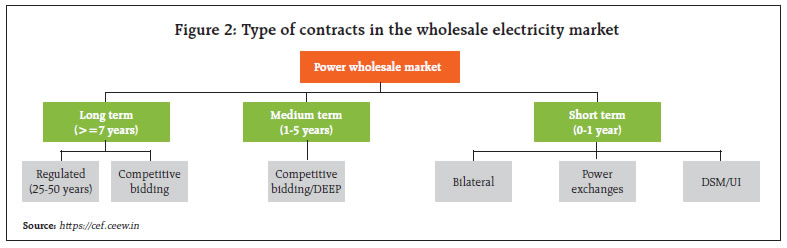 The bulk of the wholesale market, around 90 per cent, is long-term in nature. On the other hand, only about 10 per cent of power generation is traded in the short-term market (Table 1). The short-term market comprises of (a) electricity traded under bilateral transactions through Inter-State Trading Licensees (only inter-state trades), (b) electricity traded directly by the Distribution Licensees (also referred to as Distribution Companies or DISCOMs), (c) electricity traded through Power Exchanges (the Indian Energy Exchange Ltd (IEX) and Power Exchange India Ltd (PXIL)), and (d) electricity transacted through Deviation Settlement Mechanism (DSM). | Table 1: Volume of Short-term Transactions of Electricity concerning Total Electricity Generation, 2009-10 to 2018-19 | | Financial year | The volume of Short-term Transactions of Electricity (Billion Unit) | Total Electricity Generation (Billion Unit) | Volume of Short-term Transactions of Electricity as per cent of Total Electricity Generation | | 2009-10 | 66 | 768 | 9 | | 2010-11 | 82 | 811 | 10 | | 2011-12 | 95 | 877 | 11 | | 2012-13 | 99 | 912 | 11 | | 2013-14 | 105 | 967 | 11 | | 2014-15 | 99 | 1049 | 9 | | 2015-16 | 115 | 1108 | 10 | | 2016-17 | 119 | 1158 | 10 | | 2017-18 | 128 | 1203 | 11 | | 2018-19 | 145 | 1245 | 12 | | 2019-20 | 137 | 1391 | 10 | Note: 1 unit = 1000 Watts
Source: The Central Electricity Regulatory Commission. | The retail electricity market comprises power distribution companies and end-user consumers of electricity, other than those who procure power from the open-access market. The retail electricity market structure is akin to a near-monopoly in India as respective regulators determine retail electricity tariffs through tariff orders on a cost-plus basis. Most electricity is purchased under long-term power purchase agreements by distribution companies; therefore, the end-users of electricity are also tied through long-term contracts. DISCOMs who must supply electricity to their consumers mainly rely on supplies through these long-term contracts. As per the national tariff policy 2016, the Regulatory Authorities take the overall cost incurred by DISCOMs, including procuring power through these contracts, into account while finalising tariff orders. Therefore, the tariff structure should be conducive to the overall development and sustainability of the electricity industry. As per policy, tariff decisions should also be conducive to the development of the renewable energy industry. With renewable prices coming down drastically over the past few years, it can bring down retail tariffs in the future. Very few studies, however, have looked at the impact of renewable energy on electricity prices. One primary reason for this can be attributed to the high share of thermal energy in the electricity basket, which accounted for 60.4 per cent of total installed capacity in August 2021. Further, the existence of cross-subsidy in the highly regulated multi-slab electricity market prevents efficient market-based pricing. Nonetheless, since 2008 initiatives are being taken towards market-based price discovery by developing the short-term market. Agarwal, Gulati, & Thangzason (2019) pointed out the positive impact of renewable energy prices in bringing down spot prices significantly downward. International experience also suggests that renewable energy replaces conventional energy and reduces electricity prices in Germany and Denmark (Rintamäki, 2013). III: Electricity Price Dynamics and Inflation Electricity prices in India reflect the impact of cross-subsidisation, because of which agriculture and domestic consumers pay relatively lower prices vis-à-vis industries and commercial users (Chart 1). This differential tariff structure is visible across states. In general, industrial and commercial users consume around one-third of total electricity but account for about 55 per cent of the total power bill. The retail tariff charged to end-users over the recent period is depicted in Chart 2. The average price of electricity per unit sold during the last five years increased by 5.1 per cent, while fees paid by industry and households increased by 7.2 per cent and 6.6 per cent, respectively. On the other hand, tariffs charged for use in agriculture saw a decline of 2.6 per cent during this period (Chart 2). It can be seen that industrial and commercial users pay around double the tariff charged to domestic users. It may be noted that while determining tariff and the procurement cost of power, the accumulated losses of distribution companies are also considered. Predictably, this has contributed to the gradual and sustained rise in power tariff, which is reflected for all classes of consumers except agriculture (Chart 2). While calculating Wholesale Price Index (WPI) and Consumer Price Index (CPI) for electricity, their underlying nuances are ignored. Both indices differ in terms of the type of prices samples used for estimation. The electricity prices reported in the wholesale price index (WPI) is arrived at by taking the All India Average rate of sale of power based on data collected from various power utilities (central, state, and private sector) by the Central Electricity Authority (CEA). This is different from the earlier practice of treating multiple items based on usage in various sectors such as agriculture, industry, domestic, commercial, and railways. Hence, the WPI electricity inflation moves very closely with average sale prices of power generating stations which historically includes mostly thermal power (Chart 3). The consumer price index (CPI), on the other hand, considers electricity tariffs paid by individual consumers and hence does not include prices paid by industries and commercial establishments. An assessment of inflation in electricity tariffs measured in terms of CPI shows that it has generally hovered below the 4 per cent inflation target set for All India CPI while also witnessing a temporary phase of deflation (Chart 3). Even when CPI inflation remains low, electricity inflation faced by industrial and commercial establishments can be high. This can be brought down only if the cost of electricity generation comes down and is passed on to all types of consumers, which requires settling the business right by the power distribution companies.  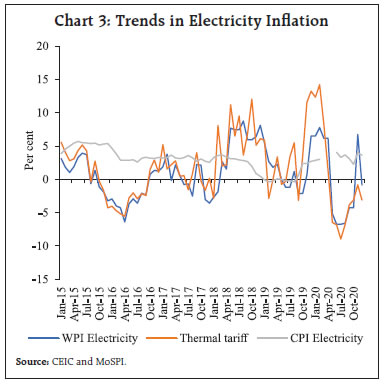 To empirically estimate the effect of electricity tariff on inflation, in particular, assess the impact of falling RE auction prices on inflation, a variant of the Autoregressive Distributed lag model (Pesaran 1999 and 2001) was employed, dictated by the presence of different orders of integration – I(0) and I(1). It uses monthly WPI and CPI electricity as dependent variables covering 83 months from February 2014 to December 2020. The same set of regressors were regressed with two dependent variables separately; namely, WPI termed Model I to assess the relationship between electricity tariff and producer price and CPI, termed Model II to evaluate the relationship between electricity tariff and consumer price (Table 3). The regressors were (i) capacity weighted average monthly realised auction price from 72 conventional power plants regulated by Central Electricity Authority (CEA)3, (ii) monthly series of realised auction prices of REs – solar, wind and hybrid, covering around 47 plants, interpolated using Catmull-Rom Spline method4 for those months when auction did not take place, and (iii) monthly clearing spot price of electricity in the most significant power exchange of the country - India Energy Exchange (IEX). Since these auction prices – CEA and REs are the outcomes of bidding processes; generally, the lowest bids at floor/forbearance prices which are derived taking into account cost of generation, tariff, project viability and average purchase costs, among others, price recovery at the auction stage is assumed to be efficient. Together the three regressors captured around 85 per cent of the total electricity supply. Hydel power and nuclear power, which have not been included in the study for non-availability of data, together constituted around 15 per cent of the electricity supply. | Table 2: Correlation Matrix | | Variables | RE_ Auction Price | Electricity CPI | CEA Auction Price | Electricity WPI | Energy Exchange Spot Price | | RE_Auction Price | 1.00 | | | | | | | (0.000) | | | | | | Electricity CPI | -0.93 | 1.00 | | | | | | (0.000) | (0.000) | | | | | CEA_Auction Price | -0.52 | 0.60 | 1.00 | | | | | (0.000) | (0.000) | (0.000) | | | | Electricity WPI | -0.26 | 0.38 | 0.49 | 1.00 | | | | (0.019) | (0.001) | (0.000) | (0.000) | | | Energy Exchange Spot Price | -0.03 | -0.09 | 0.06 | 0.24 | 1.00 | | | (0.783) | (0.439) | (0.607) | (0.027) | (0.000) | | Note: Figures in parentheses are p-values | Preliminary investigation using correlation analysis suggests that electricity WPI and CPI are negatively correlated with RE auction price. However, there was marked difference in the magnitude of the correlation coefficient, indicating that the rise in CPI electricity during the period was faster than that of electricity WPI while there has been a secular fall in the price of RE auction prices. The correlation coefficient between electricity CPI and RE auction price was -0.93 as against merely -0.26 between electricity WPI and RE auction price. The CEA conventional energy auction price positively correlates with both WPI and CPI electricity (Table 2; Chart 4: a-b). The results for ARDL regression under Model I suggest that there exists robust statistical evidence of positive relation between producer price of electricity (WPI) and auction prices for conventional power, RE energy and spot price of energy exchange. The WPI electricity inflation has been persistent, as indicated by the significance of own lag up to two months. Among the cotemporaneous factors, conventional energy auction price was the most dominant affecting WPI. The impact of RE auction and spot market prices on WPI have so far been small but with the desired sign indicating that that as their share in the energy mix rise, the falling prices in these segments would impart further moderating impact on overall power generation cost (Table 3 and Annex I). 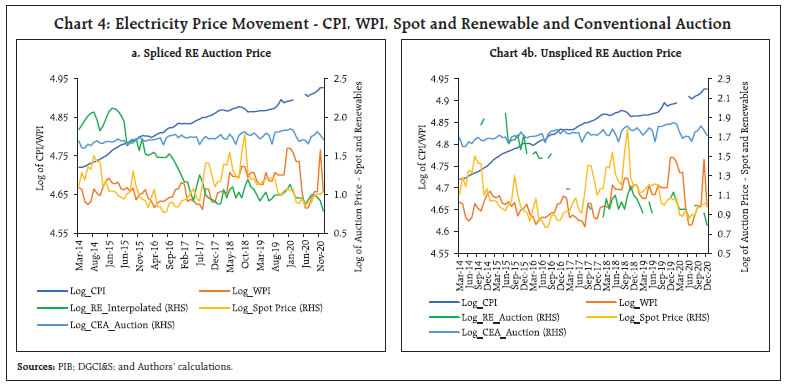 On the contrary, Model II result for CPI did not suggest meaningful relationships with the same set of regressors. None of the regressor - RE auction price, conventional energy auction price and energy exchange spot price, exhibit a statistically significant association with CPI electricity. This observation was on expected line given the stark contrast seen in the preliminary correlation matrix between electricity CPI and WPI vis-à-vis the three regressors. This indicates that the falling price of RE energy and exchange spot price have no moderating impact on the price paid for electricity by household consumers. It is plausible to assume that the myriad of interventions and regulations as regards retail power tariffs over and above the policy of inter-sectoral cross-subsidisation; and the exclusion of all other segments of electricity consumption barring household consumption in CPI electricity may have bearings on this observation (Table 3). Table 3: Empirical Results – Autoregressive Distributed Lag (ARDL) Framework
(Period: February 2014 to December 2020) | | Explanatory Variables | Model I: WPI Electricity as Dependent | Model II: CPI Electricity as Dependent | | Coefficient | t-statistics | p-value | Coefficient | t-statistics | p-value | | log.WPI_Electricity(-1) | 0.33 | 2.73 | 0.00* | - | - | - | | log.WPI_Electricity(-2) | 0.25 | 2.06 | 0.04** | - | - | - | | log.CPI_Electricity(-1) | - | - | - | 0.56 | 3.81 | 0.00* | | log. CPI_Electricity(-2) | - | - | - | 0.41 | 2.73 | 0.00* | | log.Convention_Auc_Price | 0.19 | 2.98 | 0.00* | 0.0007 | 0.36 | 0.72# | | log.Convention_Auc_Price(-1) | 0.21 | 2.93 | 0.00* | - | - | - | | log.Renewable_Auc_Price | 0.02 | 2.31 | 0.02* | -0.002 | -32 | 0.75# | | log.Spot_Price(-1) | 0.03 | 2.34 | 0.02* | -0.007 | 1.764 | 0.21# | | Constant | 1.19 | 3.23 | 0.00* | 0.15 | 0.81 | 0.42# | Diagnostics
R2= 0.65; SEE = 0.02; f-stats = 23.39(p: f-stats=0.00); D-W= 1.90
*: 1% level of significance; **: 5% level of significance; | Diagnostics
R2 = 0.98; SEE = 0.006; f-stats = 1273.5(p: f-stats=0.00); D-W=2.03
*: 1% level of significance; #: Insignificant | Where,
log.WPI_Electricity : Adjusted log of monthly WPI Index for electricity
log.CPI_Electricity : Adjusted log of monthly CPI Index for electricity
log.Convention_Auc_price : Adjusted log of monthly weighted auction price for conventional energy from 75 plants
log.Renewables_Auc_price : Adjusted log of monthly auction price for renewable energy
Spot_Price : Adjusted log of monthly average spot price of electricity volume cleared in IEX | Further exploration into the relationship between the dependent variables and the regressors point to the existence of a long-run co-integrating relation in Model I (WPI). The subsequent error correction model (ECM) suggests that, WPI has been impacted by its lag and auction prices for conventional power, the net impact being 42 per cent of any deviation in WPI from average getting corrected the next month as suggested by (-) 0.42 coefficient for the co-integrating term (Table 4 and Annex I). | Table 4: Error Correction Model | | Explanatory Variables | Dependent Variable: WPI Electricity | | Coefficient | t-statistics | p-value | | CointEq | -0.42 | -6.51 | 0.00* | | D(log.WPI_Electricity(-1)) | -0.25 | -2.23 | 0.02* | | D(log.Convention_Auc_Price) | 0.19 | 3.32 | 0.00* | | Constant | 1.19 | 6.51 | 0.00* | Diagnostics
R2 = 0.42; SEE = 0.021 f-stats = 19.39(p: f-stats=0.00);
*: 1% level of significance | IV. Renewable Energy and Electricity Prices The growth of REs in the last five years has been unprecedented and have the potential to bring down electricity prices. As high as 66.6 per cent of the incremental addition to installed capacity in India during the last five years was from RE sources (Chart 5). The installed capacity of RE has doubled over the previous five years, from 38.8 GW in 2015-16 to 86.8 GW in 2019-20. More than 80.0 per cent is solar and wind-based (83 per cent 2019-20). In contrast, the installed capacity of conventional energy, of which thermal has a share of 70 per cent, took eleven years to double from 143.9 GW in 2009-10 to 283.3 GW in 2019-20. 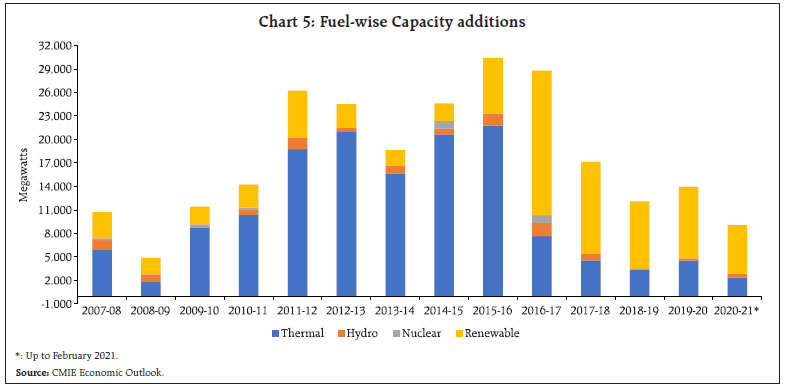 The Government of India (GoI) has set a target of 175 GW installed capacity by 2022 for renewable electricity generation. National Electricity Plan, 2018 estimates the capacity to increase to 275 GW by 2027, leading the renewable share to 44 per cent in installed capacity and 24 per cent in electricity generation. As of December 2020, grid-connected renewable electricity capacity reached 93 GW, with 84 per cent coming from solar and wind power. Around 72 per cent of this capacity has been created by the private sector (Chart 6). Globally also, the renewable sector has emerged as a significant source of electricity generation supported by cost-reducing technological developments. According to the International Renewable Energy Agency (IRENA), the global weighted-average levelised cost of electricity (LCOE) of utility-scale solar photovoltaics (PV) fell 82 per cent between 2010 and 2019 while that of concentrating solar power (CSP) fell 47 per cent, onshore wind 39 per cent and offshore wind 29 per cent (Chart 7). As a result, renewable power generation technologies have become the least-cost option for new capacity in almost all parts of the world (IRENA), 2020). The global weighted-average total installed cost of projects commissioned in 2019 fell below the USD 1000/kW mark for the first time (Chart 8). India leads the world in having the lowest weighted-average total installed costs of USD 618/kW in 2019. Along with the significant decline in generation cost, power production is increasingly getting decentralised, especially in the European countries that are at the forefront of adopting renewable energy. For example, more than 1.5 million households in Germany generate electricity, either for self-consumption or to supply to the central grid. More than 180 bioenergy villages have taken responsibility for their own electricity generation in the nation’s rural areas. Similarly, in cities, energy and housing associations are installing PV panels on multi-unit buildings, making them self-reliant on electricity. 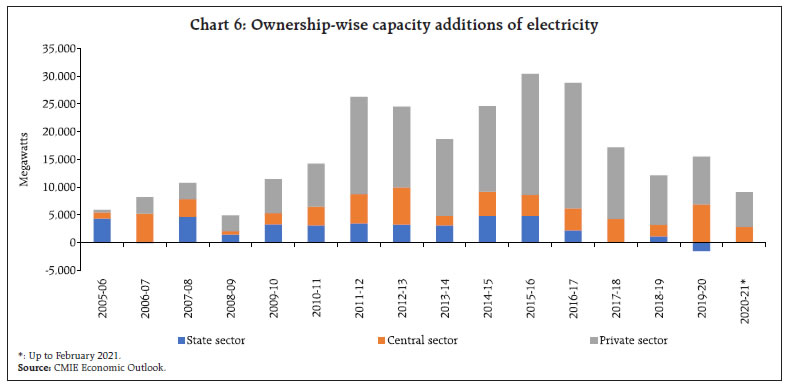 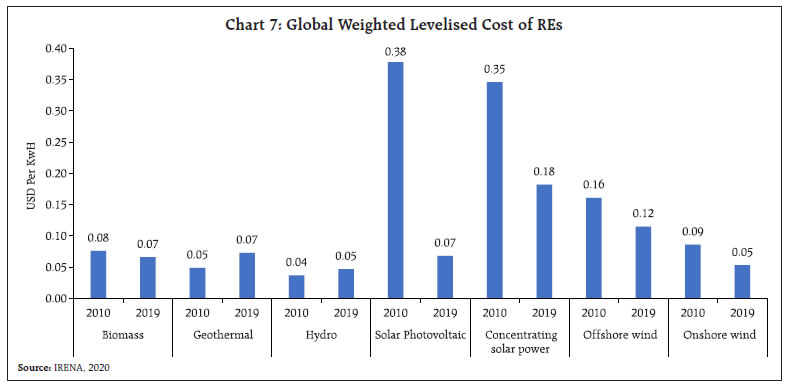 With technological advancements, wind and solar have become the cheapest sources of new electricity in India (Chart 9). By contrast, coal tariffs are projected to increase because of rising transport and capital costs. High storage costs of renewables - a significant deterrent in adopting renewables - are also projected to decline dramatically, which could be transformational for integrating RE into the grid along with the untapped potential for consumption. By 2030, wind and solar power costs are projected to be between 2.3-2.6 ₹/kWh and 1.9 – 2.3 ₹/kWh, respectively, while the cost of storage is expected to fall by about 70 per cent (TERI, 2020). 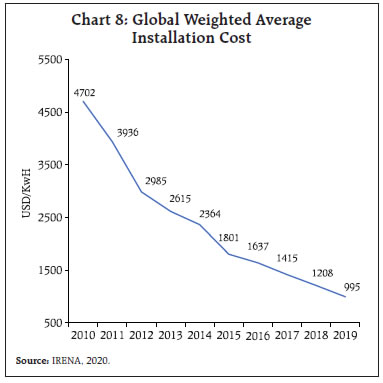 Several policy measures have supported the RE sector in India. These include renewable purchase obligation (RPO) for DISCOMs, Renewable Energy Certificates (REC), accelerated depreciation of renewable energy assets for commercial and industrial users, and the must-run status which exempts it from the merit order principle and mandates the scheduling and dispatch of renewable power (IEA, 2020). The RPOs mandate DISCOMs, Open Access Consumers and Captive Power Producers to obtain 21 per cent of their electricity from renewable sources by 2022 - 10.5 per cent from solar and the rest from non-solar renewable sources. RECs were introduced to help obligated entities to meet their RPO obligations, and trading was allowed in 2011. Further, to attract investment in RE, competitive auctions were started for solar PV in 2010 and wind in 2017 for long term power purchase agreements with a fixed cost. 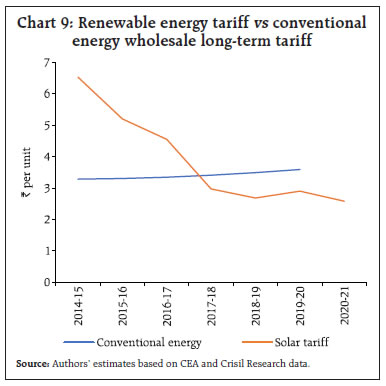 A major policy initiative that accelerated the use of RE is the introduction of Open Access under the Electricity Act, 2003. Corporate Renewable Power Purchase Agreements allowed corporate buyers to purchase RE from power producers (developers, independent power producer investors) at a pre-agreed price for a pre-agreed period. Indian corporates have been increasingly depending on this route mainly due to lower costs and meeting decarbonisation targets. Waivers on open access charges given by various state Governments like Karnataka, Andhra Pradesh and Telangana during 2017-18 helped increase RE utilisation through open access. From the policy support, India became the second-largest growth market for corporate PPAs after the United States in 2018 and 2019 WBCSD (2019). The recent Green Term Ahead Market (GTAM) initiative is expected to further incentivise the Renewable Energy Market. V. Potential Energy Demand While renewable energy is increasingly proving as the best alternative to conventional energy sources, its potential to revolutionise the world depends on the extent of utilisation. According to IEA data, renewables accounted for 13.8 per cent of the world energy supply in 2018, a modest increase from 12.8 per cent in 1990. Their share increased from 18.8 per cent to 23.4 per cent during the same period in electricity generation. Oil and coal continue to be the major players in the energy market. However, the technological changes in recent times have given an edge to electricity over other energy types. These advancements are increasingly providing renewables with a better opportunity for shifting the energy balance towards them. Accordingly, the potential of renewables has to be seen in the larger framework of energy balances, even though its share is modest now. Set against these global trends, we analyse next the overall energy demand scenario for the Indian economy. The energy demand correlates with economic growth as energy is a significant input in production (Yıldırım, Sukruoglu, & Aslan, 2014). On average, per capita energy consumption was higher for countries having high per capita income (Chart 10). Many studies have shown bi-directional relation between the two variables, while others have pointed towards the causality running from energy to economic growth (Zhang & Xin, 2011; David & Enflob, 2013). Similar results were found in the case of electricity demand and GDP. In the Indian context, bi-directional causality between energy demand and economic growth was significant (Ohlan, 2016). 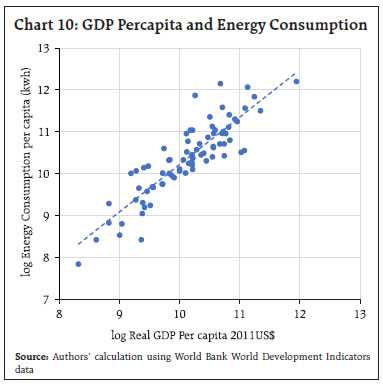 In 2019, India was the third-largest producer and consumer of electricity after China and the USA5 and recorded a steady rise in per capita electricity consumption on an annual basis (Chart 11). The compound annual growth rate of per capita electricity consumption increased by 4.1 per cent during the 2012-19 period. However, India’s per capita electricity consumption at 804.5 kwh in 2014 (1181 kwh in 2018- 19 as per the Ministry of Power) is much lower than the world average of 3132.8 kwh6. Rising urbanisation and industrialisation are expected to boost electricity demand that needs to be met through sustainable sources. The electricity consumption of India is expected to grow further, and as per the International Energy Agency, electricity demand in India will almost triple between 2018 and 2040. 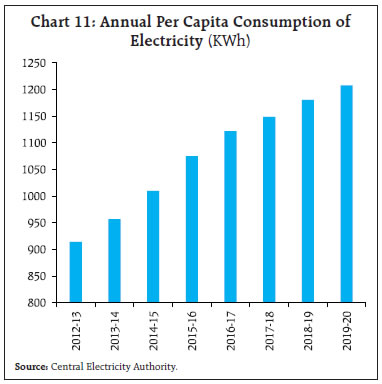 The Energy demand during the last decade was met primarily through conventional sources, i.e., fossil fuel. The share of fossil fuel was around 93 per cent in 2010, which declined moderately to 92 per cent in 2018. Renewable energy’s share was minuscule in 2018 at 3.4 per cent, despite recording a robust annual growth of 17.3 per cent on a low base of 2010. During this period, energy demand emanated evenly from the transport, industry, and buildings sector. According to British Petroleum (BP), the energy demand of the Indian economy in the near to medium term will rise at a higher pace vis-à-vis the global economy and comparable peer economies. BP has made its predictions under two scenarios, i.e., a rapid rise in renewable energy capacity and business as usual. Under the rapid increase scenario, the share of renewables is expected to rise rapidly from less than four per cent in 2018 to around 10 per cent in 2025 and further to 40 per cent in 2040. Compared to this, in the business as usual scenario, the share of renewables is projected to be around 5.5 per cent in 2025 and 15.5 per cent in 2040. In the business as usual scenario, the reliance of the Indian economy will continue to be high on fossil fuel and imported fuel, entailing higher energy risk for the Indian economy (Table 5). India’s potential in harnessing renewable energy is immense (Table 6). Based on the availability of land and solar radiation assessment, the potential solar power in the country has been estimated to be around 750 GW. Further, there is significant potential from decentralised distributed applications to meet the hot water requirement for residential, commercial, and industrial sectors through solar energy and meet cooking energy needs in rural areas through biogas. Renewable energy also has the potential to usher in universal access to power. The wind is an intermittent and site-specific source of energy, and therefore, an extensive Wind Resource Assessment is essential for selecting potential sites. Through the National Institute of Wind Energy (NIWE), the Government has installed over 800 wind-monitoring stations all over the country and issued possible wind maps at 50 meters, 80 meters, 100 meters and 120 meters above the ground level. The latest assessment indicates a gross wind power potential of 302.25 GW and 695.50 GW in the country at 100 meters and 120 meters above ground level. Most of this potential exists in seven windy states. | Table 5: Energy Consumption Scenario for India (energy in exajoules) | | | Growth | Rapid scenario | Business-as-usual scenario | | 2010 | 2018 | 2010-2018 CAGR (%) | 2025 | 2040 | 2018-2040 CAGR (%) | 2025 | 2040 | 2018-2040 CAGR (%) | | Consumption | | | | | | | | | | | Total | 23 | 34 | 5.2 | 44 | 65 | 3.1 | 44 | 71 | 3.4 | | Fuels | | | | | | | | | | | Oil | 7 | 10 | 5.0 | 11 | 12 | 0.8 | 11 | 16 | 2.3 | | Natural gas+ | 2 | 2 | -0.2 | 4 | 11 | 7.7 | 3 | 6 | 5.3 | | Coal | 12 | 19 | 5.7 | 22 | 12 | -2.2 | 25 | 33 | 2.6 | | Nuclear | 0 | 0 | 6.0 | 1 | 3 | 9.9 | 1 | 2 | 8.1 | | Hydro | 1 | 1 | 2.6 | 2 | 2 | 3.0 | 2 | 2 | 2.5 | | Renewables* | 0 | 1 | 17.3 | 4 | 26 | 15.3 | 2 | 11 | 10.7 | | Sectors^ | | | | | | | | | | | Transport | 3 | 5 | 5.5 | 6 | 10 | 3.6 | 6 | 10 | 3.6 | | Industry | 12 | 17 | 4.7 | 22 | 34 | 3.2 | 22 | 36 | 3.4 | | Non-combusted | 1 | 2 | 5.6 | 3 | 4 | 2.4 | 3 | 4 | 3.0 | | Buildings | 6 | 10 | 5.7 | 13 | 18 | 2.7 | 14 | 21 | 3.4 | ^: Includes electricity and hydrogen; and their associated conversion losses.
*: Renewables include wind, solar, geothermal, biomass, biomethane and biofuels.
+: Natural gas does not include biomethane.
Source: Energy Outlook 2020, British Petroleum. |
| Table 6: Estimates of Potential of Renewable Energy in India | | Source | Potential in GW | | Solar | 750.0 | | Wind | 695.5@ | | Bio-energy | 25.0 | | Small Hydro Potential$ | 20.0 | | Total | 1490.5 | @: Wind Power Potential at 120 mtr agl (GW). Wind Power Potential at 100 mtr agl is around 302.25 GW.
$: < projects less than 25 MW capacity.
Source: Annual Report 2019-20, MNRE. | A peculiarity of renewable sources of energy is their dependence on location and geographical suitability. Due to this, the assessed renewable energy sources are concentrated in a few states with adequate sun-light, waste and fallow land and windy areas (Table 7). Around 81 per cent of potential renewable energy capacity is located in these states. | Table 7: State-wise Estimates of Potential for Solar and Wind Energy | | States | Solar | Wind (Wind Power Potential at 120 mtr agl (GW)) | | Andhra Pradesh | 38.44 | 74.90 | | Gujarat | 35.77 | 142.56 | | Karnataka | | 124.15 | | Madhya Pradesh | 61.66 | 15.40 | | Maharashtra | 64.32 | 98.21 | | Rajasthan | 142.31 | 127.75 | | Tamil Nadu | 17.67 | 68.75 | | Jammu and Kashmir | 111.05 | | | Uttar Pradesh | 22.83 | | | Himachal Pradesh | 33.84 | | | Odisha | 25.78 | | | Sub-total | 553.67 | 651.72 | | Total | 748.98 | 695.50 | | Source: Annual Report 2019-20, MNRE. | With rising electricity demand, the cost of power becomes paramount for long-term sustainability. It may be noted that electricity expense is a critical component of any firm’s total expenditure. Higher electricity cost adds to the overall sale price of goods and services produced in an economy, affecting price competitiveness. Comparing electricity prices for businesses across select major economies reveals that electricity prices in India are significantly higher than those in peer economies. It is even more evident when comparing with our key export competitors, viz., Bangladesh, ASEAN economies and China (Table 8). In this context, renewable energy could play an essential role by providing electricity at a lower price. VI. Challenges and Structural Issues As the role of RE sources is expected to increase progressively, DISCOMs signing new PPAs will need to recognise the scope for more significant disruptions ahead8. A related challenge would be managing variability or uncertainty of RE. Unlike fossil fuel-based electricity that can be generated steadily, renewable sources like wind and solar cannot be generated on demand. According to the NITI AAYOG Expert Group, meeting the installed capacity of RE would not be as much a financial challenge as a technical one. In this regard, the success of the ongoing project on nationwide Grid integration has become a sine qua non to managing the transition non-disruptively. A related issue has been the rising demand for solar modules, mostly met through imports. Therefore, enhancing the domestic manufacturing capacity of solar panels in line with the AATMANIRBHAR BHARAT Scheme is paramount. In RE, financing costs account for the most significant component – between 50 and 65 per cent – of the prevailing RE tariffs in India, which is even higher in other developing countries where the risk premium is higher. While policy interventions in the form of renewable purchase obligations (RPO) for DISCOMs, accelerated depreciation benefits (ADB), and must-run status (MRS) have served the sector well, judicious implementation of additional incentives such as viability gap funding and interest rate subvention, generation-based incentive, longer tenure debt, back-load RE tariff, can provide further impetus to RE development. The implementation of these intervention policies, however, have been not without problems. As per the Indian Electricity Act, 2003, RPO mandates that all electricity distribution licensees purchase or produce a minimum specified quantity of their requirements from RE sources or renewable energy certificates (RECs) from the National Load Dispatch Centre. However, enforcing RPO targets has remained a challenge, with most states and UTs achieving more diminutive than their respective RPOs. As regards the ADB scheme, there exists scope for improvement by linking disbursals of benefits with the performance of projects over a longer timeframe, i.e., bank guarantees in place of availing AD, which can be released year on year subject to minimum account or outright change to Production Tax Credits (in Rs./kWh) which may or may not be transferable. Likewise, under the MRS, RE plants cannot be subjected to curtailment on merit order despatch or any other commercial consideration, i.e., RE plant has to supply electricity to the grid under all conditions. This status was accorded to the RE sector in 2010. There have been instances of DISCOMs delaying payments and unplugging generating capacity from the grid called backing-down due to poor financial status to even going back on their PPA commitments with solar and wind power producers. These issues will have to be addressed and resolved for RE sources to expand and scale up. Solar power has achieved grid parity in recent auctions. Among other benefits, this was because the land was made available from the state governments, and the bids were based on long-term power purchase agreements backed by state government guarantees. Reforming the retail distribution of electricity holds the key to the country’s long-term energy security and sustainability. While reducing commercial, technical and transmission losses remains a continuing challenge, to date, the market pricing of tariffs has been the biggest challenge to the power sector. Cross subsidy from industry to other sources of demand and direct subsidies to specific segments have been widely deployed. The result has been the poor performance of the overall electricity sector. The future health of the power sector hinges on closing the gap between the average cost of supply (ACS) and average revenue realised (ARR). As late as 2018-19, the annual ARR was as low as ₹5.6 per unit against ₹6.1 per unit incurred on ACS annually, still a deficit of 8.2 per cent compared with the deficit of 16.0 per cent when the gap peaked in 2012-13. The aggregate technical and commercial (AT&C) loss or the deadweight loss - the percentage of power procured by the distribution company for which it did not receive any payment was as high as 22 per cent in 2018-19. This contrasts with the experience of advanced economies viz., UK and US, where AT&C losses are about 6-7 per cent. Higher losses keep the entire energy sector under duress. The electricity sector has a complex cross-subsidisation scheme under which high energy-consuming costumers from industry and commercial sectors subsidise consumption by smaller consumers in agriculture and domestic sectors. However, cross-subsidisation alone would not be sufficient to meet all financial needs of the distribution sector. State governments provide direct subsidies to agriculture and domestic consumers in the form of lower tariffs. Over the years, support for the electricity sector has increased very rapidly. Power subsidies were four times higher than petroleum subsidies in 2018-19 compared to less than half in 2013-14. The sharp rise in subsidy is keeping the whole distribution system inefficient (Chart 12: a, b and c and Table 9). 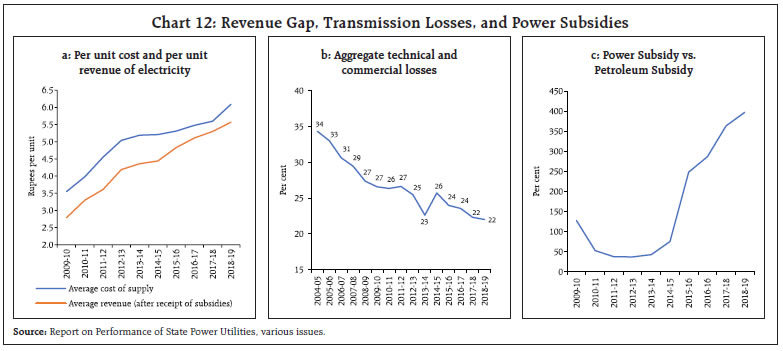
| Table 9: Power subsidy and petroleum products subsidies | | Financial year | Subsidy (₹ crore) | Ratio with GDP (%) | | Power | Petroleum | Power | Petroleum | | 2009-10 | 19,074 | 14951 | 0.30 | 0.23 | | 2010-11 | 20,334 | 38371 | 0.27 | 0.50 | | 2011-12 | 25,771 | 68484 | 0.29 | 0.78 | | 2012-13 | 36,089 | 96880 | 0.36 | 0.97 | | 2013-14 | 36,758 | 85378 | 0.33 | 0.76 | | 2014-15 | 45,584 | 60269 | 0.37 | 0.48 | | 2015-16 | 74,515 | 29999 | 0.54 | 0.22 | | 2016-16 | 78,938 | 27539 | 0.51 | 0.18 | | 2017-18 | 88,919 | 24460 | 0.52 | 0.14 | | 2018-19 | 98,653 | 24837 | 0.52 | 0.13 | | Source: PFC and Union Budget. | VII. Conclusion and Way Forward India’s commitment to the International Solar Alliance and the re-entry of the USA to Paris Accord have given a renewed vigour to the adoption of REs in the country’s strategic plans for the energy sector in the medium-term. The changing electricity price dynamics under the marginal but rising influence of REs can contribute to a greener and low-cost economy going ahead. Estimates suggest that even without the policy support that the sector enjoys, it can be commercially viable. There are evidences that the lower generation cost of RE sources are exerting downward pressure in the spot and wholesale markets for electricity though the same is yet to be witnessed in the retail market for electricity. Competitive tariff structure and targeted steps to minimise transmission and distribution losses and also limiting cross-subsidisation could promote efficient price discovery and attract higher RE investment. A clean, affordable and sustainable energy supply should drive future growth. Besides environmental benefits, countries that manage to transition effectively to RE sources will be home to competitive energy solutions and making firms more resilient to energy shocks and weather disruptions. References WBCSD (2019). PPAs in India: Market & Policy Update. World Business Council for Sustainable Development. Agarwal, R., Gulati, S., & Thangzason, S. (2019). Renewable Energy and Electricity Price Dynamics in India. Reserve Bank of India, Monthly Bulletin, 25-34. David, I., & Enflob, K. (2013). Causality between energy and output in the long-run. Energy Economics, 135- 146. IEA. (2020). India 2020: Energy Policy Review. International Energy Agency. IRENA. (2020). Renewable Power Generation Costs in 2019. Abu Dhabi: International Renewable Energy Agency. IRENA. (2019). Renewable Power Generation Costs in 2019. Abu Dhabi: International Renewable Energy Agency. NITI AAYOG and RMI (2020): Towards a Clean Energy Economy - Post COVID-19 Opportunities for India’s Energy and Mobility Sectors, NITI AAYOG and Rocky Mountain Institute Report. Ohlan, R. (2016). Renewable and nonrenewable energy consumption and economic growth in India. Energy Sources, Part B: Economics, Planning, and Policy, 1050-1054. Pesaran, M. and Shin, Y. (1999), An Autoregressive Distributed Lag Modeling Approach to Cointegration Analysis, in S. Strom, (Ed.) Econometrics and Economic Theory in the 20th Century: The Ragnar Frisch centennial Symposium, Cambridge University Press, Cambridge. Pesaran, M.H., Shin, Y. and Smith, R.J. (2001), Bounds testing approaches to the analysis of level relationship, Journal of Applied Economics, 16, 289-326. Rintamäki, T. (2013, February). Impact of renewable energy on electricity prices -comparative analysis of Denmark and Germany. Finland: Aalto University, School of Science. TERI and CPI (2019), Accelerating India’s Transition to Renewables: Results from the ETC India Project, The Energy and Resources Institute and Climate Policy Initiative Report. Yıldırım, E., Sukruoglu, D., & Aslan, A. (2014). Energy consumption and economic growth in the next 11 countries:The bootstrapped autoregressive metric causality approach. Energy Economics, 14-21. Zhang, Z., & Xin, R. (2011). Causal Relationships between Energy Consumption and Economic Growth. Energy Procedia, 2065-2071.
Annex: Renewable Energy: The Silent Revolution - ARDL and ECM The unit root test for seasonally adjusted naturalised log of the variables using Augmented Dickey Fuller (ADF) suggest the presence of unit root in three of the series i.e., I(1), namely, CPI, RE auction price and spot price while WPI and conventional energy auction price did not have unit root at levels i.e., I(0) – thus the choice for Autoregressive Distributed Lag (ARDL) framework. At first difference with two period lag, none of the series has unit root. Appropriate lag length of 1(one) was chosen based on Akaike Information Criteria (AIC) (Annex Table 1). The period of the study being from February 2014 to December 2020. The same regression was run twice – one with WPI and the other with CPI as the dependent variable, with the same set of regressors, namely, conventional energy auction price, RE auction price and spot price, termed as Model I and Model II. As already discussed, this was done with the purposed to separately analyse the impact of RE auction price on producer price and consumer price. The moderating impact, statistically significant, of RE auction price on WPI was along expected line. CPI electricity has no statistically meaningful relation with the regressors indicative of price distortions at retail level. | Annex Table 1: ADF Test of Unit Root – Monthly Data Akaike Information Criteria | | Variables | t-statistics without Trend (Level, lag=1) | t-statistics without Trend (First Difference, lag=1) | | log.WPI_Electricity | -3.24* | -10.56* | | log.CPI_Electricity | -—1.19# | -2.008* | | log.Convention_Auc_Price | -3.24* | -10.52* | | log.Renewable_Auc_Price | -0.77# | -7.23* | | log.Spot_Price | -2.14# | -12.43* | | *: 1% level of significance; #: Insignificant | The long-run Bound Tests pointed to the presence of long-run cointegration relation in Model I and none in Model II. The F-statistics and absolute value of t-statistics for Model I were higher than the respective I(1) bound values at all levels of significance for Model I confirming long-run cointegration relation among the variables (Annex Table 2). | Annex Table 2: F and T-Bounds Test Model I | | Null Hypothesis: No levels relationship | | Model I - WPI | Model II - CPI | | Test Statistic | Value | Signif. | I(0) | I(1) | Test Statistic | Value | Signif. | I(0) | I(1) | | F-statistic | 10.19 | 10% | 2.72 | 3.77 | F-statistic | 1.19 | 10% | 2.72 | 3.77 | | k | 3 | 5% | 3.23 | 4.35 | k | 3 | 5% | 3.23 | 4.35 | | | | 2.50% | 3.69 | 4.89 | | | 2.50% | 3.69 | 4.89 | | | | 1% | 4.29 | 5.61 | | | 1% | 4.29 | 5.61 | | t-Bounds Test | Null Hypothesis: No levels relationship | t-Bounds Test | Null Hypothesis: No levels relationship | | Test Statistic | Value | Signif. | I(0) | I(1) | Test Statistic | Value | Signif. | I(0) | I(1) | | t-statistic | -4.93 | 10% | -2.57 | -3.46 | t-statistic | -0.79 | 10% | -2.57 | -3.46 | | | | 5% | -2.86 | -3.78 | | | 5% | -2.86 | -3.78 | | | | 2.50% | -3.13 | -4.05 | | | 2.50% | -3.13 | -4.05 | | | | 1% | -3.43 | -4.37 | | | 1% | 3.43 | -4.37 | Having established the presence of short-run relationship between WPI with its own lag and conventional energy auction price with an adjustment speed of 0.42 using error correction model (ECM), the robustness of the Models was assessed. CUSUM test for both the models suggest that the coefficients were stable within 5 per cent confidence band. Q-statistics test for both the models showed that even up-to 36 months lag, there was no auto-correlation with the p value insignificant throughout laying above p ≥ 0.5. The Breusch-Godfrey Serial Correlation LM Test using F-statistics and Chi-square were insignificant laying above p ≥ 0.5 for both the Models indicting the absence of serial correlation. The variance inflation factor (VIF) of less than 2.5 for Model I and around 5.0 for Model II point to the absence of multicollinearity among the regressors while significant F-statistics for joint Wald Test of the coefficients for both the Models conforms the observed relationship in the regression, particularly, that between WPI and CPI vis-à-vis RE auction prices during the period under consideration.
|