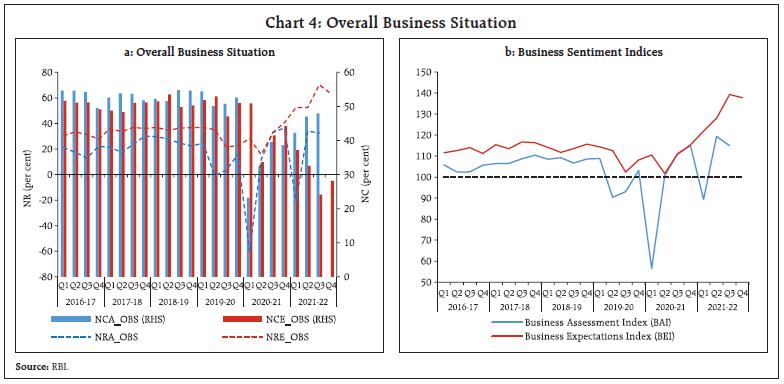
This article lists the key findings of the industrial outlook survey (IOS) for the manufacturing sector conducted during 2019-21. The sentiments of the respondents reflected that the slowdown in growth momentum was mainly due to weakening of demand for three consecutive years beginning 2017-18. Just when the manufacturers’ outlook started looking up, the COVID-19-induced lockdown measures slowed down the revival process. The pandemic affected the producers’ sentiments negatively by bringing down the survey parameters to historic lows. While the impact of the second wave has been less pronounced than the first one, and various macro parameters related to manufacturing sector may soon attain their pre-COVID levels, the process of attaining their long-term trend levels may take some time. Introduction In early 2020, the COVID-19 pandemic spread with alarming speed infecting millions and bringing economic activity to a near-standstill. The economic damage became evident and turned out to be the largest economic shock the world has experienced in decades. This posed tough challenges to policymakers. As the forward-looking surveys play a major role in supporting policy decisions, these were used by majority of the central banks to capture the sentiments of enterprises. The surveys helped to gauge the impact of the pandemic as well as to assess the timing and pace of the expected recovery process as perceived by the enterprises. The Industrial Outlook Survey (IOS) conducted by the Reserve Bank plays an important role in supporting monetary policy decision. Being a forward-looking survey, IOS captures the sentiments of enterprises engaged in manufacturing activities. The perception includes the assessment of the current quarter and expectations for next quarter. In the wake of coronavirus outbreak in early 2020, along with other sectors, the manufacturing industries also got impacted adversely. After coping with the first wave, the economy showed some signs of recovery from Q3:2020-21. Although the second wave of the pandemic again worsened the economic conditions, the manufacturing sector quickly regained traction. Though the economic activities were impacted by sudden surge of omicron variant of the pandemic in end-December 2021, the impact is likely to be much lower. Against this backdrop, the present article aims to extract the stylised facts emanating from various rounds of survey conducted since 2019. At the same time, the outlook on the recovery process as perceived by the manufacturers are also presented in this article. During this period, total 11 rounds of the survey were conducted by the Reserve Bank i.e., round 86 (April-June 2019) to round 96 (October-December 2021). This article also attempts to formulate a recovery path of major macroeconomic variables, namely Index of Industrial Production (IIP) and Gross Value Added (GVA), for the manufacturing sector using an analytical framework under specific assumed scenarios based on the information available from survey outlook. The rest of the article is presented in four sections. In Section II, the underlying sentiments of the manufacturing units are presented. Section III focuses on the expected recovery process after the pandemic shock, as perceived by the manufacturers. Section IV attempts to study the pandemic impact on the macro variables as well as the subsequent recovery using an analytical framework and Section V concludes with some policy implications. II: Stylised Facts 2019-21 II.1 Sample Frame, Survey Questionnaire and Survey Methodology The survey questionnaire1 is canvassed to a panel of manufacturing companies which undergoes periodic revision with addition of new companies and removal of closed/merged companies. The survey seeks qualitative responses from the senior management personnel or finance heads of manufacturing units. The questionnaire is structured in five blocks covering general information about the respondent companies; product details in order of sales; information on the size of few performance indicators; and assessment for current quarter and expectations for the next quarter. Owing to uncertainty on account of lockdown and restrictions imposed because of COVID-19 pandemic, an additional block was included since April-June 2020 quarter to capture expectations for two and three quarters ahead to get an outlook of the enterprises on the expected recovery process. The responses are collected on a three-point scale i.e., increase, no change and decrease and are converted into single quantitative measure viz., net response (NR)2 for summarising the survey results. By construction, NR can take a value between -100 to +100 where a negative value represents contraction/pessimism and a positive NR signifies growth/optimism. II.2 Key findings during 2019-21 The survey results are presented in terms of assessment (A) and expectations (E) of the companies on ‘demand conditions’, ‘financing conditions’, ‘price situation’ and ‘overall business situation’. In this article, the net responses (NR) for assessment quarter is termed as assessment NR (NRA) and the NR for expectations quarter is described as expectations NR (NRE). a. Demand conditions The sentiments on demand conditions, as captured through production (PR), order book (OB), capacity utilisation (CU), inventory of raw materials (IRM), exports (EXP), imports (IMP) and employment (EMP), deteriorated in early 2019-20. The assessment NRs were low in Q2:2019-20 and Q3:2019-20 as compared to previous quarters. However, there were some signs of improvement in Q4:2019-20 as demand started firming up. The resolution of the Monetary Policy Committee in March 2020 also mentioned that pick up in manufacturing in January 2020 pulled the industrial production in positive territory after contraction over the past five months. But the COVID-induced lockdown impacted the economic activity adversely and brought down the NRs to a historic low in Q1:2020-21. With the easing of lockdown in a phased manner, a pickup in demand was seen, which was indicated through an upward movement in survey parameters. The sentiments of manufacturers started improving after a sharp decline in Q1:2020-21. But the demand condition again deteriorated in Q1:2021-22 due to second wave of the pandemic, but it triggered a comparatively lower reduction in production which, in fact, quickly reversed in Q2:2021-22. Both the NRs on production for assessment quarter (NRA_PR) and expectations quarter (NRE_PR) broadly tracked the quarter-over-quarter (q-o-q) movement of index of industrial production in manufacturing (IIPM) during the period under study. However, the NRA_PR reflects the severity of COVID related lockdown better than NRE_PR, as the manufacturers could not anticipate the collapse in demand due to the sudden onset of the first and second wave of the pandemic (Chart 1a). The proportion of no change (NC) in responses as measured by NCA_PR and NCE_ PR, which was at around 50 per cent throughout the study period, witnessed a sharp deterioration during pandemic. The perception of the manufacturers on production is also reflected by other demand parameters covered in this survey, e.g. order book, both in terms of assessment (NRA_OB) and expectations (NRE_OB) (Chart 1b). Although the assessment NR reached below (-) 50 per cent due to sudden lockdown in Q1:2020-21, the impact was much less in second wave. However, the expectations NR remained in positive zone throughout the period under study. 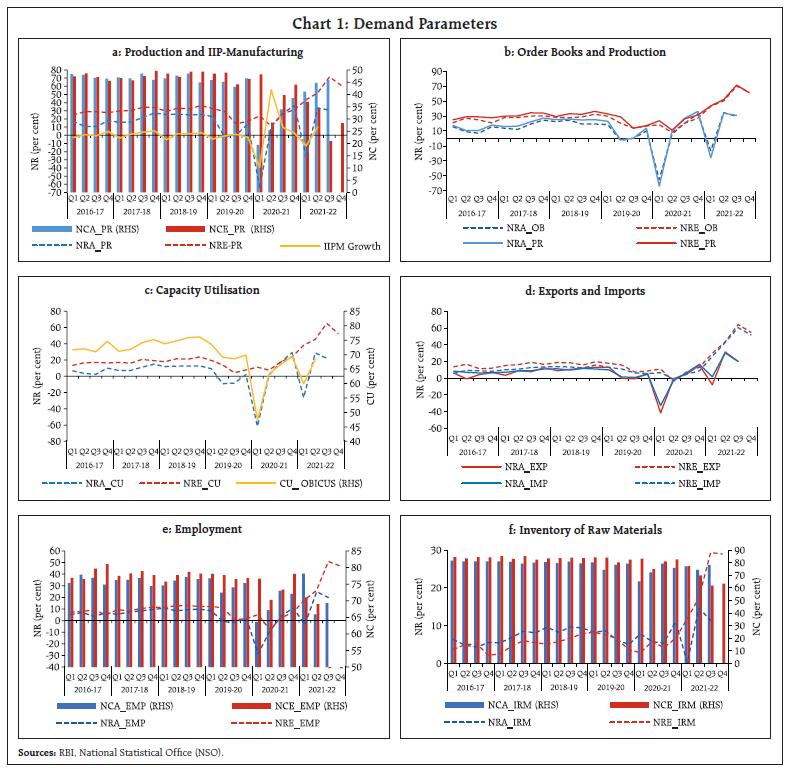 An alternate demand parameter canvased in IOS is the capacity utilisation (CU) which is defined as the proportion of the actual capacity utilised by a manufacturing company to its installed capacity. The assessment and expectations NR for CU (NRA_CU and NRE_CU respectively), as captured in IOS, provided an early indication in the movement of CU which was later estimated based on another survey conducted by the Reserve Bank viz., order books, inventories and capacity utilisation survey (OBICUS)3 which collects the actual quantitative information on manufacturing CU. The NRA-CU tracked the actual CU (CU_OBICUS) better even during COVID-19 period when the economy experienced an unprecedented demand shock (Chart 1c). After witnessing a sharp fall in Q1:2020-21, respondents’ sentiments on exports and imports started recovering, which again dropped in Q1:2021-22 during second wave of the pandemic. It is also evident that, with the strengthening of demand conditions, the expectations on exports and imports improved significantly since the second half of the year 2020-21. The proportion of respondents indicating no change (both NCA_EMP and NCE_EMP) usually dominate the responses on the slow-moving employment parameter.4 Although the job landscape started recovering in Q4:2019-20 after gradual decline in past one year, it collapsed in Q1:2020-21 due to pandemic. The optimism started firming up in subsequent quarters with abated effect of the pandemic (Chart 1e) but witnessed another shock during the second wave. IRM is considered another slow-moving demand parameter as companies target to maintain a fixed level of IRM except when large changes are anticipated in demand or price. The responses on IRM are dominated by NC which remained around 80 per cent throughout the period under study, but sentiments were adversely impacted by the pandemic in past one and a half year (Chart 1f). b. Financing Conditions Sound financing conditions give impetus to companies to strengthen their businesses. The respondents expressed positive sentiments on overall financial situation (OFS) in pre-COVID period except Q2:2019-20. Sentiments for Q3:2019-20 were also positive but very low. Although the manufacturers’ sentiments dipped in Q1:2020-21, it was boosted immediately by several relief measures announced by the government to revive the business environment (Chart 2a). However, the second wave again clouded the sentiments of manufacturers. The cost of external finance (CoF) started showing some respite since 2019-20 signifying better avenues for the manufacturers to run their businesses (Chart 2b) which started edging up again since Q4:2020-21. c. Price Situation The price situation is assessed based on parameters like cost of raw materials (CRM), salary outgo and selling prices (SP) of enterprises as collected in IOS. It is important to evaluate how the demand conditions coupled with financial situation are factored into the business for deciding the profitability of the companies under the prevailing input cost pressure and market uncertainty. The CRM, which captures the movement in WPI inflation of industrial raw materials5, remained an abiding concern for the manufacturers through Q1:2018-19 and softened thereafter. Yet, the cost again spiked up in Q2:2020-21 due to supply chain disruption and transportation delays (Chart 3a). As a result, the selling price also started hardening since Q2:2020-21 passing the input cost pressure to the consumers (Chart 3b). Although the selling price moved in tandem with the WPI inflation in manufactured products (weight: 64.2 per cent) during the entire period under study, the unprecedented supply shock impacted the survey sentiments much more than was actually reflected in the movement in the wholesale inflation in early 2020-21. The outlook on profit margins6 (NRE_PM) remained passive since Q3:2019-20 on the back of persistent input cost pressures, which turned positive in Q1:2021-22 (Chart 3c). d. Overall Business Situation The NC response for overall business situation (OBS), which remained around 50 per cent till 2019-20, reduced substantially in 2020-21 as the perception changed due to the pandemic as indicated by 60 per cent negative sentiments in NR in Q1:2020-21. The opinion started firming up in subsequent quarters which again turned passive during the second wave in Q1:2021-22 (Chart 4a). Based on the NRs calculated for various survey parameters, a composite index is calculated separately for business assessment (BAI) and expectations (BEI)7. The BAI remained in contraction zone in Q2 and Q3 of 2019-20 as slowdown in economy was observed in most of the demand parameters. The summary index started improving and entered in expansion zone in Q4:2019-20. However, the COVID-related lockdown pushed the BAI to the historically lowest value in Q1:2020-21 at 56.5 per cent (second lowest being in Q4:2008-09 during global financial crisis (GFC) as 82.6 per cent). The BEI also declined notably in Q2:2020-21 although remained in expansion zone. However, both BAI and BEI improved immediately in Q3:2020-21 and strengthened further in subsequent quarters. Though, in the wake of the second wave, the BAI contracted again in Q1:2021-22, it promptly recovered in the next quarter. BEI continued to expand (Chart 4b). 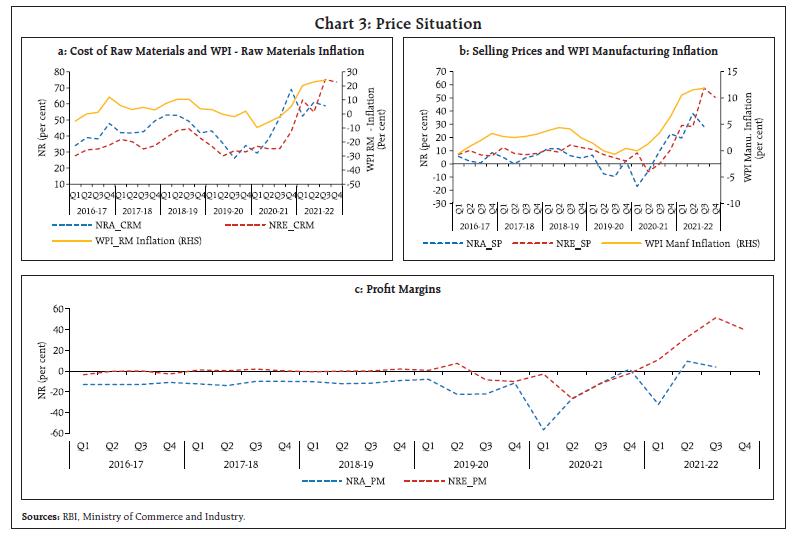
 III: Perception of Manufacturers on Post-COVID Recovery Process As most of the economies worldwide were impacted severely by the outbreak of COVID-19, majority of the central banks felt it critical to study its effect and the expected recovery process thereafter, on the response pattern of the outlook surveys conducted by them. III.1 Cross-Country Experiences As the forward-looking surveys play an important role to support policy decisions, major economies8 used these surveys as instruments to capture the outlook of the enterprises on the COVID-19 impact. Adhoc survey conducted by the Federal Reserve Bank of New York during March 2 to 10, 2020 with only a few specific questions indicated downbeat sentiments of the manufacturing as well as services firms. The March round of the Empire State Manufacturing Survey, conducted by Federal Reserve Bank of New York, indicated declined business activity in New York State. Further, the optimism about the six-month outlook also fell sharply, with firms less optimistic than they had been since 2009. To capture the impact more specifically, supplemental questions were included in the Empire State Manufacturing Survey and Business Leaders Survey of March 2020 which were focused on observed effects of the novel corona virus on various aspects of business. To understand the COVID-19 impact and expected recovery path, the Kansas City FED included specific relevant questions in their monthly surveys on manufacturing in 2020. The Bank of Canada, as part of their business outlook surveys in 2020, also had consultations with a small, targeted sample of Canadian businesses and associations to better understand the economic impacts and the post-pandemic recovery. The monthly Manufacturing Business Outlook Survey of FED Reserve Philadelphia, in its October 2020 survey round, asked special questions on current capacity utilisation rates compared with the same time last year. Manufacturers were also asked about the impact of economic policy uncertainty and the effects of COVID-19 on their total capital spending plans for next year. Special questions about firms’ current capacity utilisation reflected sizable impact of the pandemic, where most of the firms reported to operate at significantly lower levels of capacity than a year ago. III.2 The Indian Context As the usual surveys were conducted much before the lockdown was imposed, the respondents did not anticipate the contraction in advance as they could not foresee the full impact of the severe and sudden nature of the pandemic which was witnessed later9. Therefore, in the Q4:2019-20, when COVID-19 cases started increasing in India, a quick survey10 was conducted on a few critical parameters during March 18-20, 2020. The quick survey indicated severe pessimistic sentiments. Further, in addition, to capture future expectations through the usual questionnaire, a block was introduced since Q1:2020-21 for assessing the business outlook of the corporate sector on critical parameters for two more subsequent quarters. The survey results indicated initial persistence in the sentiments of the companies, which generally remain optimistic about the future. They chose to wait and watch before changing their outlook. But as the adverse situation prolonged, the sentiments were significantly affected. All such additional information was useful for taking policy decisions during the highly uncertain times. The survey results of the additional block were also disseminated by the Reserve Bank in its quarterly data releases since April 2020. Including two additional quarters, a total of three expectations quarters were covered in the survey rounds11 since 2020-21. Therefore, for certain common quarters, expectations are captured through different survey rounds. The parameters covered in the additional block include PR, OB, CU and employment from demand side, CRM and SP on price dynamics and the OBS. Demand Conditions With various stimulus packages and measures announced by the Government and the Reserve Bank, the manufacturers’ business confidence somewhat recovered. Though the expectations started firming up after the first wave, sentiments were again clouded due to the second wave, though it reverted quickly (Charts 5a and 5b)12. Similar patterns were observed for CU and employment (Charts 5c and 5d). The job landscape started improving, but at a slower pace due to social distancing at the factory level and owing to transportation issues, but improved in the latest survey rounds reflecting confidence over vaccination drive.
Price Situation13 The input cost pressures intensified over the quarters, as expected by the manufacturers. Following the slow recovery in demand, the manufacturers passed on the cost pressure to the consumers leading to an increase in SP. Respondents expected input cost pressures to continue and SP to harden gradually (Chart 6). Overall Business Situation Manufacturers were seen to be optimistic about the future as was reflected from their expectations. Although they were less optimistic in 90th round about the future due to the initial impact of the first wave of the pandemic, the confidence recovered with proactive policy supports. The measures taken by the government to create better opportunities for the enterprises to run their businesses led to higher business optimism as reflected in the survey results (Chart 7). III.3 Challenges faced by the Manufacturers during COVID period The comments/suggestions received from the manufacturers reflected distress in their business in April-June 2020 round of survey (R90) as most of the factories were closed. Manufacturers of essential commodities also faced challenges due to shortage of raw materials, supply chain disruptions and transportation delays. As consumers were purchasing only essential commodities, higher inventory of finished goods became a worry for manufacturers. Sentiments improved over subsequent survey rounds, but companies reported unavailability of raw materials, working capital requirement along with labour shortage as major constraints. Although the moratorium announced by the Reserve Bank brought some respite to the manufacturers, their optimism was again clouded by the second wave which hampered their repayment capacity. They also sought express vaccinations so that the firms could run at full capacity. Although the lack of domestic and overseas demand, the economic uncertainty, and higher input cost were the major concerns, manufacturers are seen to be optimistic about restoring their businesses to the pre-pandemic level in near future with prompt sector-specific relief provided by the government, proactive monetary policy measures by the Reserve Bank and rapid vaccinations. IV: Outlook on the Recovery In this section, an attempt has been made to estimate the post-COVID recovery based on the survey sentiments. A longer time series covering 20 years’ span has been considered for analysis from Q1:2000-01 onwards. This article focused on the demand parameters captured in IOS (mainly NRA_PR and BAI) and the related macroeconomic series. It is observed that NRA_PR and BAI have a strong contemporaneous relationship with Y-o-Y growth in IIPM (IIPMyoy) and that in GVA manufacturing (GVAMyoy) respectively. However, such correlations of macro variables with the expectations parameters, i.e., NREs and BEI are much lower than that with assessment parameters i.e., NRAs and BAI (Annex Table 1). Moreover, the assessment parameters detect the signals of the macro variables over the expectations parameters more efficiently (Annex Table 2). The NREs are seen to be higher due to lower sentiments of the manufacturers in the current quarter in the pandemic-hit years. However, being available for only one quarter, the assessment is useful to provide prior information only for the current quarter. This is supplemented by the information on expectations for subsequent three quarters, which are especially captured through the survey since round 90. The information on expectations for some more quarters may give a better idea about the expected recovery process perceived by the manufacturers. The first investigation relates to whether COVID-19 has led to a permanent shift in economic activity adopting a new normal or a short-term shock from where the economy will soon recover. The Bai-Perron test for structural break point and subsequent Chow test suggested a structural break in IIPMyoy in 2008-09, but for NRA_PR, BAI and GVAMyoy, the breakpoints are at different time points (Annex Table 3, 4, 5, 6). The evidence of the GFC in 2008 suggests a structural break in IIPMyoy in 2008, as seen from the permanent shift in rolling mean and standard deviation, but a pure shock to the NRA_PR as the series returned to its normal pace after few quarters. Similar difference is visible for GVAMyoy and BAI. Charts 8a to 8d present the respective series along with its rolling14 mean and rolling standard deviation. The above charts suggest that the COVID pandemic impacted the economy more severely than the global financial crisis. Further investigation about the full impact and structural changes due to the COVID-19 episode will be better captured once the economy recovers completely and become stable. Recovery from COVID-19 Shock: A Scenario Analysis An attempt has been made to outline the expected recovery path for IIPM and GVAM based on manufacturer’s outlook collected from the survey. As IOS captures current quarter assessment and subsequent three quarters expectations, it can be used to envisage the macro variables in next one-year horizon. The Hidden Markov Model Regression (HMMR) technique was employed to estimate the recovery path of the macro variables following existing literature (Goldfeld and Quandt, 1973; Hamilton, 1989; Diebold et.al., 1994; Diebold and Rudebusch, 1996; Filardo and Gordon, 1998; Bellone Saint Martin, 2003; Bardaji, 2009; Camacho et.al., 2012; Bernardelli, 2015; Bhowmick and Majumdar, 2020; and Samanta and Bhowmick, 2022). The estimated models are as under: For IIPM, the estimated models are: And similarly for GVAM, the estimated equations are:
where, APR(I) and APR(D) stands for Increase and Decrease in Assessment for Production parameter; EPR(I) and EPR(D) stands for Increase and Decrease in Expectations for Production parameter; and D is a dummy used to take care of the COVID shock. Results for the model estimation are presented in Annex Table 7 and 8. Following the literature, the long-term trends for IIPM and GVAM are calculated by using one-sided Hodrick-Prescott (HP) filter, first for the period Q1:2000-01 to Q4:2018-19 and second being the pre-COVID trend calculated for Q1:2000-01 to Q4:2019-20. Both the trends have been extended under two different scenarios based on quarterly averages of past five years; first scenario following long-term trend, whereas, the second being with slowdown in the economy before 2019-20 but excluding COVID-19 impact as the yardstick. Projections for macro variables in subsequent four quarters (Q3:2021-22 to Q2:2022-23) are estimated using IOS sentiments (Chart 9)15. The results may be viewed as hypothetical constructs with assumptions under different scenarios, not a traditional forecast. The above charts exhibit that, although both IIPM and GVAM reached the pre-COVID trend path in Q4:2020-21, the second wave impacted the recovery process adversely by disrupting the growth momentum. However, both are projected to reach the pre-pandemic trend path in near-term, but likely to take some more time to attain the long-term trend path. V. Conclusion The 11 rounds of IOS conducted during Q1:2019-20 to Q3:2021-22 point to three different phases of the Indian economy. In 2019-20, the survey parameters reflected slowdown in the overall economy in terms of sentiments of the manufacturers. The first and second waves of the pandemic slowed down the economic activity, and the perception of the manufacturers was impacted adversely. The conditions improved with gradual resumption of normalcy. Going forward, this analysis can be further extended to understand the structural changes in macro variables, once the recovery materialises fully. At the same time, although the major macroeconomic variables are supposed to achieve their pre-COVID trend in near-term with improvement in demand conditions, they are expected to take time to return to their long-term trend path. Concurrently, the subsequent waves of the pandemic and the re-imposition of virus containment measures may dampen the manufacturers’ sentiments and slow down the recovery process. However, the accelerated rollout of vaccines, an inclusive growth-oriented Union Budget 2022-23 with fiscal and other reforms and enhanced infrastructure spending and sector-specific support, investment-oriented stimulus under various tranches of Aatma Nirbhar Bharat, easy financial conditions, etc. are expected to provide a strong impetus for revival of the economy and will facilitate regaining of the growth potential over the medium-term. Continued policy support in future may make the recovery smoother and faster. References Bank of Canada (2020), ‘Business Outlook Survey’, Spring, Summer and Autumn issue, https://www.bankofcanada.ca/2020/04/business-outlook-survey. Bhowmick, S. and Majumdar, S. (2020). ‘Sentiments of Indian Manufacturers in 2018-19’, RBI Bulletin, February. Dana E. Goin and Jennifer Ahern (2018). ‘Identification of Spikes in Time Series’, Division of Epidemiology, School of Public Health, University of California, Berkeley, California, January. Federal Reserve Bank of Kansas City (2020), ‘Manufacturing Survey’, February issue, https://www.kansascityfed.org/surveys/manufacturing-survey/202002-tenth-district-manufacturing-activity-increased-modestly-february/. Federal Reserve Bank of Kansas City (2020), ‘Manufacturing Survey’, various monthly survey reports, https://www.kansascityfed.org/research/indicatorsdata/mfg. Federal Reserve Bank of New York (2020) , ‘Business Leaders Survey’, March issue, https://www.newyorkfed.org/medialibrary/media/survey/business_leaders/2020/2020_03blsreport.pdf?la=en. Federal Reserve Bank of New York (2020), ‘Empire State Manufacturing Survey’, various issues https://www.newyorkfed.org/survey/empire/empiresurvey_archives. Federal Reserve Bank of Philadelphia (2020), ‘Manufacturing Business Outlook Survey’, October issue, https://www.philadelphiafed.org/-/media/frbp/assets/surveys-and-data/mbos/2020/bos1020.pdf?la=en. Morten O. Ravn and Harald Uhlig (2002). ‘On Adjusting the Hodrick-Prescott Filter for the Frequency of Observations’, The Review of Economics and Statistics, May 2002, 84(2): 371–380. Piet de Jong; Jeremy Penzer (1998). ‘Diagnosing Shocks in Time Series’, Journal of the American Statistical Association, Vol. 93, No. 442. (Jun., 1998), pp. 796-806. Reserve Bank of India (2020), ‘Industrial Outlook Survey’, April, August, October issues https://www.rbi.org.in/Scripts/PublicationsView.aspx?id=19437/19717/19984. Reserve Bank of India (2020), Monetary policy resolution March 27, 2020, https://www.rbi.org.in/Scripts/BS_PressReleaseDisplay.aspx?prid=49581. Samanta, G. P. and Bhowmick, S. (2022). ‘Quantifying Survey-based Qualitative Responses on Capacity Utilisation-An Analysis for India’, RBI Working Paper No. 05/2022.
Annex | Table 1: Contemporaneous Correlation Between Survey Parameters and Macro Variables | | | NRA_PR | NRE_PR | BAI | BEI | | IIPMyoy | 0.70 | 0.64 | | | | GVAMyoy | | | 0.49 | 0.38 | | Note: Correlation has been calculated excluding the COVID-19 pandemic period |
| Table 2: Signal Detected by Assessment and Expectations Parameters for Macro Variables | | In per cent | NRA_PR/IIPM | NRE_PR/IIPM | BAI/GVAM | BEI/GVAM | | TRUE | 64 | 59 | 52 | 49 | | FALSE | 36 | 41 | 48 | 51 |
| Table 3: Detecting Structural Break in NRA_PR | Break type: Bai-Perron tests of L+1 vs. L sequentially determined breaks
Break: 2012Q2
Selection: Trimming 0.15, , Sig. level 0.05 | | | t-Statistics | Prob | | 2000Q2 - 2012Q1 -- 48 obs | 17.94709 | 0.0000 | | 2012Q2 - 2021Q1 -- 36 obs | 7.031145 | 0.0000 | | Chow Breakpoint Test: 2012Q2 | F-Statistics | Prob | | Null Hypothesis: No breaks at specified breakpoints | 42.89050 | 0.0000 |
| Table 4: Detecting Structural Break in IIPMyoy | Break type: Bai-Perron tests of L+1 vs. L sequentially determined breaks
Break: 2005Q4, 2008Q4
Selection: Trimming 0.15, , Sig. level 0.05 | | | t-Statistics | Prob | | 2000Q2 - 2005Q3 -- 22 obs | 4.787717 | 0.0000 | | 2005Q4 - 2008Q3 -- 12 obs | 8.166848 | 0.0000 | | 2008Q4 - 2020Q4 -- 49 obs | 2.667591 | 0.0000 | | Chow Breakpoint Test: | F-Statistics | Prob | | For 2005Q4: Null Hypothesis: No breaks at specified breakpoints | 0.644799 | 0.4244 | | For 2008Q4: Null Hypothesis: No breaks at specified breakpoints | 20.84616 | 0.0000 |
| Table 5: Detecting Structural Break in BAI | Break type: Bai-Perron tests of L+1 vs. L sequentially determined breaks
Break: 2012Q2
Selection: Trimming 0.15, , Sig. level 0.05 | | | t-Statistics | Prob | | 2000Q2 - 2012Q1 -- 48 obs | 94.34883 | 0.0000 | | 2012Q2 - 2021Q1 -- 36 obs | 73.16671 | 0.0000 | | Chow Breakpoint Test: 2012Q2 | F-Statistics | Prob | | Null Hypothesis: No breaks at specified breakpoints | 40.88216 | 0.0000 |
| Table 6: Detecting Structural Break in GVAMyoy | Break type: Bai-Perron tests of L+1 vs. L sequentially determined breaks
Break: 2017Q2
Selection: Trimming 0.15, , Sig. level 0.05 | | | t-Statistics | Prob | | 2000Q2 - 2017Q1 -- 68 obs | 9.546114 | 0.0000 | | 2017Q2 - 2020Q4 -- 15 obs | 0.465348 | 0.6429 | | Chow Breakpoint Test: 2017Q2 | F-Statistics | Prob | | Null Hypothesis: No breaks at specified breakpoints | 12.39505 | 0.0007 |
| Table 7: Regression Results for HMM | | Equation 1 | Intercept | IIPMyoy (-1) | APR(I) | APR(D) | D | sd | | St1 | -3.269 | 0.932 | 0.062 | 0.006 | 2.046 | 0.734 | | St2 | -3.763 | 0.878 | 0.059 | -0.173 | 10.498 | 2.608 | | Equation 2 | Intercept | IIPMyoy (-1) | NRA_PR | | D | sd | | St1 | -5.774 | 0.904 | 0.042 | | 1.98 | 0.751 | | St2 | -18.256 | 0.869 | 0.113 | | 10.46 | 2.632 | | Equation 3 | Intercept | IIPMyoy (-1) | EPR(I) | EPR(D) | D | sd | | St1 | -8.055 | 0.485 | 0.238 | -0.138 | 3.159 | 1.345 | | St2 | 47.952 | 1.014 | -0.822 | -1.41 | 12.32 | 2.590 | | Equation 4 | Intercept | IIPMyoy (-1) | NRE_PR | | D | sd | | St1 | -4.751 | 0.933 | 0.03 | | 2.202 | 0.827 | | St2 | -23.732 | 0.934 | 0.136 | | 12.114 | 2.695 | | Equation 5 | Intercept | GVAMyoy (-1) | BAI | | D | sd | | St1 | -11.808 | 0.866 | 0.099 | | 2.648 | 0.918 | | St2 | -16.888 | 0.773 | 0.133 | | 8.656 | 2.823 | | Equation 6 | Intercept | GVAMyoy (-1) | BEI | | D | sd | | St1 | -7.417 | 0.946 | 0.049 | | 3.531 | 1.284 | | St2 | -6.534 | 0.848 | 0.014 | | 11.902 | 2.863 |
| Table 8: Transition Probability Matrices for IIPM and GVAM | | IIPM | GVAM | | Equation 1 | to St1 | to St2 | Equation 5 | to St1 | to St2 | | from St1 | 0.823 | 0.177 | from St1 | 0.791 | 0.209 | | from St2 | 0.197 | 0.803 | from St2 | 0.183 | 0.817 | | Equation 2 | to St1 | to St2 | Equation 6 | to St1 | to St2 | | from St1 | 0.823 | 0.177 | from St1 | 0.826 | 0.174 | | from St2 | 0.196 | 0.804 | from St2 | 0.337 | 0.663 | | Equation 3 | to St1 | to St2 | | | from St1 | 0.820 | 0.180 | | from St2 | 0.445 | 0.555 | | Equation 4 | to St1 | to St2 | | from St1 | 0.825 | 0.175 | | from St2 | 0.213 | 0.787 | Note: State 1 is associated with period of lower growth and State 2 denotes period of higher growth.
Initial state probabilities assumed State 1 as certain, i.e., probability=1. |
|