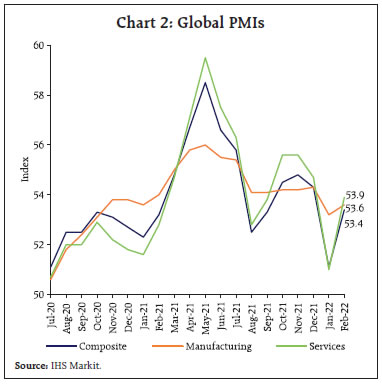
The ongoing geopolitical crisis has heightened the uncertainty clouding the global macroeconomic and financial landscape even as the world economy struggles to recover from the pandemic. As the conflict escalates, oil and other commodity prices are blazing to multi-year highs, and financial markets are on edge, driven by massive sell-offs. Amidst these testing times, the Indian economy is experiencing spillovers as it recovers from the third wave of the pandemic. Consumer and business confidence are rising alongside improvement in demand conditions. On the supply side, a resilient farm sector and a sustained retrieval in both industrial and services sectors are broadening the recovery. Introduction Global economic prospects are suffused with heightened uncertainty and clouded by downside risks from geopolitical conflict, with spillovers reverberating across the world. This is happening at a time when countries are still reeling under the pandemic. The escalation of geopolitical risk, surge in crude oil prices and intensified volatility across global financial markets may smother the embryonic global recovery. This shock has also hit at a time when inflation is elevated in many countries. Moreover, with monetary policy normalisation imminent, global financial conditions could tighten further. At the receiving end are emerging market economies (EMEs), already reeling under currency depreciation, massive sell-offs by foreign portfolio investors and slowing growth. The Indian economy steadied in February 2022 after some moderation of pace in the preceding month when the third wave was at its peak. By March 15, 2022, however, the third wave receded sharply, with the 7-day average of daily infections plunging below 3,500. On the vaccination front, 96.0 per cent of the adult population has been inoculated with the first dose, while 82.3 per cent were administered both doses. Economy gaining traction has helped in rebuilding consumer confidence as reflected in the all-India Centre for Monitoring Indian Economy (CMIE) index of consumer sentiment, which rose to its highest level since the first wave of the pandemic across both urban and rural constituents. Mobility around retail and recreation activity, grocery and pharmacies, parks, workplaces and transit station is above pre-pandemic levels. The job market remained ebullient, with the Naukri JobSpeak index climbing to its highest level in February 2022, with a sharp growth in hiring in insurance and retail sectors. There is a revival in employment in the auto industry after a prolonged period of lull, while hiring across information technology (IT), hospitality and financial services remained robust. In February 2022, revenue collections under the goods and services tax (GST) crossed ₹1.3 lakh crore mark for the second consecutive month. The issuance of e-way bills remained robust. The second advance estimates released by the Ministry of Agriculture and Farmers Welfare placed foodgrains production at a record 316.1 million tonnes. The headline manufacturing purchasing managers’ index (PMI) stayed in expansion zone for 8th consecutive month in February, improving marginally over a month ago with new orders and production recording an acceleration. With improvement in business confidence, the headline services PMI remained in expansionary territory for the seventh consecutive month. February’s merchandise exports surpassed the US$ 30 billion mark for the twelfth consecutive month and the target of US$ 400 billion appears within striking distance. Payments through the digital space surged rapidly. The Reserve Bank launched two key initiatives on March 8, 2022: (i) UPI123Pay which would provide the option to make Unified Payments Interface (UPI) payments for feature phone users; and (ii) DigiSaathi which is a 24x7 helpline to address queries of users across digital payment products. Set against this backdrop, the remainder of the article is structured into four sections. Section II captures the rapidly evolving developments in the global economy. An assessment of domestic macroeconomic conditions is presented in Section III. Section IV reviews financial conditions in India, while the last Section concludes the article. II. Global Setting The global economy is facing formidable headwinds from the conflict in Ukraine. Oil prices had touched multi-year highs, financial markets are on edge, driven by mass buying into the safe haven assets, particularly gold. Amidst such turbulence, the global growth outlook is worsening with intensified inflation and financial instability risks. In the absence of an early solution to the ongoing conflict, the crisis can have adverse implications for the global recovery, necessitating downward revisions of global growth for 2022 and beyond (Chart 1). The global composite PMI for February at 53.4 revived from January’s one-and-a-half year low of 51.1, as growth of new orders and employment accelerated, and business optimism strengthened to a near record high (Chart 2). Both manufacturing and services picked up momentum, with the latter outperforming the former for the tenth time in the past 11 months. Most countries signalled an expansion in economic activity except Japan, which saw output contract at its steepest rate since last August. On March 5, China announced its growth target of about 5.5 per cent for 2022 – the lowest in 30 years – as the growing geo-political tensions add to pressures from property crisis and weak consumption. 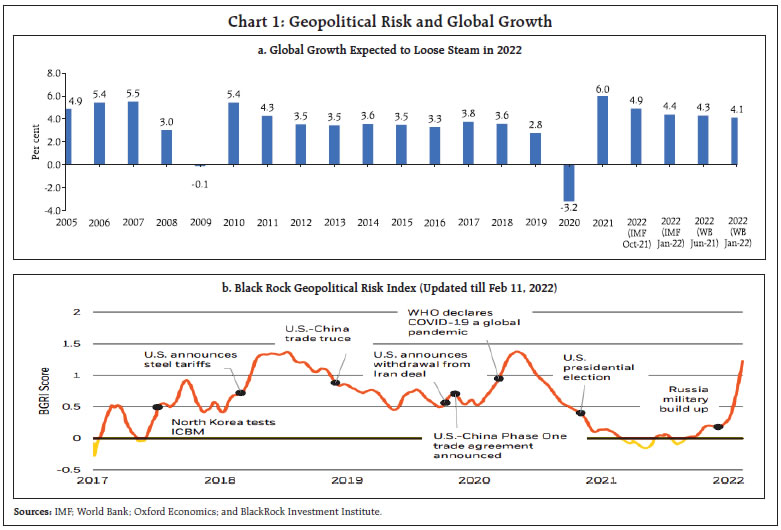
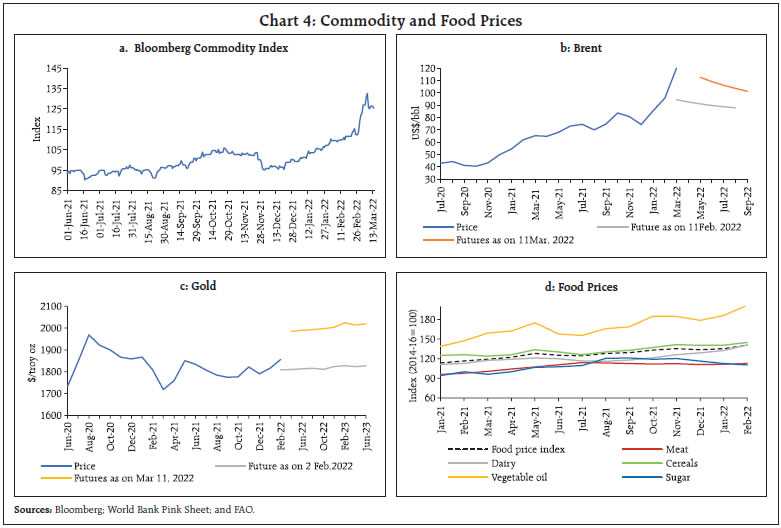
 On the external front, the United Nations Conference on Trade and Development (UNCTAD)’s Global Trade Update 2022 shows that global trade growth accelerated during Q4:2021, while the nowcast indicates that trade growth will slow during Q1:2022. This is corroborated by the monthly data from the CPB World Trade Monitor (Chart 3a). The Baltic Dry Index, a measure of shipping charges for dry bulk commodities, showed an uptick in February 2022 and has continued escalating as geopolitical pressures caused new disruptions, especially Russian and Ukrainian ports in the Black Sea (Chart 3b). The Bloomberg commodity price index continued to surge, reaching a seven-year high in the last week of February by breaching the 120 mark (Chart 4a). Prices of crude, nickel, aluminium and wheat soared on growing supply shortages. With the war propelling risks of outright supply losses and OPEC plus providing no respite by sticking to its monthly supply augmenting plan of July 2021, crude oil prices had skyrocketed to a ten-year high, touching US$118 per barrel in early March (Chart 4b). Safe haven demand has been driving gold prices up since February (Chart 4c). The FAO Food Price Index at 140.7 in February 2022 was 3.9 per cent higher than in January and at an all-time high, largely driven by vegetable oils and dairy sub-indices (Chart 4d). 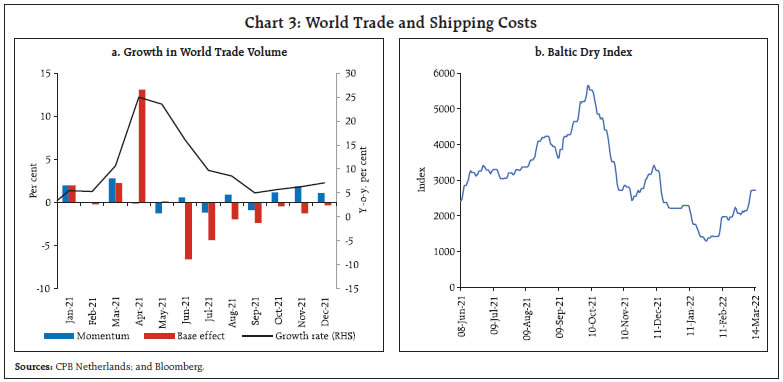
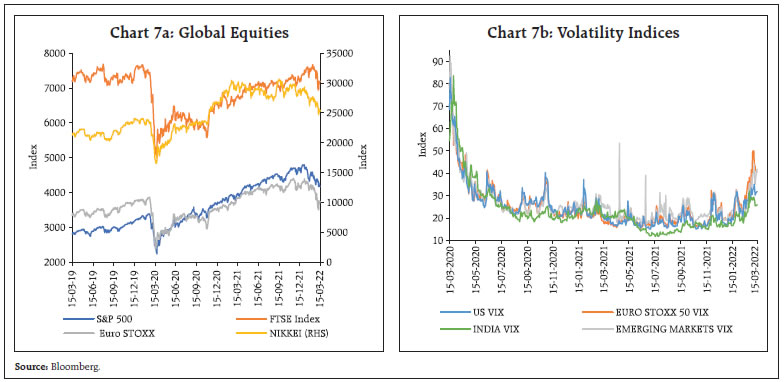
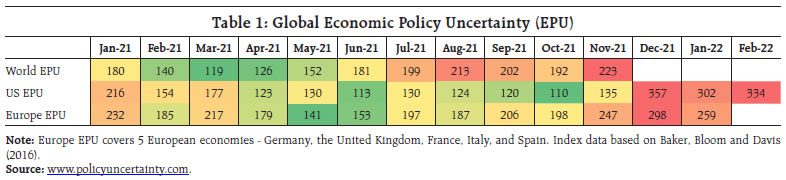
 Inflation continued to rise across economies, with cost push pressures intensifying in the backdrop of clogged supply chain, high energy, food and commodity prices and seeping wage pressures (Chart 5). US CPI inflation rose to a 40-year high of 7.9 per cent in February 2022. Core CPI inflation was also at a near 40-year high of 6.4 per cent in February, with the main contributors being shelter, and used cars and trucks. Wage pressures, as reflected in the fastest annual wage growth of 4.5 per cent for 2021 since 1983, along with surging rental prices have manifested in the personal consumption expenditure (PCE) price index inflation increasing to 6.1 per cent year-on-year in January 2022, the highest in 40 years. Concomitantly, core PCE inflation rose to 5.2 per cent from a year ago, the highest since April 1983. Euro Area inflation edged up further to hit a fresh high of 5.8 per cent in February 2022 due to a steep increase in energy prices, especially that of natural gas. Japan’s inflation moderated in January, primarily on easing housing costs and low mobile charges, remaining below the 2 per cent target. Among BRICS economies, Brazil’s inflation soared to 10.5 per cent while China’s inflation remained stable at 0.9 per cent. On the other hand, Russia’s annual inflation rate accelerated to 9.15 per cent in February 2022, the highest since January 2016, now over twice as high as the central bank’s target of 4 per cent. Inflation risks are tilted to the upside amidst sanctions from the west and raw materials shortages. 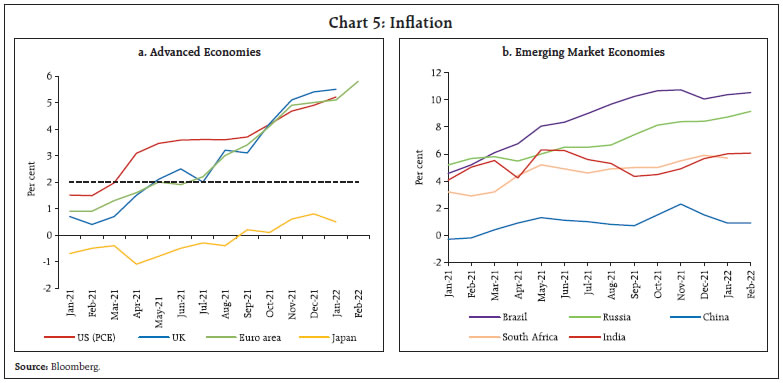 Global financial markets are in a tailspin since the latter half of February due to exacerbated geopolitical tensions worrying investors across the globe. In the last week of February, the MSCI World Equity Index plummeted to levels previously seen in March 2021, driven by fall in both advanced economy (AE) and emerging market economy (EME) stock indices although the latter fell more sharply. The European stock index performed the worst among AEs in February, reflecting the region’s heavy reliance on Russia’s energy supplies while Russian stock indices performed the poorest among EMEs (Chart 6a). Trading has been halted on the Russian stock exchanges since February 28. In the bond markets, the US 10-year treasury yield reversed its uptrend later in the month as demand for treasury securities increased with flights to safety and expectations of aggressive rate hikes moderated post the Fed Chair’s testimony to the Congress in early March (Chart 6b). The US dollar strengthened since the second half of February amidst safe haven demand while EME currencies moved in reverse tandem, barring a few commodity exporters. Notably, the Russian ruble fell to its weakest value ever against the US dollar, depreciating by more than 30 per cent in the last week of February (Chart 6c). Notwithstanding turbulence in global financial market, portfolio capital flows to EMEs are estimated at US$17.6 billion in February 2022 as compared with US$ 8.1 billion in January. According to the Institute of International Finance, foreign investment in emerging market securities (stocks and bonds) outside China languished amidst growing concerns of investors over tighter monetary conditions, geopolitical frictions, and slower recovery in some EMEs from the pandemic (Chart 6d). Also, most EMEs experienced net capital outflows in the first week of March, particularly in the debt segment. Wild swings in global financial markets over the past week have caused the Volatility Index, which peaked around March 2020 at the start of pandemic, to rise even further (Chart 7 and Table 1). Monetary policy actions in February and March so far (up to 14th) were geared towards normalisation or a pause. The Fed has wound up asset purchases and is set for a lift-off in March. The European Central Bank (ECB) has scaled backed its ongoing Asset Purchase Programme (APP) while also announcing the likely conclusion of net purchases under the APP in the third quarter if the medium-term inflation outlook does not weaken. The Reserve Bank of New Zealand and the Bank of Canada raised rates by 25 bps each in February 2022 and March 2022, respectively. Most EME central banks also continued with their policy tightening, including Mexico which hiked its benchmark interest rate by 50 bps in February. On February 28, 2022 in an emergency move, the Bank of Russia increased its key rate by 10.5 percentage points to 20 per cent due to deterioration in the external environment and escalating risks of currency depreciation and high inflation (Chart 8). On the other hand, the People’s Bank of China paused after two consecutive months of easing while the Central Bank of the Republic of Turkey maintained a pause for the second consecutive month. 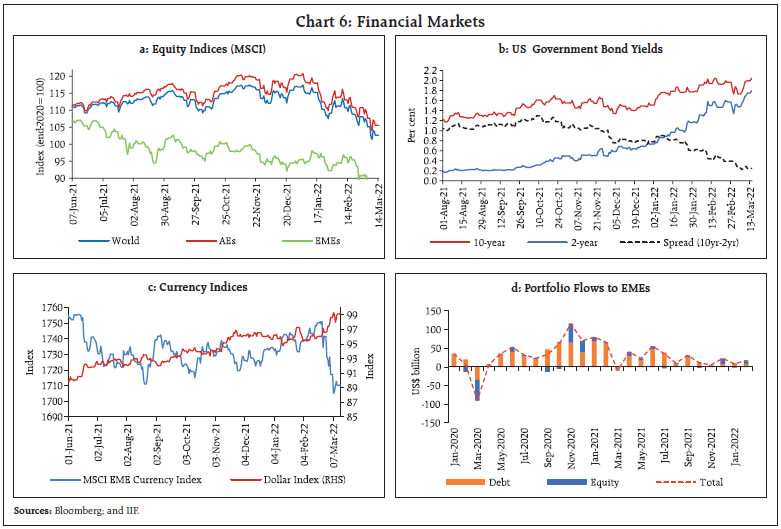
 Central banks across the world face a tough challenge of balancing the curbing of inflation against keeping the recovery on track. With economic outlook mired in heightened uncertainty, risks to EMEs have intensified as external conditions become increasingly less favourable, with capital outflows, global liquidity tightening and a worsening geopolitical environment. III. Domestic Developments With a rapid fall in daily Covid-19 cases − daily infections have plummeted since January 21, 2022 and have declined to below 3,000 on March 15, 2022 from a peak of 3.47 lakh on January 20, 2022 and 82.3 per cent of the adult population and over 3.4 crore children in the 15-18 year age group fully vaccinated, the third wave of the pandemic has ebbed (Chart 9). Restrictions on the movement of people and goods have been lifted at most places. Services sector outlets such as restaurants and cinema halls are gradually resuming normal operations.
Mobility indicators show significant improvement in March 2022 as compared with a year ago (Chart 10a). Apple mobility index was also higher in March (till March 4) (Chart 10b). With the improvement in mobility and opening up of services sector outlets, electricity generation picked up in March, exceeding the levels of the preceding month and also pre-pandemic levels (Chart 10c). As a result, consumer sentiment improved in the majority of states in February 2022 (Chart 11). Aggregate Demand As per the second advance estimates (SAE) of national income released by the National Statistical Office (NSO) on February 28, the Indian economy clocked a growth of 8.9 per cent in 2021-22, a downward revision of 30 basis points from the first advance estimates (FAE). Real GDP in level terms surpassed the pre-pandemic level of 2019-20 by 1.8 per cent. The recovery was broad-based as all constituents of aggregate demand, including private consumption, have recuperated and surpassed their respective pre-pandemic levels.
With regard to components of real GDP, private final consumption expenditure (PFCE) registered a growth of 7.0 per cent during Q3:2021-22. With a slump in construction activity, gross fixed capital formation (GFCF) moderated to 2.0 per cent. Both exports and imports maintained steady momentum to register double-digit growth in Q3:2021-22 (Chart 12). E-way bills generation remained above pre-pandemic levels (Chart 13a). Toll collections also rose in February 2022, despite the waning of base effect (Chart 13b). The resumption in mobility spurred diesel and petrol consumption in February 2022, although a dip in Aviation Turbine Fuel (ATF) dampened total petroleum consumption (Chart 14a). Automobile sales moderated in February, led by a decline in sales of two wheelers, even as wholesale dispatches of passenger vehicles from Original Equipment Manufacturers (OEMs) recorded an uptick (Chart 14b). Dispatches of trucks also improved across all segments, indicating sustained improvement in the transport sector. Price hikes by OEMs to combat input inflation and higher retail fuel prices have increased the cost of ownership of capital equipment. Retail sales of automobiles continued to stagnate, with high delivery times impeding registrations (Chart 14c). As regards automobile sector, Maharashtra and Uttar Pradesh were the top two states in vehicle registrations in February 2022 (Chart 14d). The electric vehicle segment posted multifold increases in sales. Rural demand recorded a moderation with two wheelers and entry level cars contracting over pre-pandemic levels (Chart 14e). 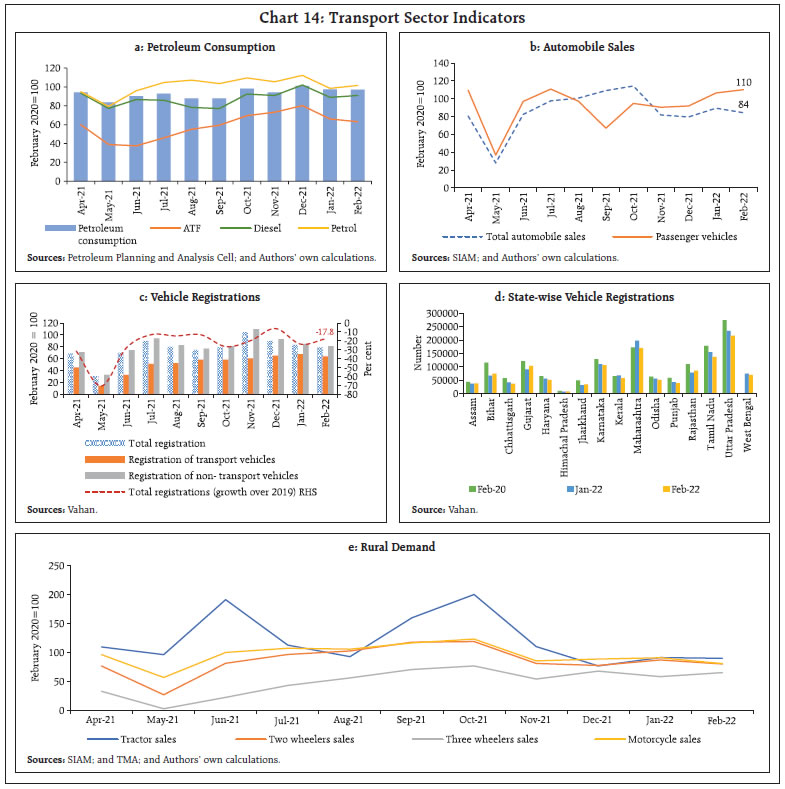 FMCG demand rebounded in February 2022 after a sluggish performance in January. As per retail intelligence platform Bizom, FMCG sales increased by 17 per cent (m-o-m) in February. The growth was entirely driven by higher sales of commodities and packaged foods, while home and personal care categories declined. As per the household survey of the Centre for Monitoring Indian Economy (CMIE), the labour participation rate increased marginally by three basis points in February 2022 over the preceding month. The employment rate (worker population ratio) fell by 58 basis points, which led to a significant increase in the unemployment rate from 6.6 per cent in January to 8.1 per cent in February 2022. The survey also indicated that unemployment is falling in urban areas and rising in rural areas (Chart 15a). Employment rates in industrialised states like Gujarat and Maharashtra witnessed a sign of improvement (Chart 15b). 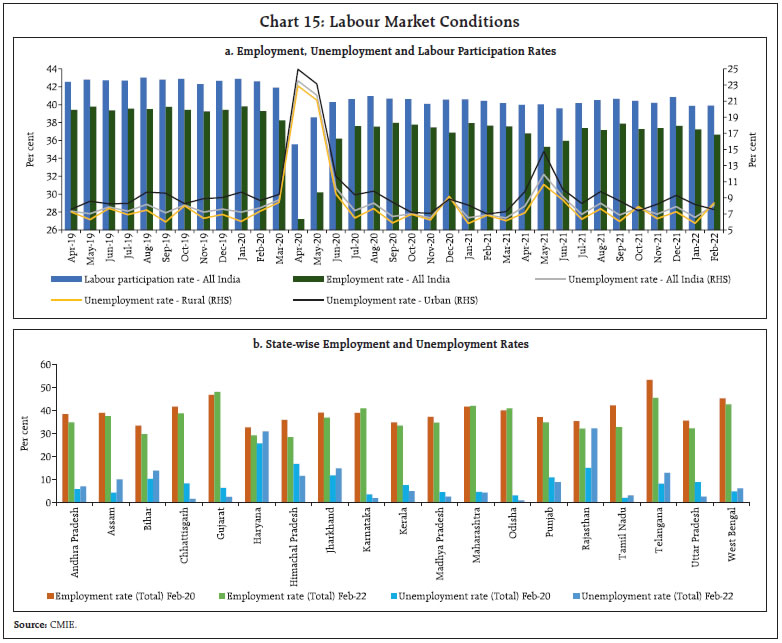
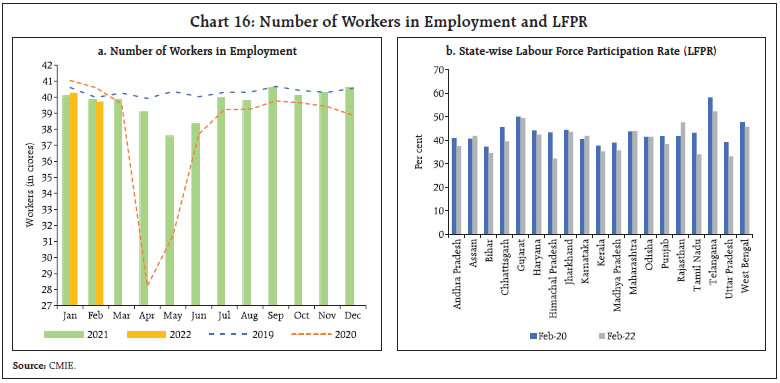 As per the CMIE’s employment statistics, the labour market suffered further in February 2022 after a marginal fall last month. The fall in number of workers by 5.5 million in February over last month led to employed worker count below the level a year ago (Chart 16a). The labour force participation rate (LFPR) has, however, returned closer to pre-pandemic levels across many states. Assam, Karnataka, Maharashtra and Rajasthan have witnessed LFPR rising above their pre-pandemic levels in February 2022 vis-à-vis February 2020 (CMIE) [Chart 16b]. PMIs show that employment under both manufacturing and services sector contracted for the third consecutive month in February 2022 (Chart 17).
India’s merchandise exports at US$ 34.6 billion in February 2022 remained above US$ 30 billion mark for the 12th consecutive month. Exports registered a growth of 25.1 per cent on a y-o-y basis and over pre-Covid levels (24.6 per cent) [Chart 18]. During April 2021 – February 2022, the merchandise exports stood at US$ 374.8 billion, covering 93.7 per cent of the US$ 400 billion export target set for 2021-22. Export growth was broad-based, with ten major commodity groups accounting for around 80 per cent of exports of the expansion above pre-COVID level. (Chart 19a). The improvement in export performance stemmed from higher value of shipments of engineering goods, petroleum products and chemicals (Chart 19b). India has recently signed a Comprehensive Economic Partnership Agreement (CEPA) with the United Arab Emirates (UAE) to target bilateral trade at US$ 100 billion over the next five years in key sectors such as gems and jewellery, textiles and leather. Over the last decade, the composition of exports to the UAE has broadened significantly, with a sharp rise in petroleum products and gems and jewellery exports (Chart 20). Merchandise imports at US$ 55.4 billion in February 2022 remained above US$ 50 billion for the sixth consecutive month, registering a growth of 46.3 per cent over pre-pandemic levels (February 2020) [Chart 21]. Elevated crude oil prices are driving up India’s import bill as the Russia-Ukraine conflict has accentuated supply-side concerns. Robust import demand was driven by higher demand for petroleum products, electronic goods and gold (Chart 22a). Import growth was broad-based, with major commodity groups accounting for more than 75 per cent of imports recording an expansion above their pre-COVID levels (Chart 22b). Crude imports increased by 41.7 per cent in February 2022 over pre-Covid levels, reflecting the rise in crude oil prices.
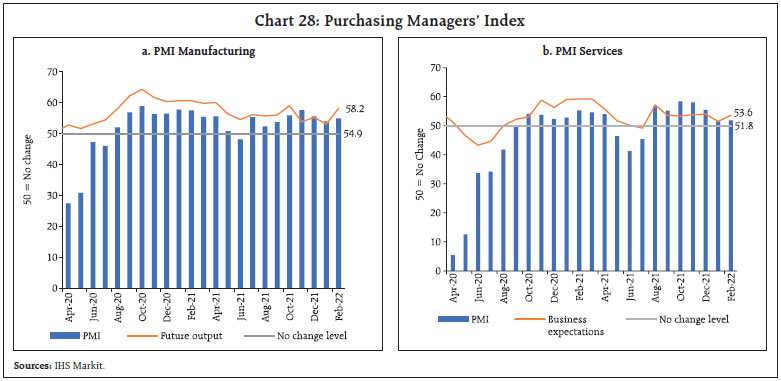
The imports of fertilisers remained at a record level in February 2022 and expanded more than 301.6 per cent over the pre-pandemic period (Chart 23a). Non-oil non-gold imports maintained strong growth for the ninth consecutive month in February 2022 over pre-Covid levels (Chart 23b). As imports grew faster than exports, India’s trade deficit (at US$ 20.9 billion) in February 2022 increased, both sequentially (US$ 17.9 billion in January 2022) as well as on a y-o-y basis (US$ 13.1 billion in February 2021) and pre-Covid levels (US$ 10.2 billion in February 2020). As per the provisional data released on India’s services trade, India’s services exports at US$ 21.6 billion increased by 24.2 per cent in January 2022 (y-o-y). Net exports of services grew by 11.5 per cent during January (y-o-y). For 2022-23, the Services Export Promotion Council has set an export target of US$ 300 billion for services sector. The gross fiscal deficit for 2021-22 revised estimates (RE) stands at 6.7 per cent of GDP based on second advance estimates for 2021-22. During April-January 2021-22, the fiscal position of the Union government posted an improvement, with net tax revenues touching an all-time high of 87.7 per cent of RE. Total expenditure during April-January 2021-22 registered a growth of 11.6 per cent over 2020-21, with capital expenditure and revenue expenditure recording growth of 22.0 per cent and 9.9 per cent, respectively. The gross fiscal deficit plummeted to an all-time low of 58.9 per cent of RE during April-January 2021-22 (Chart 24). On March 14, 2022, the Union Government presented the third and last batch of Supplementary Demand for Grants for 2021-22, which proposes a net cash outgo of ₹1.07 lakh crore. 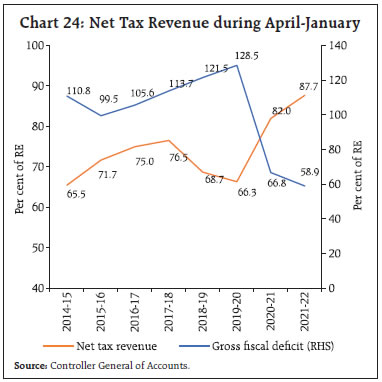 In February 2022, GST collection recorded a y-o-y growth of 17.6 per cent, crossing the ₹1.3 lakh crore mark for the fifth consecutive month in a row (Chart 25). GST cess collection crossed the ₹10,000 crore mark for the first time since its implementation. As per the information available for 25 States, revenue receipts posted a robust growth of 21.4 per cent during April-December 2021 (against a decline of 10.5 per cent in April-December 2020), primarily driven by tax and non-tax revenue (Chart 26). The revenue receipts of the States need to grow at 29.4 per cent in Q4:2021-22 as compared with 32.3 per cent in the corresponding period of 2020-21 to meet the budgetary targets. States’ revenue expenditure and capital outlay grew by 13.0 per cent and 49.7 per cent, respectively, during April-December 2021. Additionally, the Centre enhanced the outlay under the ‘scheme for financial assistance to States for capital investment’ from ₹10,000 crore in the budget estimates to ₹15,000 crore in the revised estimates for 2021-22 to encourage capital spending. Furthermore, in addition to the regular instalment of tax devolution, the Centre has released two advance instalments of tax devolution in November 2021 and January 2022. States are likely to meet the residual growth of 12.8 per cent and 27.3 per cent in revenue and capital spending, respectively, in Q4:2021-22 (as against 40.1 per cent and 53.9 per cent in Q4:2020-21) to achieve budgeted expenditure. Aggregate Supply On the supply side, aggregate supply, as measured by the gross value added (GVA) at basic prices, increased by 8.3 per cent in 2021-22, as against a contraction of 4.8 per cent a year ago. Apart from the resilient agriculture sector, a sustained retrieval in both industrial and services sectors facilitated this acceleration. All sectors except trade, hotels, transport, communication and services related to broadcasting surpassed their pre-pandemic levels. In the agriculture sector, record sown area contributed to a growth in production of kharif (2.0 per cent) as well as rabi (1.5 per cent) crops over a year ago (Chart 27a). Summer or zaid season is a short intervening period between rabi and kharif starting from March till May. As of March 04, 2022, the total summer crop sown area stood at 29.2 lakh hectares which was 0.4 per cent less than the preceding year’s level mainly due to low acreage under major crops, viz., rice (-3.5 per cent), and oilseeds (-20.7 per cent) (Chart 27b). The pace of planting is expected to regain a momentum in the coming weeks. As on March 08, 2022, the overall procurement of rice during the ongoing kharif marketing season 2021-22 touched 489.2 lakh tonnes cumulatively, as against 451.9 lakh tonnes a year ago. The target for rice procurement in this complete season at 528.3 lakh tonnes. As per the quarterly buffer norms (January-March), stock levels for both rice and wheat stay comfortable (7.8 and 1.9 times respectively) as of mid-February 2022. The demand for jobs under MGNREGS declined by 20.5 per cent (y-o-y) partly reflecting the ongoing rabi harvest operations in the rural hinterlands (Chart 27c). In the industrial sector, the headline manufacturing PMI at 54.9 remained in expansion mode in February 2022, increasing from 54.0 a month ago. PMI services too remained in expansion mode at 51.8, with the expansion accelerating from 51.5 a month ago. The business expectations index (BEI) for services expanded for the seventh successive month in February 2022, but the outlook remains clouded amidst elevated commodity prices (Chart 28). 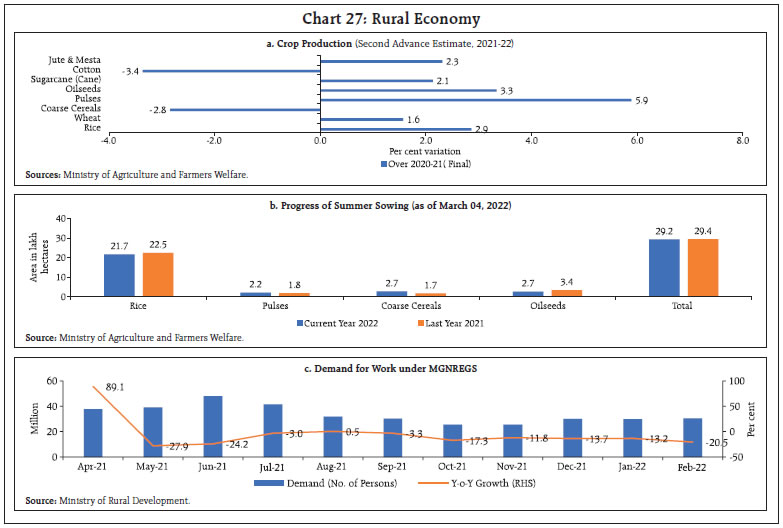
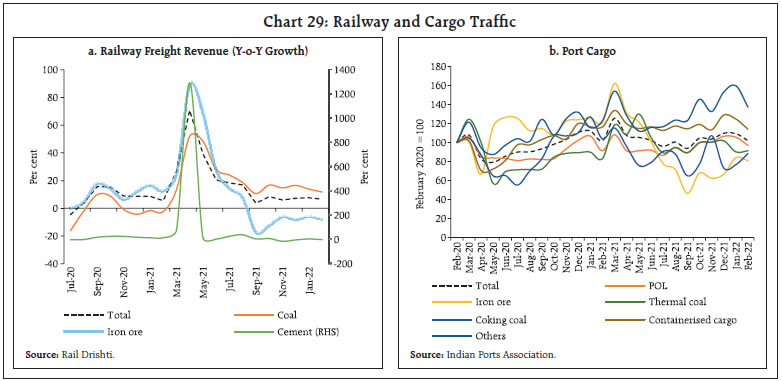 In the services sector, transport indicators recorded growth, with railways freight traffic increasing by 6.6 per cent (y-o-y) in February 2022 vis-à-vis 5.5 per cent a year ago (Chart 29a). An increase in freight was recorded in coal, even as iron-ore and cement declined on a high base a year ago. Cargo at major ports recorded moderation in February, albeit at levels comparable to pre-pandemic readings. The moderation was attributable to a decline in commodities of containerised cargo and Port of Loading (POL) which together account for 67 per cent of total cargo (Chart 29b). Activity in the construction sector continued to pick up during January-February 2022, with indicators of cement production and steel consumption recording expansion over the corresponding month in 2019 (Chart 30). Although cement production increased for the second consecutive month in January 2022, rising input costs remain a major deterrent to recovery in the sector. The aviation sector posted recovery in February 2022. Daily domestic airport footfalls averaged 5.4 lakh per day – an expansion of 31.9 per cent over the preceding month. International airport footfalls also increased by 4.3 per cent sequentially, while the cargo segment increased by 0.1 per cent for domestic cargo and 6.0 per cent for international cargo. In the first fortnight of March, domestic airport footfalls increased by 44.6 per cent.
However, the contact intensive aviation and tourism sectors continue to lag. Decline in rural demand also impacted sales in the automobile sector, as contraction in two wheeler segment deepened (Table 2). Inflation Provisional CPI data for February released by the NSO on March 14, 2022 showed that headline CPI inflation (year-on-year) for the month of February 2022 edged up to 6.1 per cent from 6.0 per cent in January (Chart 31a). A positive price momentum (month-on-month change in prices in the current month) of 24 bps in February was partially offset by favourable base effects (month-on-month change in prices a year ago) of 19 bps, resulting in a slight increase in headline inflation by 5 bps between January and February. Food and beverages inflation was the main driver, rising to 5.9 per cent in February from 5.6 per cent in January. The decline in food price momentum by 12 bps was overwhelmed by an unfavourable base effect of 44 bps. In terms of sub-groups, inflation edged up in cereals, egg, meat and fish, vegetables and spices. On the other hand, inflation softened in edible oils, milk, non-alcoholic beverages and prepared meals while inflation in pulses, fruits and sugar remained steady. For the fourth consecutive month, fuel inflation softened – it moderated by around 59 bps to 8.7 per cent in February from 9.3 per cent in January, primarily due to the moderation in LPG inflation, even as kerosene (PDS) inflation rose sharply. Electricity prices continued to remain in deflation in February. CPI fuel (weight of 6.84 per cent in the CPI basket) contributed around 9.6 per cent of headline inflation in February (Chart 31b). CPI inflation excluding food and fuel1 or core inflation registered a moderation of around 15 bps to 5.8 per cent in February from 6.0 per cent a month ago (Chart 31a). While inflation in pan, tobacco and intoxicants, recreation and amusement, health and transport and communication moderated, inflation in clothing and footwear, housing, household goods and services and education sub-groups edged up. High frequency food price data from the Ministry of Consumer Affairs, Food and Public Distribution (Department of Consumer Affairs) for March so far (March 1-14, 2022) indicate a marginal uptick in prices of cereals. Pulses prices have remained steady. Edible oils prices registered a broad-based increase. Prices of tomatoes and onions witnessed further seasonal price correction, while potato prices have increased in March so far (Chart 32). Retail selling prices of petrol and diesel in the four major metros remained unchanged in March so far (March 1-14, 2022). Even though LPG prices remained steady, kerosene prices increased in the first half of March (Table 3). Input costs rose further in February across manufacturing and services as reflected in the PMIs. Selling prices, however, rose only marginally across manufacturing and services in February.
| Table 3: Petroleum Products Prices | | Item | Unit | Domestic Prices | Month-over-month (per cent) | | Mar-21 | Feb-22 | Mar-22^ | Feb-22 | Mar-22 | | Petrol | ₹/litre | 93.20 | 102.87 | 102.87 | 0.0 | 0.0 | | Diesel | ₹/litre | 85.11 | 90.51 | 90.51 | 0.0 | 0.0 | | Kerosene (subsidised) | ₹/litre | 29.37 | 42.17 | 46.87 | 15.4 | 11.2 | | LPG (non-subsidised) | ₹/cylinder | 829.63 | 910.13 | 910.13 | 0.0 | 0.0 | ^: For the period March 1-14, 2022.
Note: Other than kerosene, prices represent the average Indian Oil Corporation Limited (IOCL) prices in four major metros (Delhi, Kolkata, Mumbai and Chennai). For kerosene, prices denote the average of the subsidised prices in Kolkata, Mumbai and Chennai.
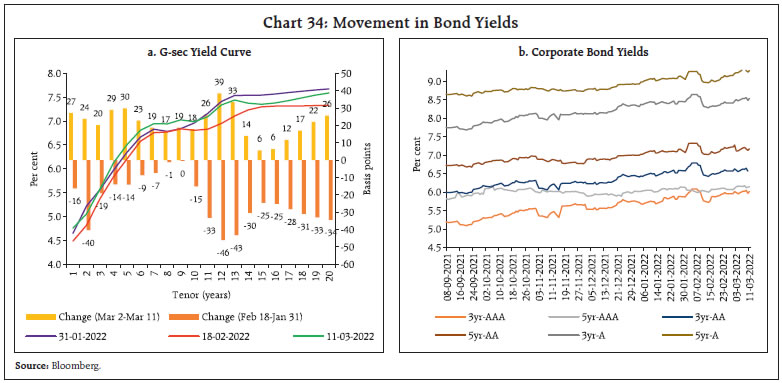
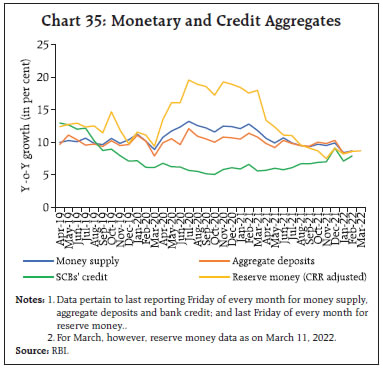
Sources: IOCL; Petroleum Planning and Analysis Cell (PPAC); and RBI staff estimates. | IV. Financial Conditions In alignment with the accommodative monetary policy stance reiterated by the Monetary Policy Committee (MPC) on February 10, 2022, daily liquidity absorptions under the liquidity adjustment facility (LAF) averaged ₹8.4 lakh crore in the second half of February through March 2022 (up to March 13), widening from ₹7.4 lakh crore during the second fortnight of January to mid-February 2022. Increased government spending became the principal autonomous driver of liquidity in this period, despite higher leakage in the form of currency in circulation on account of state elections and rabi harvesting season. The average daily absorption under the fixed rate reverse repo window stood at ₹1.7 lakh crore while the bulk of total absorption was effected through the variable rate reverse repo auctions (both main and fine-tuning), reflecting liquidity rebalancing through migration of surplus liquidity towards longer tenors (Chart 33a). The liquidity surplus in the banking system pulled down overnight money market rates, with the weighted average call rate (WACR), the tri-party repo and the market repo rate close to the reverse repo rate. Interest rates on longer term money market instruments such as 3-month T-bill and certificates of deposit (CDs), however, remained higher, with their respective spreads over the reverse repo rate averaging 38 bps and 60 bps during the second fortnight of February through March 11, 2022. Similarly, the 3-month commercial paper (CP)-NBFC rates stayed elevated above the marginal standing facility (MSF) rate (Chart 33b). Robust primary market activity in the CD and CP markets has kept rates higher. With the revival in the credit cycle, fund mobilisation through CD issuances surged through November 2021-January 2022 to ₹65,298 crore from ₹61,983 crore during April-October 2021. The bond market pared the gains witnessed after the cancellations of weekly auctions. The yield on the 10-year benchmark G-sec hardened to 6.86 per cent on March 11, 2022 from a low of 6.6 per cent observed on February 18 (Chart 34a). The relentless surge in global crude oil prices amidst escalating geopolitical tensions from the Ukraine conflict spooked market sentiments. In the primary market, the government completed its borrowing programme for 2021-22 with the last weekly auction conducted on February 25. Corporate bond yields hardened, tracking the movement in G-sec yields (Chart 34b). Turning to overall monetary and credit conditions, reserve money (RM), excluding the first-round impact of the cash reserve ratio (CRR) restoration, grew at 8.9 per cent y-o-y as on March 11, 2022 (16.3 per cent a year ago) with currency in circulation, the largest constituent of RM, maintaining the same growth rate (19.2 per cent a year ago). Money supply (M3) expanded by 8.7 per cent as on February 25, 2022 (12.8 per cent a year ago), primarily driven by the growth in aggregate deposits with banks at 8.6 per cent (11.4 per cent a year ago). The growth in scheduled commercial banks’ (SCBs’) credit to the commercial sector, which crossed the 7.0 per cent level in November 2021 for the first time since April 2020, rose to 7.9 per cent on February 25, 2022 (6.6 per cent a year ago) [Chart 35]. 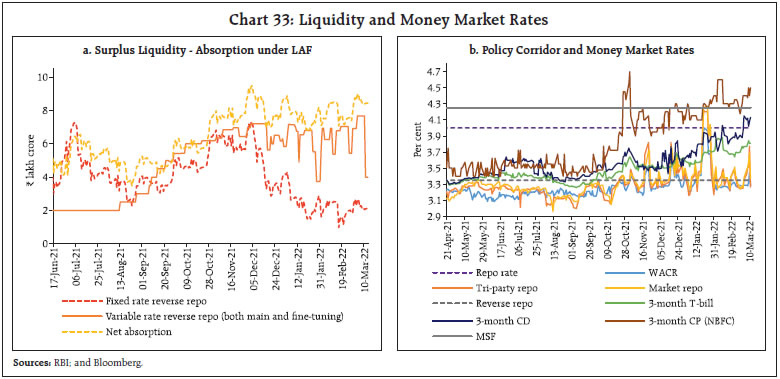
 Since March 2020, the one-year median marginal cost of funds-based lending rate (MCLR) of SCBs softened cumulatively by 95 bps. In response to the repo rate cut of 115 bps, the weighted average lending rates (WALRs) on fresh and outstanding rupee loans declined by 140 bps and 122 bps, respectively, during the period March 2020 to January 2022 (Chart 36). With credit offtake picking up, some SCBs have raised interest rates on term deposits. The extent of pass-through of policy rate reduction to the median term deposit rate (MTDR) which remained 154 bps during the period March 2020 to September 2021, dipped marginally to 150 bps in February 2022. The perceptible decline of 174 bps is discernible in the case of short tenor deposits of maturity of up to one year. Across domestic banks, robust deposit growth has enabled higher pass-through by private banks to term deposit rates compared to their public sector counterparts (Chart 37). Interest rates on small saving schemes are administered and set by the Government of India. These administered interest rates are linked to market yields on G-secs with a lag and are fixed on a quarterly interval at a spread ranging from 0-100 bps over and above G-sec yields of comparable maturities. The Government of India is expected to review interest rates on small saving instruments (SSIs) for Q1:2022-23 on March 31, 2022. The existing rates of interest on SSIs need to be reduced in the range of 9-118 bps for Q1:2022-23 to align them with the formula-based rates. In February 2022, domestic equity markets were embroiled by developments surrounding the Russia-Ukraine conflict, in tandem with the movements in global equity markets (Chart 38). Domestic equity market tumbled persistently in the second half of the month, recording a sharp sell-off on February 24, 2022. Domestic equities continued to remain under pressure and recorded further correction in early March as concerns over spillover effects of the war in Ukraine and a sharp jump in crude oil prices weighed on market sentiment. Thereafter, markets recovered amidst marginal moderation in commodity prices. Overall, the BSE Sensex has lost 2.6 per cent since end-January to close at 56,486 on March 14, 2022. Following the recent correction in equities and resilient growth in corporate earnings, the price-to-earnings (P/E) ratio of the BSE Sensex declined and the valuation premium over its long-term average has moderated. The market capitalisation of BSE listed companies on February 24, 2022 fell to its lowest level since August 26, 2021 (Chart 39). In the primary markets, companies raised ₹1.38 lakh crore through 148 public/rights issues so far (up to February 2022). An analysis of mainboard initial during the public offerings (IPOs) that raised funds in this financial year reveals that while a substantial portion of the amount raised has been via Offer for Sale (OFS), primary mobilisation enabled companies to reduce debt and finance growth requirements (Chart 40). 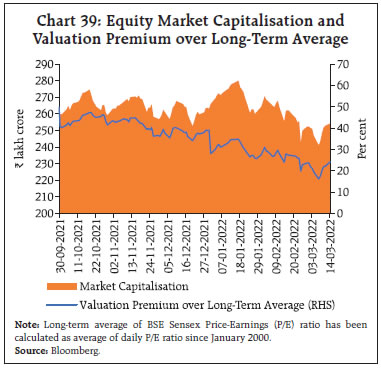 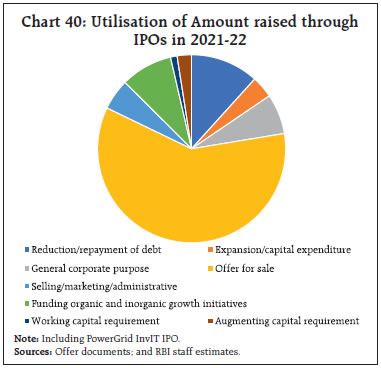 The Draft Red Herring Prospectus of the much-anticipated IPO of the Life Insurance Corporation of India (LIC) was filed with the market regulator recently, indicating an OFS of up to 3,16,249,885 equity shares worth 5 per cent stake. The LIC IPO is set to be the biggest IPO ever in India, and hence, correct timing of the IPO is crucial. With 35 per cent of the issue size reserved for retail investors, their response is critical for the success of the LIC IPO. Recently, there has been a rise in retail participation in domestic equity markets, which could be gauged by 289 lakh new demat accounts opened this fiscal year (April-January 2022). The LIC IPO presents a fresh opportunity to deepen the equity markets’ reach further2. LIC’s huge policyholder base has the potential to bring large number of new investors to the capital markets who have historically relied on traditional saving products. The deepening of capital markets is also vital for divestment plans of the government, and therefore, it is important to inculcate investors’ trust in key market infrastructure institutions. Riding on the back of robust fresh equity investments, net foreign direct investment (FDI) increased substantially to US$ 5.9 billion in January 2022 (US$ 1.5 billion in January 2021), which was much higher than cumulative inflows of US$ 4.4 billion in Q3:2021-22. During 2021-22 (April-January), gross FDI inflows were robust at US$ 69.7 billion (Chart 41). Net FDI was US$ 31.5 billion as compared with US$ 42.8 billion a year ago, reflecting rising outward FDI from India. Manufacturing, computer services, communication services, financial services, and retail and wholesale trade sectors received most of the investment and accounted for 70.4 per cent of total equity inflows in 2021-22 (April-January). Foreign portfolio investors (FPIs) continued to pull funds out of the domestic market amidst escalating geopolitical tensions, increasing crude oil prices and US bond yields. While the equity segment recorded an outflow for the fifth consecutive month in February, FPIs turned net sellers in the debt market in February, after being net buyers during January. Net FPI outflows from the domestic market were to the tune of US$ 5.4 billion in February 2022 (Chart 42).
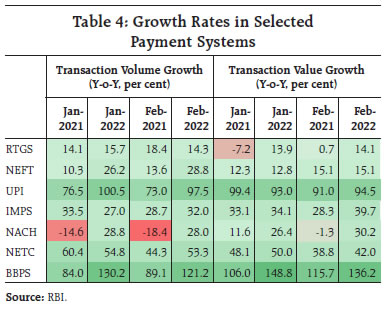
Net disbursements of external commercial borrowings (ECB) to India, excluding inter-company borrowings, increased to US$ 4.8 billion during January 2022 after registering net repayments during Q3:2021-22. Net disbursements including inter-company borrowings at US$ 5.6 billion were higher than US$ 2.2 billion in January 2021. During January 2022, a considerable amount of borrowing was used for working capital, on-lending/sub-lending and refinancing of earlier ECB. The foreign exchange reserves increased by US$ 1.9 billion during February 2022 after recording contraction for three successive months. At US$ 631.9 billion on March 4, 2022, they stood equivalent to about 12.4 months of imports projected for 2021-22 (Chart 43). In the foreign exchange market, the Indian rupee (INR) depreciated against the US dollar in February 2022 by 0.7 per cent (m-o-m) amidst surging demand for the US dollar on FPI outflows and hardening crude oil prices. The INR fell to an all-time low of ₹76.92 per US dollar on March 7, 2022 when crude oil prices reached the highest level since the global financial crisis of 2008. The depreciation of the Indian rupee was reflected in the movements of the INR in both nominal and real effective terms (40-currency basket), which depreciated by 0.8 and 1.1 per cent, respectively, in February 2022 over its level a month ago (Chart 44a and 44b). Payment Systems Digital payments continued to register robust growth in February and March 2022 (up till 11th March). Large-value transactions through the Real Time Gross Settlement (RTGS) sustained double-digit growth (y-o-y), both in volume and value terms in tandem with the economic recovery that is underway. Retail payments expanded strongly across the payment modes (Table 4). The Unified Payments Interface (UPI) sustained near 100 per cent growth in volume and value of transactions. The National Electronic Funds Transfer (NEFT), the Immediate Payment Service (IMPS), and the National Automated Clearing House (NACH) also demonstrated remarkable growth. Transactions under the Bharat Bill Payment System (BBPS) clocked a triple-digit growth in volume and value while the National Electronic Toll Collection (NETC) grew consistently. Displaying resilience in consumer and business spending amidst the third wave, the average ticket size of card transactions3 exhibited a growth of 22.5 per cent. Due to improvements in cashflows of businesses with the ebbing of the third wave, NACH debit bounce rates4 were down by 400 bps to 23.4 per cent by value in January 2022 year-on-year5. This may be indicative of a reduction in credit delinquency rate. Data for digital payments infrastructure (as of January 2022) showed a steady growth in the number of static UPI Quick Response (QR) codes, and prepaid payment instrument (PPI) wallets and cards. With the interoperability of PPIs through UPI and card networks on the anvil, the resultant synergy is expected to manifest in accelerated growth in transactions through these modes. 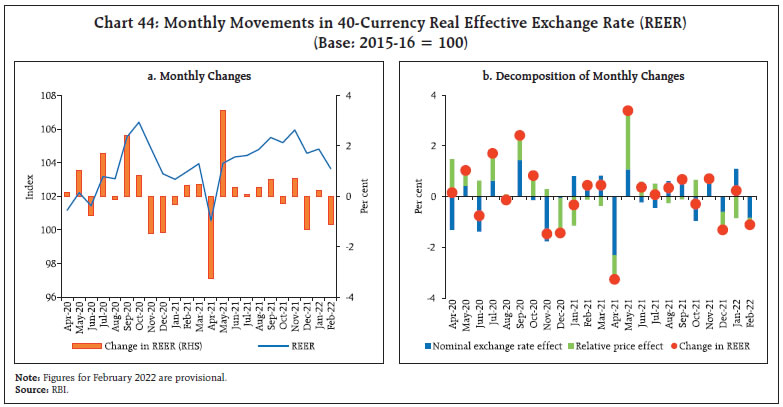
 Compared to various regions of the world, India’s annual growth in digital commerce transaction value6 has been consistently higher since 2018 (Chart 45). In 2021, India’s digital commerce transactions growth at 30 per cent was 760 bps higher than global growth7. Startups played a crucial role in shaping India’s digitalisation. India, with 43 unicorn startups (including 12 FinTechs), secured a third rank in terms of the number of startups joining the unicorn club in 2021, next only to the US and China8. 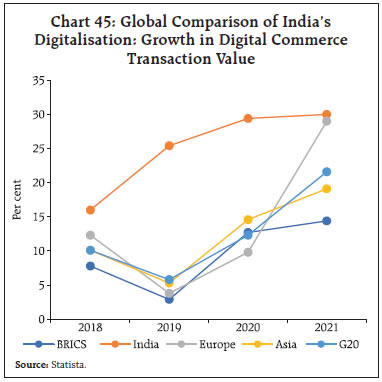 Continuing its efforts towards achieving financial literacy, the Reserve Bank conducted its annual Financial Literacy Week between February 14-18, 2022, with the theme “Go Digital, Go secure.” The convenience and security of digital transactions and customer protection were the focus areas. This is backed by recent research establishing the importance of financial awareness, positive perception, safety, and trust in increasing the adoption of digital payment infrastructure9. These efforts were complemented by NPCI’s UPI Safety and Awareness Month10. A new milestone was achieved in the internationalisation of the UPI, with the NPCI International Payments Limited (NIPL) set to enable the platform in Nepal11. V. Conclusion The ongoing geopolitical crisis has heightened the uncertainty clouding the global macroeconomic and financial landscape even as the world economy struggles to recover from the pandemic. Spiralling oil and gas prices and unsettled financial market conditions pose fresh headwinds to the still incomplete global recovery. Amidst these testing times, India is making steady progress on the domestic front as it recovers from the third wave. India’s macroeconomic fundamentals remain strong. Unfolding global developments nevertheless pose downside risks in terms of spillovers.
|