Transition to a net-zero carbon emission target will entail adjustment in the production processes of industries that are directly or indirectly exposed to excessive use of fossil fuel. Concomitantly, due to the exposure of Indian banks to these industries, there can be spillover effects on them, which is highlighted in this article. Three sectors with direct exposure to fossil fuels – electricity, chemicals, and automobiles account for around 24 per cent of credit to overall industrial sector, but only 10 per cent of total outstanding non-retail bank credit, which implies a limited spillover to the banking system. Several other industries, however, indirectly use fossil fuels and therefore any transition to green energy can have implications for their income and consequently their interest coverage ratio (ICR). Therefore, the gross non-performing assets (GNPA) ratio of such industries may be sensitive to green energy transition, and their impact on overall banking system need to be monitored closely. Introduction In the recent years, governments across the globe have been aggressively pursuing measures to mitigate the impact of climate change. Some of the flagship programmes include United Nation’s Environment Programme (UNEP), Paris Climate Change deal (2015) and Glasgow COP26 (2021). Climate risk has a few defining characteristics that differentiate it from other risks. It is far-reaching, non-linear, and has mostly irreversible consequences. Given the economic costs and benefits of the policies required to tackle climate change, it has become imperative to analyse the related macroeconomic issues, including financial risks. For a central bank, monitoring financial entities’ exposure to climate risk and stress testing the impact of such risks for macro-financial stability assume particular significance. Recognising the emerging challenges, the Bank of England has launched the Biennial Exploratory Scenario Analysis; Banque de France uses a sectoral rating-based model and financial models; Bank of Canada evaluates the impact of climate change scenarios on Canadian GDP; and Banco Central de Chile assesses the probability of default. The Reserve Bank of India has also been proactive in highlighting green finance related issues in its reports and publications, with a focus on financial stability implications in the Financial Stability Report (FSR). India has formulated the National Action Plan on Climate Change or NAPCC back in 2008 and set up the Climate Change Finance Unit (CCFU) in 2011 with a vision to outline the broad policy framework towards mitigating the impact of climate change. Further, there have been several recent initiatives in this direction, notably the International Solar Alliance; reducing emission in railways; the LED bulb campaign; and widening of geographical coverage of BS IV (See Section III). One could expect increasing challenge of adhering to emission norms for industries, vehicles and fossil-fuel energy production units in the future. The banking sector in India, being the dominant source of finance for these sectors, is likely to be exposed to certain transitional costs. To quantify the effects of such changes, the rating class of models use probability of defaults (PD) in different industries. In another class of general equilibrium models, transitional shocks are viewed as supply side shocks, unlike physical shock which are viewed more as demand side shocks. In this article, we analyse the exposure of the banking sector in India to industrial activities that are dependent on fossil fuels, to measure the extent of vulnerability that the banking sector may be exposed to, if there is a major shift in the industry input usage and/or production processes due to a shift away from fossil fuels. Beside industries related to fossil fuels that create direct exposures, there are several other industries which are dependent on fossil fuel-based energy to a varied extent and therefore can be treated as being indirectly exposed. The rest of this article is organised as follows. In Section 2, we provide a brief outline of the prevailing global emission standards, norms and policies, which mainly comprise of the Green House Gas (GHG) emission targets that various countries have set according to the Paris Climate deal (2015), and the progresses made so far with an emphasis on India. In Section 3, we identify the major sectors that might be exposed to fossil-fuel risks. In Section 4, we discuss their dependence on fossil fuel in greater detail. In Section 5, we discuss the exposure of banking sector to these sectors. Section 6 concludes with key observations. II. Greenhouse Gas Emission: Global Trends and Policy In order to combat climate change risks, the Paris Agreement was adopted as a landmark climate deal, which is a legally binding international treaty1 on climate change. The agreement was adopted by 196 parties in December 2015 and has come into force since November 2016. The goal of the deal is to limit global temperature rise to well below 2 degrees Celsius, preferably to 1.5 degrees Celsius, compared to the pre-industrialisation period of the past century. The Paris climate deal primarily rests upon country-specific plans for climate action, known as nationally determined contributions (NDCs), which the countries had to submit by 2020. In their NDCs, countries commit to reduce their GHG emission intensities (per capita emission or emission-to-GDP ratio) at a mutually agreed level by 2030. Countries also communicate actions which they will take to reduce their GHG emissions in order to reach the goals of the Paris Agreement. The Paris Agreement works on a 5-year cycle of increasingly ambitious climate action carried out by countries. The first set of NDCs are now available and are presented for the major countries in Table 1. With the Paris Agreement, countries established an enhanced transparency framework (ETF) to track the progresses at country-level. Under the ETF, starting in 2024, countries will report actions taken, progress made in climate change mitigation, adaptation measures applied and support provided or received in a transparent manner. | Table 1: 2030 Unconditional Targets According to NDCs | | Country | Reduction in Emission Intensity (Percentage reduction from base year) | GHG Intensity 2015-18 average (kt of CO2 equivalent/ GDP 2017 PPP $ Bn) | | 1 | 2 | | India | 30-35 | 399 | | China | 60-65 | 624 | | Indonesia | 29 | 318 | | EU | 29 | 192 | | Japan | 26 | 241 | | Canada | 30 | 406 | | Brazil | 6 | 348 | | Russia | 25-30 | 657 | Note: The figures in Column (1) represent the NDCs according to Paris Climate Agreement 2015. Thereafter, most of these countries have agreed to revise these targets in COP26 Summit. These commitments are in terms of the percentage reduction in GHG emission intensity (GHG emission/ GDP). The countries listed here are the top emitters as per the total GHG emissions (kt of CO2 equivalent), according to the data published by the World Bank. The major emitters include USA and Iran. NDCs for USA were not available since the country had withdrawn from Paris Agreement. The Source also didn’t have data on NDCs for Iran. Reference year for India, China, Indonesia and Canada is 2005. Reference year for EU and Brazil is 2010. Reference year for Japan and Russia are 2013 and 1990, respectively.
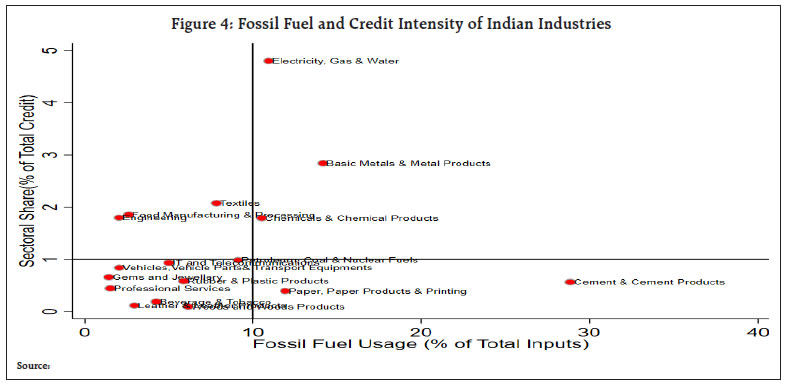
Source: https://climateactiontracker.org. | Figure 1 shows that except Iran, almost all the countries have made considerable progress in reducing the GHG emission intensity measured as a ratio to their GDP, between 2000-2010 and the post-Paris deal years. Although the emission intensity since 2015 for Japan and Brazil are relatively closer to their levels prior to 2010, they have remained far lower than rest of the countries/regions in this regard. For the world, the GHG emission intensity between 2015-18 has been 18 per cent lower than the average between 2000-10. China has led with 35 per cent decline followed by Indonesia at 31 per cent and USA at 28 per cent. The decline in GHG emission between these periods has been 26 per cent for India closely followed by the EU at 25 per cent. The progress in terms of GHG emission intensity to GDP till 2018 has been quite close to the NDCs, except for Iran and Japan. However, the absolute GHG emission for the world was higher by 21 per cent between these two periods. Only the USA and EU have been able to reduce their absolute GHG emission levels between 2015-18 as compared to 2000-10. Therefore, it may require significantly more effort beyond the Paris deal, including the transfer of appropriate technologies from Advanced Economies to the Emerging nations to fully counter the adverse effects of GHG emissions. 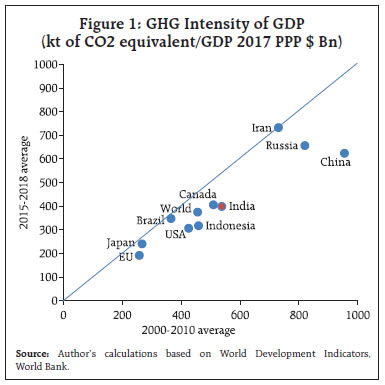 As far as the reduction in emission intensity from industries is concerned, China is followed by the USA and EU (figure 2.1). However, emerging countries that rank high in terms of industrial emission intensity are yet to embark on a path to sufficiently reduce the emission intensity. This would require transfer of appropriate technologies from their developed counterparts, as well as enforcing appropriate protocols consistent with their needs for rapid industrial development. Both India and Indonesia continue to rank high in terms of emissions from electricity generation, and also showed very little decline in GHG emission between 2008 and 2015 from that sector (figure 2.2). A significant decline in GHG emission intensity from electricity generation came from China, USA and EU, while the intensity has increased for Japan and Brazil. Therefore, a significant effort would also be required to bring down the emission intensity for emerging countries like India, Indonesia, Brazil and also for developed countries like Japan. On the user end, for example, India ranks quite low in terms of per cent of domestic transport kilometre powered by zero emissions fuels among the major emitters (figure 2.3). In fact, there is a marginal decline in the usage between 2010 and 2017. The world average in this regard had increased between 2010 and 2017, led by Indonesia, USA, EU and China. Figures 2.1, 2.2 and 2.3 together show that there is significant need for improvement in the emission parameters across major sectors in India that use fossil fuel. Several policy instruments are already at work (See Ghosh et. al. (2021)). There are several other policy tools including carbon taxation, public investment, public guarantees, Emission Trading System2, Feebates3 etc. that are being studied in academic and policy forums (Krogstrup and Oman (2019), IMF’s Fiscal Monitor (October 2019), Dilip and Kundu (2020)). The increased push towards the production and usage of energy from alternative sources potentially exposes some sectors that are heavily energy dependent to some risks. In the next section, we identify the major sectors that are exposed to such risks. III India’s Exposure (a) Fossil Fuel In this section, we examine to what extent India is dependent on fossil fuel and how the trend has evolved over the years. We use the Annual Survey of Industries (ASI) data for the year 2016-17 to compute the fossil fuel intensity for each sector. The ASI data provide information on production processes and finances at the establishment level. We use the information on input usage to compute fossil fuel intensity. Specifically, we compute the value of electricity, petrol/ diesel, coal as a share of total inputs used by a particular industry (we take a weighted sum of all establishments in a particular industry). We adjust the value of electricity to take in to account the fact that 37.8 per cent of electricity is produced by renewable energy/non-fossil fuel sources (Central Electricity Authority). Figure 3 presents the share of fossil fuel in total inputs across major sectors in the economy. It tells us that cement products and basic metals are the two most exposed sectors to fossil fuel as 29 per cent and 14 per cent of total inputs, respectively, are sourced from fossil fuel. It may be noted that the cement industry has undergone several technological advancement in production process in recent years which has reduced its fossil fuel intensity considerably (State of the Economy, December 2021) (b) Bank credit India is an emerging market economy, where a large proportion of corporates is dependent on banking sector funds for financing their working capital and capex requirements. Though in the recent years there is some evidence of corporate deleveraging (Herwadkar, 2017), the banking sector has remained the predominant source of funds for most of the industries. In view of the above, we map fuel intensity and credit intensity of Indian industries to identify top exposures. ASI data for fossil fuel usage intensity and BSR data (as of March 2019) on credit outstanding for each sector are used for this purpose. Figure 4 shows the sectoral shares in outstanding credit on the y-axis and the fossil fuel intensity of the sectors on the x-axis. Sectors like electricity4 and basic metals absorb significant proportion of total credit disbursed by the banking sector but have moderate exposures to fossil fuel. Sectors like cement production in turn have large exposures to fossil fuel, but their credit shares are small. So, large vulnerabilities are not expected to emerge in the banking sector from disruptions, if any, in the sectors that are highly exposed to fossil fuel. The three sectors which have large exposure (10 per cent or more) to fossil fuels and relatively higher (1 per cent or more) sectoral share in total bank credit are electricity, base metals and chemicals. However, together they represent only 9 per cent of total outstanding credit. 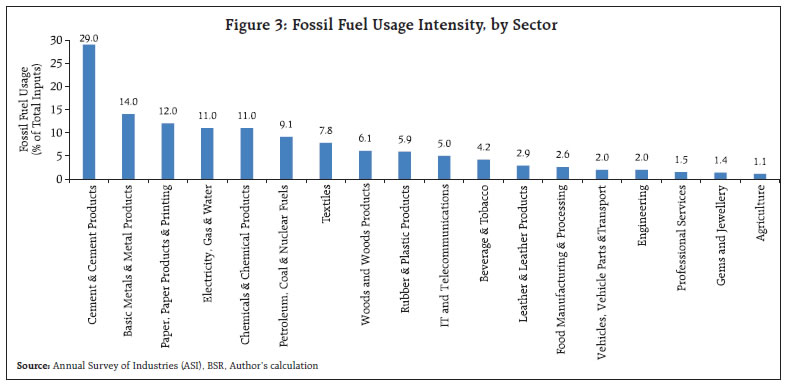
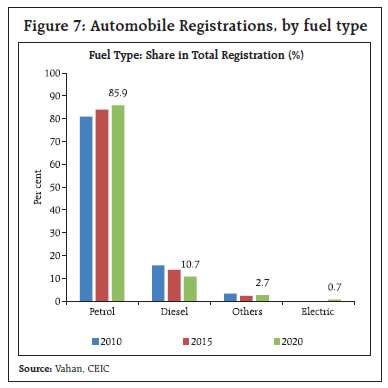
 In order to analyse the extent of dependence on fossil fuel, we first look at how the electricity sector has evolved in terms of transition to cleaner sources of fuel. We focus on the electricity sector first, it being an essential input in almost all production processes. Second, we consider ASI (Division 24), manufacturing of basic metals. Two of the major components of basic metal category are manufacturing of basic iron and steel and casting of iron and steel, which together constitute around 75 per cent of the output of the sector. The FSR, July 2021 presents an Impact Assessment of the Iron and Steel industry (summarized in Annex-1). We analyse the credit growth in the chemical and chemical products industry considering their horizonal and vertical linkages with other sectors of the economy. Finally, we turn to the Automobile sector. Though our identification matrix does not include automobile sector in terms of the selection coordinates, our interest in this sector is mainly motivated by the low per cent of India’s domestic transport kilometer being powered by energy efficient fuels (see Fig 2.3) and a slew of policy initiatives undertaken (e.g. BS VI standards, EV incentives etc.) to make this sector greener. The impact of these measures on the automobile sector is discussed in detail in Section IV.c. In addition to electricity, chemicals and the automobiles production, other sectors in the economy may be indirectly dependent on fossil fuel by the virtue of using electricity, petrol/ diesel, coal in the production processes. Hence, we also examine the degree of indirect dependence of different sectors. IV. Fuel sources a. Electricity Figure 5.1 below shows the share of different types of plants in the total installed electricity generation capacity for the three years 2010, 2020 and 2021. We observe that the share of power plants using renewable energy sources (RES) has increased between 2010 and 2021.5 Interestingly however, the share of thermal energy plants has remained unchanged during the same period. Thus, the increase in the share of RES plants has been at the cost of other types of plants like hydro and nuclear, the shares of which have decreased significantly between 2010 and 2021. Within thermal energy plants (Figure 5.2), the main source of fuel has been coal and this has remained so over the years. In fact, the share thermal power plants using coal as fuel, increased from 82.4 per cent to 86.3 per cent between 2010 and 2021. Thus, while RES plants have gradually increased their capacity over the years, the majority of the power plants are still thermal power plants that use coal as the major source of fuel for electricity generation. b. Chemical and Chemical Products The usage of fossil fuels in production of chemical products might be limited as compared to the other two sectors, viz., electricity and basic metals. However, like every other industrial activity, this sector uses energy as its intermediate input. As Figure 3.1 suggests, the energy sector in India is predominantly dependent on the conventional or fossil fuel based sources. In this respect, the chemical sector would also be exposed to risks arising from any changes to the energy usage portfolio in the coming years. Our estimates in figure 6 suggest that the share of energy related costs are about 3.6 per cent of the value of gross output that this sector produces. However, this share has substantially fallen since the beginning of this century. Energy usage as percentage of gross value added has also fallen in these lines (figure 6). c. Automobile: Fuel sources The move to cleaner fuel sources has been an important challenge for the automobile sector. Emission standards that follow a clear roadmap towards reducing greenhouse gas emissions have been at the center of discussions on climate change. India has also set forth its own agenda towards enhancing the emission standards aligning them with the global standards. The Government of India issues guidelines under the Bharat Stage Emission Standards (BS) which are based on the European standards. The BS-IV standards have been enforced across all of India since 2017. In 2016, the GoI announced that India will move to BS-VI standards by skipping BS-V standards. Recently, the Supreme Court of India ruled that BS-IV registrations will stop from April-20206. However, the Supreme Court provided some relief to the automobile sector due to the Covid-19 pandemic induced lockdown restrictions. These relaxations allowed the manufacturers and dealers to clear up their stock of BS-IV vehicles7. The Government has also pledged to promote electric vehicles which are a cleaner source of fuel for the emission standards. The International Energy Agency has estimated that only 30 per cent of the total vehicles in India will be electric by 20308. Figure 4 shows the shares of new vehicle registrations across all fuel types. We observe that although there has been an increase in the share electric vehicles in total registrations, the majority of the vehicles run on petrol. Thus, to increase the share of electric vehicles, a large thrust is needed, and it may not happen overnight. Moreover, even if there is a switch towards electric vehicles, since electricity generation is mainly dependent on fossil fuel (as shown in the previous section), the indirect dependence of fossil fuel needs to be carefully assessed. In our opinion, to reduce the absolute dependence on fossil fuel, there should be a coordinated move towards renewable energy sources for electricity generation, along with a shift towards electric vehicles. However, public policy needs to take cognizance of the resultant loss of employment in the fossil fuel sector during such a transition, and smoothen this short-term problem with appropriate measures. 
 V.1 Bank Credit: Direct Impact As of March 2020, the share of electricity generation in outstanding bank credit stood at 7.5 per cent and 4.0 per cent, for the public sector banks and the private sector banks, respectively (Figure 8). The shares have increased for both public and private sector banks between March 2010 and March 2020. The increase in the share of electricity in outstanding credit is sharper in case of the private sector banks. On the other hand, share of bank credit to automobile industries were lowest at 0.8 and 2.0 per cent as at end-March 2020, for public and private sector banks for the corresponding periods, respectively. The shares have fallen from 2010 for public and private sector banks. 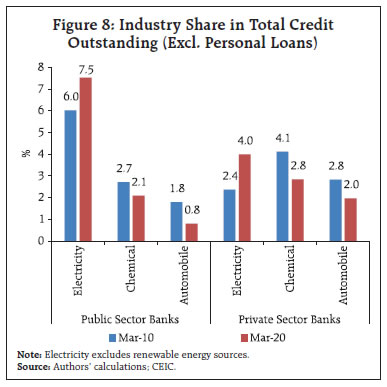
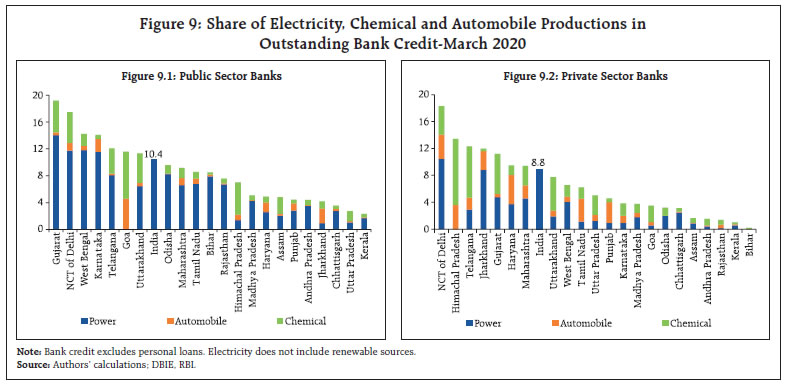
There exists a wide variation across states in terms of banking sector’s exposure to these sectors (Figures 9.1 and 9.2). The aggregate share of these three sectors exceed the national average in case of Delhi, Gujarat, Telangana, Karnataka, West Bengal, Uttarakhand and Goa for the public sector banks. Of these states, except for Goa, the bank credit to the power generation sector has the largest share. In case of private sector banks, power generation, however, exceed the other two only in case of Delhi, Jharkhand and Maharashtra, among the states that exceed the national average. From the above charts, it may be assessed that the direct exposure of the banking sector to the 3 -fossil fuel-based industries may not be alarming, considering that the combined share of electricity generation, chemical products and automobile in total bank credit is around 10 per cent for public sector banks and around 9 per cent for the private sector banks. The exposure of the banking sector has so far been very limited to alternative sources of energy. At the all-India level, only about 8 per cent of the bank credit deployed in the electricity industry is towards the non-conventional energy production (Figure 10). The ratio varies from 17 per cent in Punjab to 0.1 per cent in Odisha. Although, the share of non-conventional energy in utility sector credit is higher for the private sector banks (14.8 per cent), it is only 5.2 per cent in public sector banks (Table 2).
| Table 2: Bank credit outstanding to the non-conventional energy as on March 2020 | | | Public Sector Banks | Pvt. Sector Banks | Other Banks | | Amount outstanding (INR Cr.) | 21,655 | 12,302 | 2,586 | | As % of utility sector credit | 6.2% | 11.9% | 27.1% | | As % of total bank credit | 0.5% | 0.5% | 0.7% | Note: Utility=Electricity, gas and water supply.
Source: BSR, RBI., Authors’ calculations. | V.2 Bank Credit: Indirect Impact The previous section discusses the exposure of the banking sector to the power sector, chemicals and the automobile sector. Any change in policy regarding fossil fuel usage will have direct impact, as it is one of the crucial inputs, for these three sectors. However, almost all sectors in the economy are indirectly exposed to fossil fuel by virtue of using electricity, petrol/ diesel, coal in their production processes. In India, 62.2 per cent of the total electricity generated is sourced from fossil fuel (the rest from renewable/ non-fossil sources)9. The indirect exposure of various industries to fossil fuel has been discussed in section III(a). In the present section, we analyse the sectoral sensitivity of banks to this indirect exposure through interest coverage ratio and GNPA ratios. The sectors which have high input intensities of fossil fuel through indirect exposure are cement, basic metals, paper products, and textiles (figure 3). We assume that because of a transition to green energy and shifts in input mix, there could be some pressure on input costs in these sectors in the short-term. Depending on the market structures and pricing-power, this increase in cost could be transferred to the end-users or could be borne by the firms. In the second scenario, the EBITA of the representative firm could take a hit leading to worsening of loan serviceability. This, in turn, could lead to an increase in GNPA ratio of such sectors. Figure 11 plots the interest coverage ratio (ICR) and existing GNPA ratios of different sectors. On the whole, there is a need to closely monitor all such industries that have low ICR, high GNPA ratio and high energy input intensity to prevent spillover to the broader banking sector. VI. Conclusions To assess the potential risks to financial stability posed by climate change and various policy responses, this article examines Indian banks’ direct and indirect exposure to fossil fuels. It observes that the combined share of outstanding bank credit held by the three sectors directly exposed to fossil fuels, namely electricity, chemicals, and automobile, is low for both the public and private sector banks. Numerous other industries, on the other hand, are indirectly dependent on fossil fuels and account for a sizable portion of bank credit. Some of these have a low ICR and a high GNPA ratio at the moment, and thus may require close monitoring during the transition to green energy. References: Dilip, A. and Kundu, S. (2020), “Climate Change: Macroeconomic Impact and Policy Options for Mitigating Risks”, Reserve Bank of India Bulletin, April. Ghosh, S. Nath, J. and Ranjan, A. (2021), “Green Finance in India: Progress and Challanges”, Reserve Bank of India Bulletin, January. Herwadkar, S. S (2017), “Corporate leverage in EMEs: did the global financial crisis change the determinants?”, BIS Working Papers, No 681 IMF (2019), “Fiscal Monitor-How to Mitigate Climate Change”, October, Washington DC, USA. Jain, S. (2020), “Financing India’s Green Transition”, ORF Issue Brief No. 338, January 2020, Observer Research Foundation Krogstrup, S., W. Oman, (2019), “Macroeconomic and Financial Policies for Climate Change Mitigation: A Review of the Literature”, IMF Working Paper, No. 19/185 State of the Economy (2021), Reserve Bank of India Bulletin, December
Annex
|