This article examines the trends in classification of assets and liabilities by Non-Banking Financial Companies (NBFCs) in terms of their fair value hierarchies, as evidenced in the financial statements published by these companies in the Ind AS format. Ind AS has introduced the disclosure of fair value hierarchy of even those assets/liabilities which are not normally measured at fair value, to reflect the extent of illiquidity. More specifically, the article looks at Level 3 assets which are considered as highly illiquid and their proliferation in financial statements of such companies. Notably, the article observes a fair degree of overlap between Level 2 and 3 hierarchies for NBFCs. 1. Introduction An important accounting development in current times is the application of the Indian Accounting Standards (Ind AS), which are in tune with globally accepted reporting standards, namely International Financing Reporting Standards (IFRS), to the financial statements of the Indian corporate sector and non-banking financial companies (NBFCs) regulated by the Reserve Bank of India (RBI). An essential element of Ind AS is the application of the concept of fair value for the valuation of assets and liabilities. This article focuses on Ind AS 113 which deals with fair value-measurement of assets and liabilities and its implications for NBFCs. The Fair Value of an asset is usually determined by the market and hence subject to fluctuations. It also almost offers the best price that an asset would fetch if sold in an equitable market or supplies the best estimate of what needs to be paid to extinguish a liability currently, that is the ease with which they can be liquefied (asset) or liquidated (liability). Historical costs are baulked upon in current times, since they represent acquisition costs and may perhaps not stand the test of time. As we progress and undertake an in-depth study of Ind AS 113, the standard under IND-AS which deals with the subject of Fair Value and its hierarchy, it would be easy to comprehend why Accounting Standards desire that accountants depict even those assets/liabilities that cannot be fair valued, at the nearest fair or current values they can fetch. Under Ind AS 113, assets and liabilities are classified under three levels - Levels 1, 2 and 3, depending upon the availability of quoted prices and market observable inputs. This article focuses more on Level 3 assets and liabilities, for which there is little or no market activity on the measurement date, making the inputs for such assets and liabilities unobservable. In the immediate aftermath of the Global Financial Crisis of 2008, the search for market prices and the emphasis on “mark to market” aggravated soon into concerns when assets could not find a market price in the global downturn. Evaluation of fair values suffered a huge beating and aspersions were cast on the veracity of matrices and formulae used, internal methodologies adopted to value risky housing assets, which did not find comparable prices. More prominent among these were Level 3 assets that required certain assumptions, estimates and models for determination of fair value. It is, therefore, necessary to understand the rationale behind categorising assets under Level 1, 2 or 3 from the perspective of a prospective investor who desires to subscribe to the capital of an NBFC. Such investors would be interested in the liquidity and solvency of the investee company and this is where adequate justification for such categorisation may become relevant. Such a justification would be significant also for auditors and regulators, particularly as the RBI has made the Liquidity Coverage Ratio (LCR) mandatory for NBFCs. Against, this backdrop, the article attempts to address the following questions: -
Can fair value be determined at all points in time? -
Whether assets that cannot be fair valued come with certain advantages and/or disadvantages? -
Whether cost as a model is appropriate when fair values cannot be measured with respect to available market benchmarks? -
Are companies veering towards certain models (Discounted Cash Flow (DCF), for instance) for determining present value of cash flows from an asset? -
Is there a change in hierarchy of levels on account of a change in business models? -
Are there overlaps between Level 2 and 3 hierarchies and how to resolve such overlaps? -
How apt are disclosures in capturing the essence of Level 3 assets on balance sheets? -
Is there a correlation between the business models of NBFCs and the extent of their Level 3 assets? The article is divided into five sections. Section 1 discusses the methodology for fair value hierarchy followed under Ind AS 113 for classification of assets and liabilities. Section 2 gives details on the sample of NBFCs drawn for the study, while Section 3 discusses the details of the sample used for the study. Section 4 provides the salient findings and Section 5 concludes. 2. Fair Value Hierarchy under Ind AS Fair value under Ind AS 113 is the price that would be received to sell an asset or paid to transfer a liability in an orderly transaction between market participants on the measurement date. The Ind AS classifies assets and liabilities under three levels of fair value hierarchy as illustrated below: 1. Level 1- Financial assets (liabilities) are measured by reference to unadjusted quoted prices in active markets for identical assets (liabilities). 2. Level 2- Fair value is measured using inputs other than quoted prices included within Level 1 that are observable for the asset or liability, either directly (i.e. price) or indirectly (i.e. derived from prices). e.g. Valuation using credit spreads, yield curves. 3. Level 3- Fair value is measured using inputs that are not based on observable market data (unobservable inputs). Instead, fair values are determined using a valuation model based on assumptions that are neither supported by prices from observable current market transactions nor are they based on available market data. e.g. Valuing Unquoted equity shares. Evidently, on account of their illiquidity, Level 3 assets are difficult to measure or value. These assets are not traded frequently, and hence it is difficult to assign a reliable and exact market price to them. 3. Sample of NBFCs Used for the Study For this study, we identified ten NBFCs which published their financial statements by following Ind AS during 2018-19 and 2019-20. A conscious attempt was also made to include different types of NBFCs in our sample. Total asset size of these ten selected NBFCs account for 6.2 per cent of total assets of NBFC sector as at end March 2020. Of these ten NBFCs, five were ‘loan companies’, three ‘investment companies’, one ‘asset finance company’ and one ‘core-investment company’. Subsequent to harmonization of NBFC categories vide RBI circular dated February 22, 2019, these categories of ‘loan company (LC)’, ‘investment company (IC)’ and ‘asset finance company (AFC)’ have been merged into a new category viz. ‘Investment and Credit company (ICC)’. 4. Findings from the Study i. Lack of common forms for disclosures - Though two years have elapsed since these companies started reporting financial information under Ind AS, most of them had not veered around common forms and ways of disclosing information. ii. Use of “cost” as a predominant method for measuring fair value - Ind AS refers to three distinct methods of measuring the fair value: (i) Measurement at cost ie. current replacement cost: (ii) application of certain valuation models based on premises that help in determining expected cash flows and their present value - the most common method being used is the “Discounted Cash Flow” method under this category (also known as income approach); (iii) based on available market values (also known as market approach), which offers a superior measurement of fair values. In our sample, companies were generally seen adopting “historical cost” for fair value measurement of many of their investments. The most prominent among them were unquoted instruments and preference shares. These instruments do not find an easy benchmark against which their values can be compared and hence were valued at cost. More importantly, these were categorised as Level 3 assets in most companies. However, assets/liabilities measured at “historical cost” may need a deeper probe. After all, one of the important prescriptions of Ind AS 113 is that the impact of Level 3 assets on profit and loss/other comprehensive income must be disclosed invariably1. The pitfalls of “cost” model are two pronged. In the absence of adequate market information on comparable products, it may be well-nigh impossible to ascertain whether the fair value of such instruments is above the acquisition cost or below it. Presuming it is below, the investment would actually be non-performing meriting an “impairment provision”; if it is above “cost”, then the company is probably missing out on an important source of profit. Either way it makes sense to probe all Level 3 assets when they are valued at “cost”. iii. Overlap between Level 2 and Level 3 assets- We observed that Level 3 assets could not be studied without referring to and contrasting with Level 2 assets. There was a thin line demarcating the two. The ascription of hierarchy demands that the valuation method is understood adequately. However, the hierarchy level alternated between Level 2 and 3 based on the inputs used2. iv. Need for standardised and clarified disclosures - The extent of the unobservable inputs used decides the fair value hierarchy of assets. For instance, there is some degree of Level 2 determination in using market observable data such as secondary market prices. However, if there are significant unobservable inputs in the form of assumptions in estimation of cash flows that form the basis for estimating the Discount Rate, then it makes assets/liabilities predominantly Level 3. This is more evident in the case of loans (typical “amortised cost” assets) whose fair values are determined on the basis of contractual cash flows discounted using market rates, incorporating the counterparties’ credit risk. We thus see the confluence of two types of inputs - Level 1 or 2 inputs in the form of market rates and Level 3 unobservable inputs that go into determination of credit risk of the counterparty where the entity has to use its own models to arrive at a suitable credit risk spread. The same logic applies to borrowings (liabilities) conversely. Clearly, there is need for standardised and clarified disclosures to understand the valuation methods used by NBFCs. We observed that investment property, which is an asset deployed to earn rental income or held for appreciation of investment, was attributed fair value hierarchies differently by different companies depending on the extent of unobservable inputs that went into the valuation. Investment property was attributed a Level 3 classification as model inputs were extraneous when an external expert or broker valued the property. However, investment property when fair valued as Level 3, recorded a significantly high value. Some companies placed this asset in Level 2 category when observable inputs in the form of market data on corresponding prices of similar property were available. v. Need to understand unobservable inputs for valuation- We observed the need for a thorough analysis and understanding of inputs used in measuring and disclosing Level 3 assets. This was because the ultimate sale price did not necessarily match the price estimated using Level 3 inputs. This raised doubts on the inputs used for such valuation. Hence, the solution is in reviewing the inputs used especially when presumptions are disproved by outcome. It is also necessary to hone the inputs and have supportive evidence for using specific inputs. vi. Discounted Cash Flow method (DCF): Most popular method for valuation of Level 3 assets – DCF method was the most widely used method for Level 3 asset valuation. Most companies used the method to compute fair values of debt securities and other borrowings, which normally do not lend themselves to fair valuation. Details on DCF methodology are offered in Annexure 1. None of the sampled companies made use of any other method, like Adjusted Present Value (APV) method or Weighted Average Cost of Capital (WACC). However, the DCF method is premised significantly on assumptions and hence requires greater disclosures. vii. Shift in fair value hierarchy on account of change in business model3 – There was an interplay of business models prompting companies to shift certain assets/liabilities originally measured at fair value to an “amortised cost” model. To illustrate, it was observed that a few companies categorised loans initially as Fair Value through Other Comprehensive Income (FVOCI) as the business model also envisaged sale of loans though partial assignment. Such loans were, therefore, originally categorised under FV Hierarchy Level 2, based on observable inputs such as market data. It is worth noting that both amortised cost instruments and FVOCI instruments typically have the features of “hold to collect” contractual cash flows, the latter differing precisely on account of an additional factor, that is, “sale of assets”. Subsequently, the companies chose to adopt an amortised cost classification for their loan assets resulting in Level 3 categorisation as it was decided that they would no longer hold the loans for sale (Table 1). 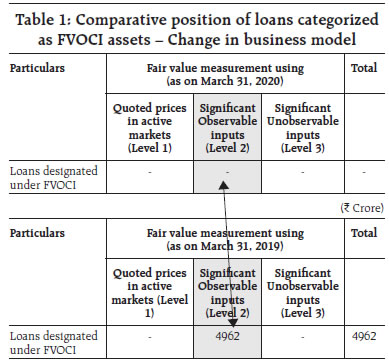 Further, there were a few instances when the companies chose to move the hierarchy from one level to another with a change in the business model. The trends observed under this head can be best understood if we recognise the precise characteristics of financial instruments categorised as “Amortised Cost”, “FVOCI” and those measured at “Fair Value through Profit and Loss (FVTPL)”. The classification and subsequent measurement requirements are summarised in Annexure 2. Thus, we see the emergence of two changes, one in the classification of financial instrument itself, the other in fair value hierarchy. These changes, of course, seemed logical. This is because FVOCI assets are those where fair value changes are normally captured in the Statement of Other Comprehensive Income (and thus can accrete to net worth/equity), while regular interest streams would pass through Profit and Loss Account. The change in business model adopted by the company was understandable as loans would get best represented as amortised cost instruments, more specifically since the company sought to restrict the sale/assignment of such loans. Secondly, a probable shift from Level 2 (loan measured at FVOCI earlier) to Level 3 taking into account the presence of unobservable inputs like expected losses too appeared logical. What was, however, interesting was that the parent holding company continued to classify these loans as FVOCI - Level 2 (Table 2). The question of why some companies in the same group retain one form of classification for the same asset than others is intriguing requiring more in-depth analysis. | Table 2: Parent Company Classification of Level 3 Assets | | (₹ Crore) | | Quantitative disclosures of fair value measurement hierarchy for financial instruments measured at fair value (March 31, 2020) | | Particulars | Data valuation | Fair value measurement using | Total | | Quoted prices in active markets (Level 1) | Significant Observable inputs (Level 2) | Significant Unobservable inputs (Level 3) | | Investments held for trading under FVTPL | March 31, 2020 | 14439 | - | - | 14439 | | Equity instrument designed under FVOCI (unquoted)* | March 31, 2020 | - | - | 262 | 262 | | Equity instrument designed under FVOCI (Quoted) | March 31, 2020 | 150 | - | - | 150 | | Other investments designated under FVOCI | March 31, 2020 | 2765 | - | - | 2765 | | Loans designated under FVOCI | March 31, 2020 | - | 21660 | - | 21660 | | Derivative asset | March 31, 2020 | - | 172 | - | 172 | | | | 17354 | 21832 | 262 | 39448 | | Source: Annual Report of a sampled NBFC - 2019-20 | viii. Subjectivity in attributing levels of hierarchy: Investments under FVTPL were classified under all hierarchies. For instance, equity shares and share premium were classified as Level 3 assets, which indicated that such financial assets were not quoted. Some companies, however, classified them as Level 1 asset, which indicated availability of market data on the same. Hence, a more prudent choice in terms of selection of instruments (more Level 1 or 2) may inspire confidence in liquidity management of such companies (Table 3). Investments held for trading would require to be classified as FVTPL. A significant contributor to Level 3 assets is “Security Receipts (SRs)”. The cash flows in respect of these are dependent on recoveries from underlying Non-Performing Assets (NPAs). As this involves some empirical estimates in the wake of past performance, it could explain the mix of Level 2 and 3 inputs. However, most companies placed them under Level 2 hierarchy. RBI’s guidance on the subject of valuation of SRs (Guidelines on declaration of Net Asset Value of SRs issued by Securitisation Company/ Asset Reconstruction Company) recognises that these are not easy to value as they combine elements of equity as well as debt and are usually privately placed and unlisted. Further, these should ideally be rated such that the rating is able to reflect present value of anticipated cash flows from underlying assets. ix. Details on the classification of certain types of asset and liabilities under Level 3: Loans have their own peculiarities in the form of credit risk profile of the borrowers, extent of non-performance and elements of default risk, which may be unique to each borrower. Therefore, they cannot be benchmarked with any known debt with similar characteristics, thereby necessarily falling under Level 3. Similarly, short-term assets/liabilities are classified as Level 3 assets. These include trade receivables, which do not lend themselves to any plausible method of fair valuation (Table 4). The same logic holds also for short term liabilities. | Table 3: Distribution of assets by Hierarchy | | (₹ Crore) | | Particulars | As at March 31, 2020 | As at March 31, 2019 | | Level1 | Level2 | Level3 | Total | Level1 | Level2 | Level3 | Total | | Financial assets | | | | | | | | | | 1. Investments at FVTPL: | | | | | | | | | | Equity shares (including share application money) | 3 | - | 475 | 478 | 8 | - | 477 | 485 | | Preference shares | - | - | 89 | 89 | - | - | 100 | 100 | | Mutual fund | 745 | | | 745 | 2064 | - | - | 2064 | | Government securities | - | 1 | - | 1 | - | 1 | - | 1 | | Debentures | - | - | 860 | 860 | - | - | 866 | 866 | | Security receipt | - | - | 2499 | 2499 | - | - | 791 | 791 | | Units of fund | - | - | 106 | 106 | - | - | 189 | 189 | | 2. Derivative financial instruments | - | 155 | - | 155 | - | 7 | - | 7 | | 3. Loans | - | - | 24878 | 24878 | - | - | 24396 | 24396 | | 4. Investments at FVTOCI: | - | - | - | - | - | - | - | - | | Debentures | - | 1162 | - | 1162 | - | 2265 | - | 2265 | | Government securities | - | - | - | - | - | 38 | - | 38 | | Pass through certificates | - | - | 7 | 7 | - | - | 8 | 8 | | Equity shares | 32 | - | - | 32 | - | - | - | - | | Units of fund | - | 1 | - | 1 | - | 1 | - | 1 | | Total financial assets | 780 | 1319 | 28914 | 31013 | 2072 | 2312 | 26827 | 31211 | | Source: Annual Report of a sampled NBFC, 2019-20. |
| Table 4: Classification of Short-Term Liabilities/Assets as Level 3 | | (₹ Crore) | | Fair value of financial instruments not measured at fair value (March 31, 2020) | | Fixed assets | Carrying value | Fair value measurement using | Total | | Quoted prices in active markets (Level 1) | Significant Observable inputs (Level 2) | Significant Unobservable inputs (Level 3) | | Cash and cash equivalents | 675 | 675 | - | - | 675 | | Bank balances other than cash and cash equivalents | 5 | 5 | - | - | 5 | | Trade receivables | 867 | - | - | 867 | 867 | | Loans | 113417 | - | - | 114211 | 114211 | | Investments | 20 | - | - | 20 | 20 | | Other financial assets | 350 | - | - | 350 | 350 | | | 115333 | 679 | - | 115449 | 116128 | | Source: Annual Report of a sampled NBFC 2019-20. | Furthermore, a somewhat analogous position is seen on the liability side as well with “deposits” categorised as Level 2 liabilities (Table 5), while in few cases these are shown as Level 3 liabilities. This is interesting because the fair value of fixed maturity deposits can be ascertained from rates for similar deposits with similar maturities. Going forward, it would be worth examining what unobservable inputs contribute to Level 3 categorisation in deposits. | Table 5: Deposits Classified as Level 2 liabilities | | (₹ Crore) | | Item | Carrying amount | Fair value measurement using | Total | | Quoted prices in active markets (Level 1) | Significant Observable inputs (Level 2) | Significant Unobservable inputs (Level 3) | | Financial assets | | | | | | | Cash and cash equivalents | 675 | 675 | - | - | 675 | | Bank balance other than above | 5 | 5 | - | - | 5 | | Trade receivable | 867 | - | - | 867 | 867 | | Loans | 113417 | - | - | 113211 | 113211 | | Investments | 20 | - | - | 20 | 20 | | Other financial assets | 350 | - | - | 350 | 350 | | Total financial assets | 115334 | 680 | - | 115448 | 116128 | | Financial liabilities | | | | | | | Trade Payables | 637 | - | - | 637 | 637 | | Other payables | 179 | - | - | 179 | 179 | | Debt securities | 41714 | - | 42333 | - | 42333 | | Borrowings other than debt securities | 36923 | - | - | 36923 | 36923 | | Deposits | 21427 | - | 21502 | - | 21502 | | Subordinated debts | 4142 | - | 4351 | - | 4351 | | Other financial liabilities | 670 | - | - | 670 | 670 | | Total financial liabilities | 105692 | - | 68186 | 38409 | 106595 | | Source: Annual Report of a sampled NBFC - 2019-20 |
| Table 6: Assets/Liabilities with Multiple Hierarchies - debt securities | | (₹ Lakhs) | | Item | Carrying amount | Fair value measurement using | Total | | Quoted prices in active markets (Level 1) | Significant Observable inputs (Level 2) | Significant Unobservable inputs (Level 3) | | Financial liabilities | | | | | | | Trade Payable | 10.22 | | | 10.22 | 10.22 | | Debt securities | 150 | 150 | | | 150 | | Borrowings other than debt securities | 1912.30 | | | 1912.30 | 1912.30 | | Other financial liabilities | 28.55 | | | 28.55 | 28.55 | | Total financial liabilities | 2101.07 | 150 | | 1951.07 | 2101.07 | | Source: Annual Report of a sampled NBFC - 2019-20 | Debt securities, by nature, lend themselves to fair valuation based on market data. This is apparent since many companies ascribed Level 1 or 2 characteristic to them (Table 6). Normally, loans to employees are at rates below market rates and therefore their fair value must be measured by discounting the cash flows at the market rate for a comparable loan (Table 7). However, a few companies valued loans to employees at carrying amounts and treated the same as fair value (Level 3). | Table 7: Valuation of Employee Loans | | (₹ Lakhs) | | Item | Carrying amount | Fair value measurement using | Total | | Quoted prices in active markets (Level 1) | Significant Observable inputs (Level 2) | Significant Unobservable inputs (Level 3) | | Financial assets | | | | | | | Cash and cash equivalents | 46.34 | 46.34 | - | - | 46.34 | | Bank balance other than above | 8.24 | 8.24 | - | - | 8.24 | | Trade receivable | 1.77 | - | - | 1.77 | 1.77 | | Loans | | | | | | | Loans to employees | 0.43 | - | - | 0.43 | 0.43 | | Loans – SME & CF | 3055.23 | - | - | 3055.23 | 3055.23 | | Investment in subsidiaries – Equity shares | 175 | - | - | 175 | 175 | | Other financial assets | 1.61 | - | - | 1.62 | 1.61 | | Total financial assets | 3288.62 | 54.57 | - | 3234.05 | 3288.62 | | Financial liabilities | | | | | | | Trade Payable | 10.22 | - | - | 10.22 | 10.22 | | Debt securities | 150 | 150 | - | | 150 | | Borrowings other than debt securities | 1912.30 | - | - | 1912.30 | 1912.30 | | Other financial liabilities | 28.55 | - | - | 28.55 | 28.55 | | Total financial liabilities | 2101.07 | 150 | - | 1951.07 | 2101.07 | | Source: Annual Report of a sampled NBFC - 2019-20. | x. Multiple Fair Value Hierarchy in Mutual Fund Investments: We observed two groups of mutual funds, one that received a Level 1 attribute and the other categorised under Level 3 (Table 8). When the investment was in an unlisted open-ended fund, determination of fair value of such investment would require certain adjustments to Net Asset Values (NAV) of similar funds. In such cases, the inputs led to a Level 3 hierarchy. xi. Extent of correlation between Level 3 assets and business model – We ascertained whether companies with similar business models had similar patterns of holding Level 3 assets. The results are summarised in Table 9. Table 9 indicated the following: i. Investment and Credit Companies had a significant quantum of Level 3 assets. ii. In the case of ICCs with predominantly investments, we observed a mixed pattern with some entities having high proportions of Level 3 assets, while others having very low proportions. This may suggest that the companies having low proportions of Level 3 assets would prefer more marketable securities and may not be too keen on illiquid investments. | Table 8: Classification of Mutual Funds | | (₹ Lakhs) | | Particulars | Fair value hierarchy | March 31, 2020 | March 31, 2019 | | Financial assets | | | | | Derivatives | Level 1 | 81.92 | 75.28 | | Investments | | | | | Mutual funds | Level 1 | 1884.22 | 352.69 | | Mutual funds | Level 3 | 1 | - | | Alternate investment funds | Level 1 | 131.88 | 105.13 | | Equity instruments | Level 2 | 0.19 | 0.14 | | Preference securities | Level 3 | 2.98 | - | | Note: Fair value is estimated based on the market inputs for the classification as per Level 2 and Level 3 |
| Table 9: Quantum of Level 3 Assets – in different types of NBFC | | (₹ Crore) | | Name of the NBFC | Type of NBFC | Quantum of Level 3 assets | Total Assets | Percentage of Level 3 assets to total assets | | 1) NBFC 1 | CIC | 28,914 | 31,012 | 93% | | 2) NBFC 2 | IC | 262 | 39,447 | 0.66% | | 3) NBFC 3 | LC | 0.95 | 1827 | 0.05% | | 4) NBFC 4 | AFC | 28,264 | 28,825 | 98% | | 5) NBFC 5 | IC | 526 | 7,963 | 7% | | 6) NBFC 6 | LC | 3,234 | 3,289 | 98% | | 7) NBFC 7 | LC | 6,443 | 7,101 | 91% | | 8) NBFC 8 | IC | 13,836 | 22,260 | 62% | | 9) NBFC 9 | LC | 3 | 54826 | # | | 10) NBFC 10 | LC | 262 | 15135 | 1.73% | | # Almost zero per cent, hence negligible | iii. A few NBFCs did not present the fair value hierarchy for assets/liabilities whose carrying amounts were deemed to be their fair values. A correct representation of assets/ liabilities and their fair values hierarchies may be difficult unless disclosures are made uniform. In the absence of such uniformity, it would not be worthwhile to compare the extent of Level 3 assets/liabilities present in various financial statements. 5. Conclusions The salient findings emerging from the scrutiny of the annual reports of select NBFCs are summarised as follows: a. Disclosing valuation methods: Confidence in Level 3 valuation can be buttressed through better disclosures. Till such disclosures are put in place, auditors and supervisors will have to evaluate the assumptions under various valuation methods, such as DCF more keenly. There is also a need to try models other than DCF. In fact, the Ind AS 113 does not mandatorily recommend a specific technique or model. b. Analysis of unobservable inputs: Going forward, a list of unobservable inputs that are used for valuing assets or liabilities may be recommended. This will help in standardisation of inputs and reduce subjectivity. This may also pave the way for suitable regulatory or audit guidance on the subject. c. Overlap between Level 2 and 3 hierarchies: It was apparent that the demarcation between Level 2 and 3 hierarchies was very thin. Significant unobservable inputs while valuing assets would invariably lead to Level 3 hierarchy. d. Deeper probe into Level 3 items: It would also be worth examining whether companies placing certain assets under Level 3 hierarchy do so wilfully to escape “marking to market”. This seems probable as assets like investment property when subjected to Level 3 evaluation post significantly large values as compared to their carrying amounts. e. Presentation and disclosures: There is a compelling need for consistency in presentation and disclosures with regard to Level 3 assets/liabilities. The following inferences can be specifically drawn in this regard: i. Additional disclosure on Level 3 assets should be provided in respect of those assets/liabilities which are normally not subjected to fair value measurement. This will enable arriving at a notional value of illiquidity present in financial statements. ii. Presentation of most matters that are financial, involve three things – (i) the recognition of the financial element, (ii) its measurement and (iii) disclosure. While all three could be deemed to be equally significant, analysis of the sampled NBFCs reveals that “disclosure” may be more important. f. Auditor’s role: The role of auditors can be leveraged better if they independently comment on whether the valuation of Level 3 assets, the FV hierarchy of various assets, as reported by the companies are fair and appropriate. In fact, considering what International Audit Standards pronounce under ISA 200, all discerning auditors would, on their own, want to dilute the “audit risk” by collecting as much audit evidence on Level 3 assets as possible.
Annexure 1:
Discounted Cash Flow (DCF) for Determining Fair Value a. Many companies use the DCF method for determining fair value of unquoted instruments. Certain companies adopt this method to compute fair values of asset items like loans and liability items such as debt securities and other borrowings. b. Fair values of assets, for example are estimated by discounting expected future cash flows using an appropriate discount rate. d. The effectiveness of DCF for identifying fair value of an asset has been best summarised by Penman in 2009 – “When it comes to unobservable inputs, one of the options that companies have when it comes to reporting fair value in accordance with the Level 3 fair value accounting is discounted free cash flows (DCF). The problem that has been discussed surrounding fair value accounting is that the calculations in Level 3 are based on estimates. However, disclosures are in place with the new IFRS 13 to reduce the risk for investors and other users of financial statements when they are making their investors”. Incidentally, Ind-AS 113 is almost identical to IFRS 13 and refers to DCF as the ‘Present Value’ method.
Annexure 2:
Classification of Financial assets (liabilities) under Ind AS a. If the financial asset is held for collecting contractual cash flows only, say, receivables, loan, such financial assets are recognised at “amortised cost”, provided that such cash flows are in the form of principal and/or interest. Financial assets that are normally measured at “amortised cost” are fixed income instruments held till maturity; these are not for sale. b. If financial assets meeting the cash flow test of amortised cost are held for collecting contractual flows of cash as above and for selling the asset ultimately, such assets are recognised at “Fair Value through Other Comprehensive Income (FVOCI)”. c. Financial Assets that do not fall under either of the above categories, are classified as Fair Value though Profit and Loss (FVTPL). d. Even if an instrument meets the requirements to be measured at amortised cost or FVOCI, Ind AS 109 gives the option to designate at initial recognition, the financial asset as FVTPL, if doing so eliminates or significantly reduces, a measurement or recognition inconsistency (‘accounting mismatch’). e. An entity has an irrevocable option to classify at initial recognition, an equity instrument as FVOCI. f. Financial liabilities held for trading are classified as FVTPL and all other financial liabilities are measured at amortised cost unless the fair value option is applied.
|