The Indian economy consolidated its recovery, with most constituents surpassing pre-pandemic levels of activity. Heightened global risks stemming from weakening growth, elevated inflation, supply disruptions on account of geopolitical spillovers and financial market volatility stemming from synchronised monetary tightening pose near-term challenges. Introduction Clouds of geopolitical conflict in Europe shroud global economic prospects, with risks slanted down. Commodity prices remain volatile at elevated levels, and supply chain disruptions got worsened. Inflation pressures have heightened across geographies, and central banks are aggressively tightening monetary policy and liquidity conditions. As financial conditions become adverse in response, financial markets are unsettled and volatile, with emerging market economies (EMEs) facing the brunt of a surge in risk-averse sentiments among global investors. This is triggering capital outflows and currency depreciations amidst losses of reserves. EMEs face the risk of their hesitant and incomplete recoveries stifled which in turn can spill back on to the prospects for the broader global recovery. Reflecting these developments, the International Monetary Fund (IMF) in its April 2022 release of the World Economic Outlook (WEO) cut its global growth forecast for 2022 relative to its January 2022 projection by 0.8 percentage points (ppts) to 3.6 per cent. The downward revision is sharper for emerging market and developing economies (EMDEs) than for advanced economies (AEs). Inflation is expected to surge to 5.7 per cent and 8.7 per cent in 2022 for AEs and EMDEs, respectively, higher by 1.8 ppts and 2.8 ppts, respectively, from the January 2022 update. In this hostile international environment, the Indian economy consolidated the path of recovery. Activity in contact-intensive services is gaining traction, and consumer confidence is inching up to its highest level since the outbreak of the pandemic. An uptick in economic activity in April 2022 is evident in high frequency indicators. With the tapering down of infections, mobility indicators have improved while labour participation is picking up in both urban and rural constituents. Revenue collection under the goods and services tax (GST) stood at ₹1.68 lakh crore in April 2022 – the highest in its history. The headline manufacturing purchasing managers’ index (PMI) remained in the expansionary zone in April 2022, with most companies recording an acceleration in new orders and production. With demand gaining traction amidst rising mercury levels, electricity generation recorded double-digit growth during the month, even though coal supply shortages led to disruptions. New business, increasing demand and a renewed increase in employment led to the headline services PMI hovering in expansionary territory for the ninth consecutive month. On the external front, merchandise exports stood robust at US$ 40.2 billion in April 2022, thereby remaining well above the US$ 30 billion mark for the past fourteen months in succession. Amidst these developments, inflation pressures became increasingly generalised across commodity groups in the April 2022 print of the consumer price index (CPI) resulting in a sharp spike in headline inflation to 7.8 per cent – well above the upper tolerance band. In an off-cycle meeting held on May 4, 2022 the Monetary Policy Committee (MPC) decided unanimously to increase the policy repo rate by 40 bps to 4.40 per cent with immediate effect. The standing deposit facility (SDF) and the marginal standing facility (MSF) rates were symmetrically adjusted to 4.15 per cent and 4.65 per cent, respectively. Furthermore, the Reserve Bank also decided to increase the cash reserve ratio (CRR) by 50 bps to 4.50 per cent (effective fortnight beginning May 21, 2022), withdrawing liquidity to the tune of ₹87,000 crore from the banking system. These measures reinforced the emphasis on withdrawal of accommodation in the policy stance. The MPC highlighted that volatile international crude oil prices, renewed lockdowns and supply chain disruptions impart significant upside risks to the inflation trajectory set out in the April 2022 meeting of the MPC. The MPC also felt that it is important to contain the second-round effects of inflation and anchor inflation expectations effectively to preserve the resilience and momentum of growth while according primacy to the price stability mandate at this juncture. The swift response of the MPC demonstrates a resolute commitment to price stability which bodes well for the credibility of monetary policy. Governor Shri Shaktikanta Das emphasised that the Reserve Bank remains “steadfast in our commitment to contain inflation and support growth. Inflation must be tamed in order to keep the Indian economy resolute on its course to sustained and inclusive growth. The biggest contribution to overall macroeconomic and financial stability as well as sustainable growth would come from our effort to maintain price stability”.1 Set against this backdrop, the remainder of the article is structured into four sections. Section II captures the rapidly evolving developments in the global economy. An assessment of domestic macroeconomic conditions is presented in Section III. Section IV reviews financial conditions in India, while the last Section concludes the article. II. Global Setting The global economic outlook is overcast with downside risks due to the ongoing geopolitical upheaval and its impact on trade, output and prices. As per the World Bank’s latest Commodity Markets Outlook, a sharp increase in most commodity prices is forecast through 2022 and further into the medium-term. A significant tightening of financial conditions due to frontloaded monetary policy actions, and high inflation are posing financial stability concerns. Downside risks to global growth are also amplified by outbreak of infections and lockdowns in some parts of the world. Uncertainty around the evolution of the pandemic continues to prevail. 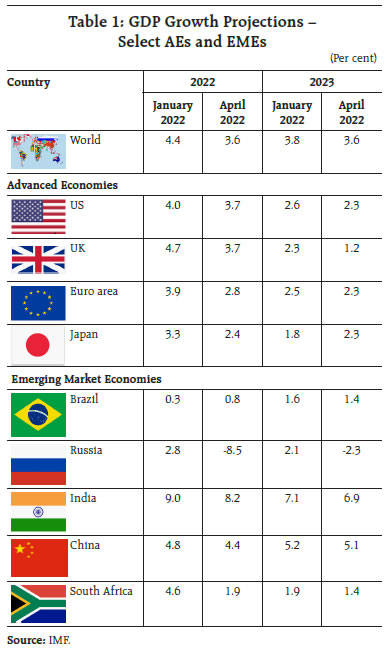
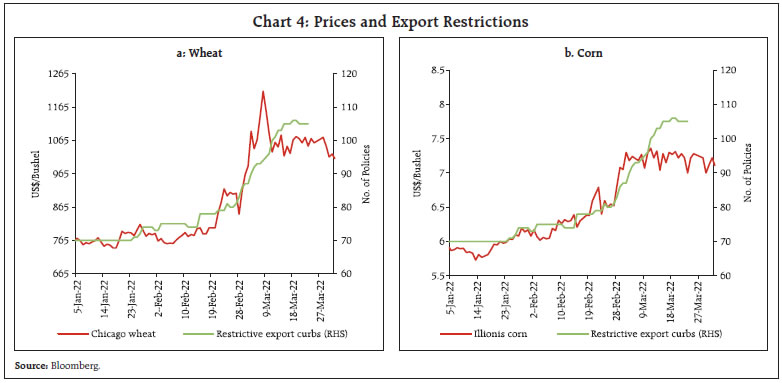
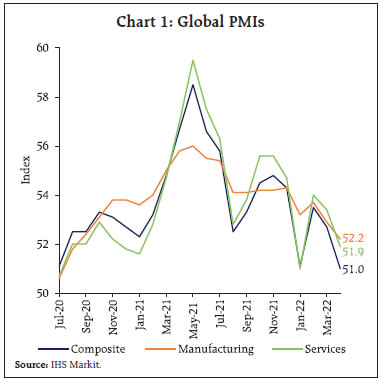 Among high frequency indicators, the global composite purchasing managers’ index (PMI) plummeted to a 22-month low of 51.0 in April from 52.7 a month ago as growth of new orders slowed, and business optimism slipped to a 19-month low (Chart 1). Both services and manufacturing PMIs eased, with the latter slipping to a 20-month low with manufacturing output contracting for the first time since June 2020. The decline in output mainly reflected lockdowns in China. The global manufacturing output index excluding China registered a marginal improvement over March. On the trade front, the World Trade Organization (WTO) scaled down its projection for merchandise trade volume growth for 2022 to 3.0 per cent from 4.7 per cent projected earlier, following the Russia-Ukraine conflict and lockdowns in China disrupting seaborne trade. In the April WEO, the IMF also slashed the projection for growth in world trade volume of goods and services to 5.0 per cent in 2022 and 4.4 per cent in 2023 – a full percentage point lower for 2022 and half a percentage point for 2023 relative to its January 2022 projections. Monthly data show some positive momentum but the weakest in five months (Chart 2a). The Baltic Dry Index, a measure of shipping charges for dry bulk commodities, remained volatile and increased by 2 per cent in April (Chart 2b). 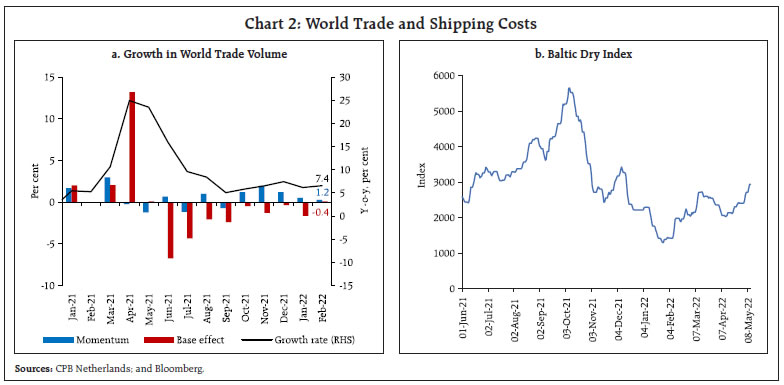 The Bloomberg commodity price index continued its ongoing surge, hitting an 8-year high in mid-April (Chart 3a). Crude oil prices retreated from a recent peak, as concerns about slowing world economic growth including in major economies such as China outweighed fears of further supply disruptions (Chart 3b). Nonetheless, crude prices have marked a 37.6 per cent gain year to date (up to May 12, 2022). Plans to phase out Europe’s crude oil dependence on Russia in six months led to further pressure on prices in early May. Gold prices faced headwinds as bond yields hardened and the US dollar traded stronger, whereas safe haven and inflation hedge demand provided support to the bullion, resulting in range-bound movements (Chart 3c). The Food and Agriculture Organization (FAO) food price index retreated marginally to 158.5 in April from the all-time high registered in March due to moderation in vegetable oil and cereals prices while continuing to exhibit acceleration for sugar, meat and dairy prices (Chart 3d). The prolonged Russia-Ukraine conflict has led to a number of export restrictions in several countries which contributed to high food prices, particularly of wheat and corn (Chart 4). Inflation has soared to multi-decadal highs for most economies (Chart 5). The US CPI inflation, however, marginally eased to 8.3 per cent in April 2022 from 8.5 per cent a month ago with the monthly momentum of 0.3 per cent – the lowest since August 2021 as energy prices declined by 2.7 per cent (m-o-m). On the other hand, the personal consumption expenditure (PCE) price index firmed up to a 40-year high of 6.6 per cent in March. CPI inflation in the UK surged to 7.0 per cent in March, the highest in the data series, with the largest contribution of 1.83 ppts from the transport component. Euro area annual inflation reached a new peak of 7.5 per cent in April primarily driven by energy and followed by food, alcohol and tobacco. Among BRICS economies, inflation in China rose to a five-month high of 2.1 per cent in April as supply pressure worsened due to widespread lockdowns (Chart 5b). 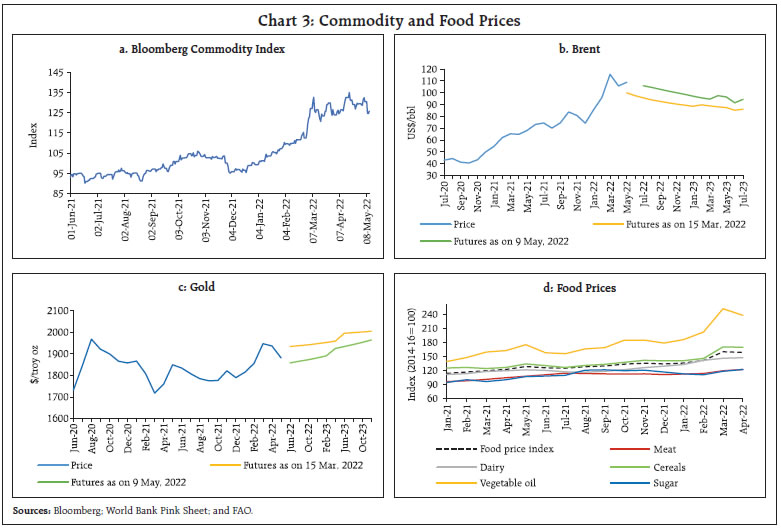
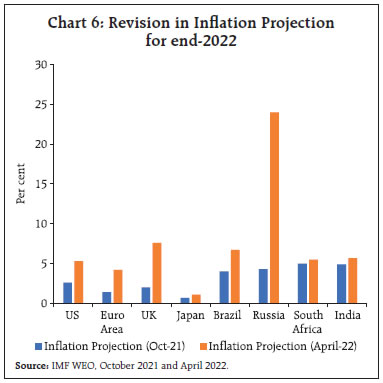
 Inflation projections have been raised substantially for most economies. The IMF in its April 2022 WEO has revised up inflation projections for end 2022 for major AEs and Russia by a much larger magnitude than for emerging economies, including India (Chart 6). 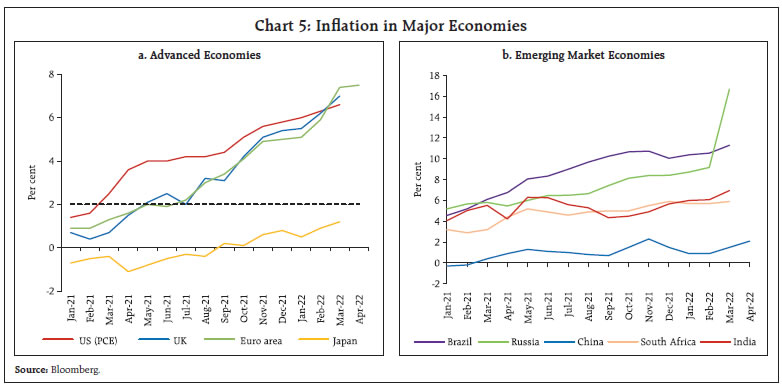
 Global financial markets have seen sharp sell-offs since the beginning of April as uncertainty regarding the pace of unwinding by major central banks, particularly the US Fed, along with mounting growth concerns rattled investor sentiments. The MSCI World Equity Index fell 8 per cent in April with declines in both AE and EME stock indices (Chart 7a). In the bond markets, the US 10-year treasury yield hardened to a 3-year high as the market priced in more aggressive Fed tightening than previously anticipated. Furthermore, short term rates have also leaped simultaneously, resulting in a flatter yield curve (Chart 7b). The US dollar continued strengthening, hitting multi-decadal highs in response to the Fed’s hawkish stance. Other currencies depreciated on country-specific factors with the yen sliding to a 20-year low (Chart 7c). Most EME currencies depreciated, with net capital outflows exacerbating the downtrend (Chart 7d). 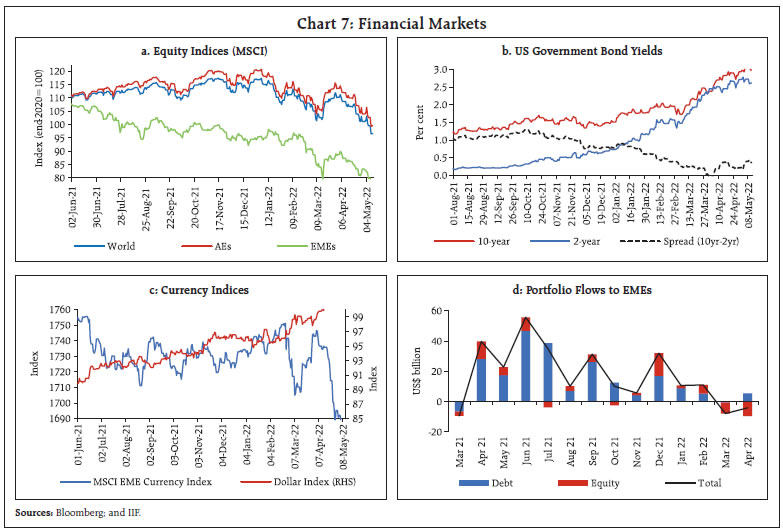 Monetary policy actions and stances appear to be synchronising across countries, with more AE and EME central banks undertaking rate hikes. In line with market expectations, the Federal Reserve raised the target range of the Federal Funds rate by 50 bps to 0.75-1.0 per cent, the first 50 bps hike since May 2000. In his opening remarks at the press conference, Chairman Powell mentioned that “an additional 50 basis point increase should be on the table at the next couple of meetings”. The Fed also unveiled plans for reducing the size of the balance sheet by reduction in its holdings of treasury securities, agency debt and agency mortgage-backed securities (MBS) from June 1. The Bank of England also raised its policy rate by 25 bps to 1.0 per cent – the highest since February 2009 taking the cumulative increase to 90 bps in its current tightening cycle which started in December 2021. The Bank of Canada and the Reserve Bank of New Zealand raised their policy rates by 50 bps each in April to 1.0 per cent and 1.5 per cent, respectively. The Bank of Korea also raised its benchmark interest rate by 25 bps while the Monetary Authority of Singapore tightened monetary policy for the third time in six months. The Bank of Japan is a rare AE central bank that has maintained a dovish stance, reinforcing its yield curve control by committing to daily purchases of Japanese government bonds at 0.25 per cent yield in its latest meeting. Most EME central banks have continued with policy tightening including Brazil, Poland and Peru hiking their benchmark rates by 250 bps, 375 bps and 200 bps respectively in 2022 so far. The Central Bank of Sri Lanka also raised its key rate by an unprecedented 700 bps to 14.5 per cent in April. On the other hand, the Bank of Russia reduced its policy rate by a cumulative 600 bps to 14 per cent in April as price and financial stability risks eased. The People’s Bank of China reduced the reserve requirement ratio by 25 bps, injecting 500 billion renminbi (approximately US$ 78 billion) of liquidity to boost the economy and kept other interest rates unchanged in its April meeting (Chart 8).  To sum up, downside risks to global growth have increased alongside upside risks to global inflation rising the spectre of stagflation in several countries. For EMEs, the outlook is fragile, and employment and output could remain below pre-pandemic levels through 2026 reflecting deep scarring. III. Domestic Developments Domestic macroeconomic conditions continued to gain strength as activity started to normalise in spite of a pick-up in COVID-19 infections in some parts of the country since the second fortnight of April (Chart 9a). Over 86 per cent of the adult population (81 crore) is fully vaccinated and total vaccination doses crossed 190 crore as on May 10, 2022 (Chart 9b). Over 4.3 crore children in the 15–18 year age group are fully vaccinated, while 3.1 crore children in the 12-14 year age group have been inoculated with the first dose. Precautionary doses of COVID vaccines are being made available to all those who are more than 18 years of age and have completed 9 months after the administration of the second dose. Living with COVID is becoming the norm. While the initial lockdown and the first and second waves of COVID dented economic activity, the third wave and the recent spurt in infections has had a relatively benign impact on overall economic activity (Chart 10a). The decoupling is also visible in movement of people, with google mobility rising beyond baseline pre-pandemic figures for most activities in April. While mobility around grocery, pharmacy and parks were above 50 per cent over the baseline numbers, mobility around residential units hovered just above the baseline metric, perhaps due to the work-from-home/hybrid models of work increasingly adopted by India Inc. (Chart 10b). Reflecting these developments, consumer sentiment improved at the all-India level with wide variations across states (Chart 11).
Aggregate Demand Signs of recovery in overall demand conditions broadened. Total E-way bills generation in April 2022 was about 43 per cent higher than in April 2019 (Chart 12a). Toll collections increased on account of the pick-up of volumes while the hike of 10-15 per cent in national highway tolls starting April 1, 2022 led to a faster growth in value terms (Chart 12b). Fuel consumption faced headwinds from successive price hikes between March 22 to April 16 with petrol and diesel prices cumulatively increasing by ₹10 per litre. The impact of fuel inflation was recorded across categories of diesel, petrol and aviation turbine fuel (ATF) consumption (Chart 13a). Semiconductor shortages, high metal prices and lockdown in China lengthened waiting times for passenger vehicles in April 2022. Consequently, domestic sales of passenger vehicles moderated, albeit normalising over pre-pandemic baseline (1.6 per cent higher than in April 2019; Chart 13b). Retail sales of automobiles stagnated, with registrations for transport vehicles dragging. Over pre-pandemic levels of April 2019, registrations continued to contract (Chart 13c). Vehicle registrations in Karnataka and Uttar Pradesh surpassed their pre-pandemic levels (Chart 13d). Rural demand strengthened with the farm sector anticipating normal monsoons, and tractor sales recorded an expansion by 55.5 per cent over April 2019. Two-wheelers and motorcycles sales stagnated, while three-wheelers declined, indicating a skewed recovery in the general rural sector (Chart 13e). As per the household survey of the Centre for Monitoring Indian Economy (CMIE), the labour participation rate increased from 39.5 per cent in March to 40.2 per cent in April. The employment rate (worker population ratio) also improved to 37.1 per cent in April from 36.5 per cent a month ago. The entire increase in the labour force was not, however, absorbed into employment, leading to a rise in the unemployment rate from 7.6 per cent last month to 7.8 per cent (Chart 14a). Though most States continue to record employment rates below their pre-pandemic levels, Maharashtra, Odisha and Telangana have shown a remarkable recovery, surpassing their pre-pandemic employment rates (Chart 14b). The CMIE’s employment statistics show that the total number of employed workers increased by 7.2 million (m-o-m) and 12.2 million (y-o-y), respectively, in April 2022 surpassing pre-pandemic levels (Chart 15a). The labour force participation rate (LFPR) increased for most states in April 2022 compared to the preceding month; however, it is still below pre-pandemic levels in many states (Chart 15b). PMI employment index in the manufacturing sector improved further in April after an expansion in March following three months of contraction. In the services sector, employment reverted to expansion in April after four successive months of contraction (Chart 16).
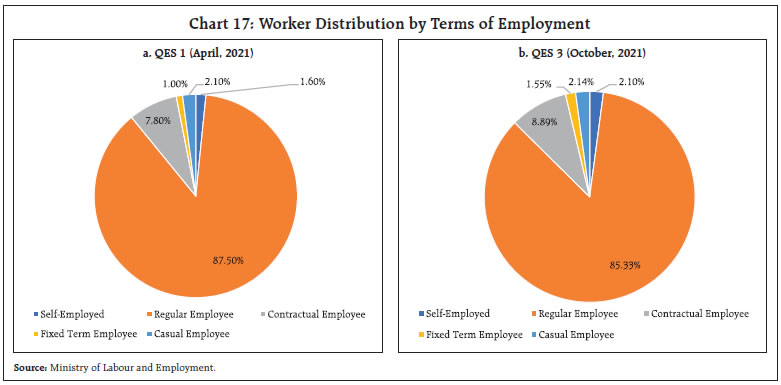
The Ministry of Labour and Employment released the third edition of its Quarterly Employment Survey (QES) on April 28, 2022. Between April and October 2021, the estimated number of total workers in the nine organised sectors2 which are covered by the Survey3 increased from 3.08 crores to 3.14 crores. The shares of contractual employees, fixed term employees and self-employed in the total employment have increased while the share of regular workers has come down from 87.5 per cent to 85.3 per cent (Chart 17). 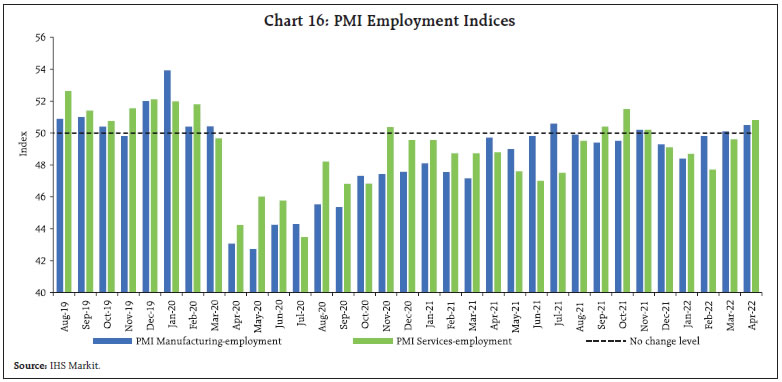
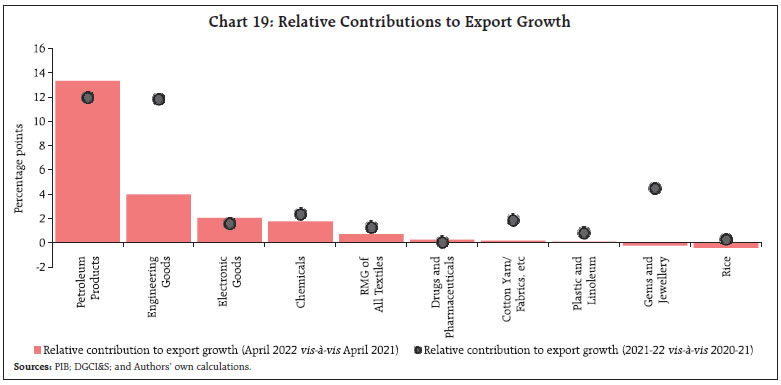
 On the external front, India’s merchandise exports at US$ 40.2 billion in April 2022 continued to register robust growth of 30.7 per cent on a y-o-y basis (Chart 18). Export growth was broad-based, as 8 out of 10 major commodity groups accounting for around 70 per cent of exports grew on a y-o-y basis. The improvement in export performance stemmed from the higher value of shipments of petroleum products, engineering goods and electronic goods (Chart 19). On a sequential basis, however, merchandise exports witnessed contraction across all major exporting segments. 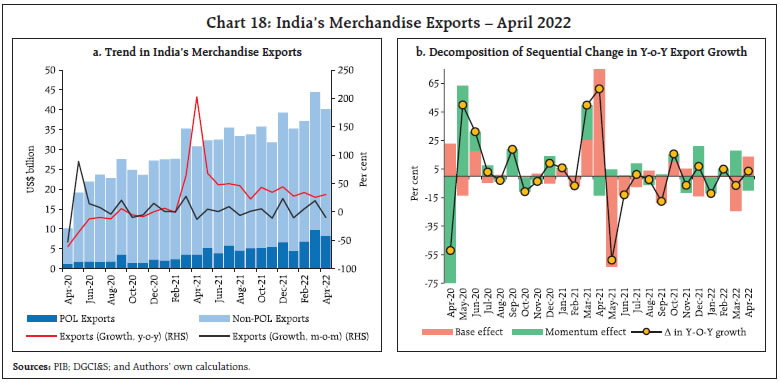
 In 2022, the Government of India is putting special emphasis on defence exports through policies such as introducing an open general export license policy, launching seven defence public sector units, and establishing defence industrial corridors in Uttar Pradesh and Tamil Nadu4. The world’s military expenditure had already crossed US$ 2 trillion for the first time in 2021 (Chart 20). India’s defence exports also more than doubled in the last five years. Indian exporters are also exploiting opportunity to fill the global supply gap in tea and apparel exports as supply from Sri Lanka is impacted by the ongoing economic crisis. Sri Lanka’s increasing import dependence on India for essentials and inputs for its export-intensive sectors are receiving support from India (Chart 21). Merchandise imports at US$ 60.3 billion remained above US$ 50 billion for the 8th consecutive month in April 2022 (Chart 22).
Import growth was broad-based, as 9 out of 10 major commodity groups accounting for more than 75 per cent of imports recorded an expansion on a y-o-y basis. Robust import demand was driven by petroleum products5, coal, coke, briquettes, and electronic goods (Chart 23). A sharp jump in global energy prices resulted in coal imports falling in volume terms (Chart 24a). The energy crisis has led to an unprecedented rally in coal prices globally amplified by the Russia-Ukraine war (Chart 24b). In value terms, coal imports more than doubled in April 2022 on a y-o-y basis.
The import of vegetable oils increased by more than 30 per cent in April 2022 on a y-o-y basis. The adverse weather conditions in top vegetable oil-producing nations, demand-supply gaps caused in segments such as sunflower due to the Russia-Ukraine war, and Indonesia’s decision to ban palm oil exports have led to high prices of vegetable oils. Palm oil imports account for more than half of total imports in the vegetable oil segment. Indonesia supplies more than half of India’s edible oil imports (Chart 25). However, India has sufficient edible oil stocks – roughly 21 lakh metric tonnes (LMT) – and almost 12 LMT in transit arriving in May 2022 to cover the lean period.6
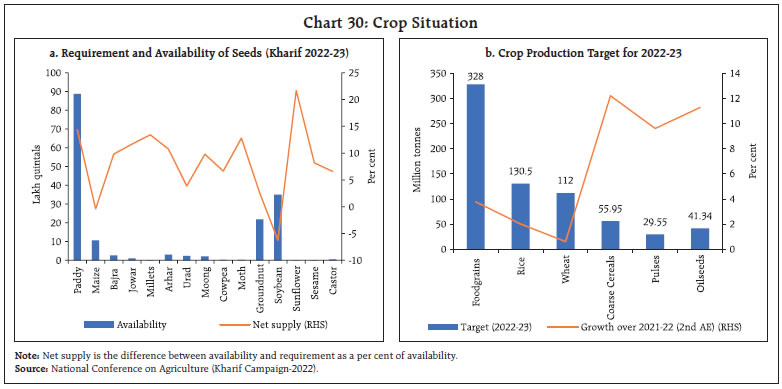
India’s merchandise trade deficit at US$ 20.1 billion in April 2022 widened on a y-o-y basis (US$ 15.3 billion) as well as on a sequential basis (US$ 18.5 billion). As per the data available for 25 States from Comptroller and Auditor General (CAG), States have been able to sustain an upward momentum in their receipts and expenditures during April-February 2021-22 (Chart 26). Moreover, the revenue receipts and capital outlays posted a higher growth in 2021-22 than in 2019-20 (pre-pandemic year), indicating a swift recovery in their finances. In the Union Budget 2022-23, the Centre set a limit on States’ gross fiscal deficit (GFD) at 4 per cent, of which 0.5 per cent is tied to their efforts towards power sector reforms. As per the latest Budget of 20 States, they are expected to reduce their GFD-GSDP ratio to 3.2 per cent in 2022-23 (BE) as against 3.7 per cent in 2021-22 (RE). The reduction in GFD is emanating from higher revenue collection and lower revenue expenditure. States have targeted a higher growth in capital expenditure than in revenue expenditure in 2022-23 (BE), which augurs well for long-term economic growth prospects and improves the quality of States’ expenditure. Aggregate Supply The agriculture and allied sector is poised to perform well in the forthcoming Kharif season, with the official forecast of a normal south-west monsoon (SWM) and the increase in non-urea fertiliser subsidy announced by the Union Government. In anticipation, the National Conference on Agriculture for Kharif Campaign held on April 19, 2022 has set a food grains production target of 328 million tonnes during 2022-23. Summer or Zaid crops7 have covered an area of 73.58 lakh hectares as on May 13, 2022, 5.4 per cent higher than a year ago, attributable to significantly higher acreage under pulses (Chart 27a). The total live storage in 140 major reservoirs as on May 12, 2022, was higher at 33 per cent of the full reservoir level (FRL) as compared to 31 per cent during the previous year and the decadal average of 26 per cent (Chart 27b). Heat wave conditions prevailed in the northwest and central regions of India during March and April, creating risks to livelihood and economic activity. The average maximum temperature recorded in the country during March 2022 was the highest at 33.10ºC in the last 122 years (1901-2022). Similarly, the recorded average maximum temperature in April was the third highest at 35.30ºC since 1901 (Chart 28). An early summer marked by extremely dry and hot weather before wheat harvest resulted in a condition called ‘terminal heat stress’ that has wilted crops and has led to shrivelled grains, especially in Punjab, Haryana, and Uttar Pradesh. Wheat procurement during the Rabi Marketing Season (RMS) 2022-23 so far (since April 2022) has been lower, reflecting the loss in yields, private traders’ procurement, farmers selling in agriculture wholesale markets (mandis) and farmgate sales to meet the strong export demand from Egypt, Turkey and other African countries. Procurement stands at 17.9 million metric tonnes (MT) as on May 12, 2022, registering a 49.3 per cent decline from last year’s purchase of 35.4 million MT. The procurement operations have, however, benefitted 16.83 lakh farmers with an estimated outflow of ₹36,208 crore at the minimum support price (MSP) of ₹20,150 per MT. Taking into account the lower wheat procurement under central pool and the higher market prices than MSP, the Central government on May 13 decided to restrict export of wheat, except in case of irrevocable letter of credit and requests from neighbouring / food-deficit countries (Chart 29). 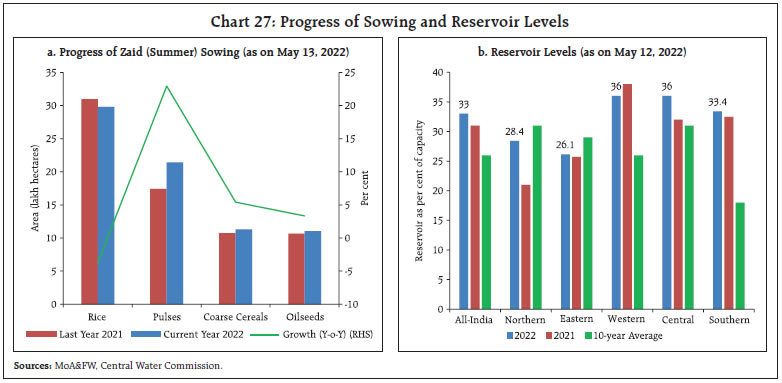
 Alongside the India Meteorological Department’s (IMD) prediction of normal rainfall at 99 per cent (±5 per cent of long-period average (LPA)), production prospects are brightened by sufficient availability of seeds for Kharif crops except for soybean and maize (Chart 30a). Incidentally, the LPA (or normal) rainfall for SWM is also revised to 868.6 mm for the period 1971-2020, lower by 12.0 mm from the earlier LPA (880.6 mm for 1961-2010). The production targets for coarse cereals, pulses and oilseeds are 12 per cent, 10 per cent and 11 per cent higher, respectively, than the second advance estimates of 2021-22 (Chart 30b). 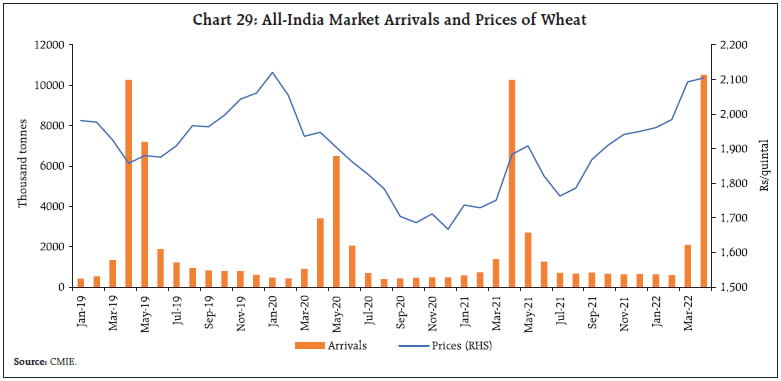
 In the industrial sector, the headline manufacturing PMI improved in April to 54.7 from 54.0 a month ago, as output and new orders increased. The future output index increased to 54.3 as uncertainty around geopolitical tensions eased, even as it remained below its long-run average. PMI services also improved to 57.9 in April from 53.6 in March, recording the strongest expansion since November 2021. The business expectations index (BEI) for services weakened to 51.9 in April 2022 from 53.7 a month ago, with inflation concerns keeping expectations low (Chart 31). The recovery in economic activity post the third wave of COVID-19 drove electricity generation higher in April, sustaining at levels recorded a month ago and surpassing pre-pandemic levels (Chart 32a). Rising temperatures and heat waves in the country nudged up power demand further. This has put pressure on electricity distribution companies (DISCOMs) in meeting the elevated demand, leading to an increase in daily peak shortages (Chart 32b). Power shortage has also forced industrial consumers and DISCOMs to buy electricity from the India Energy Exchange (IEX) (India’s energy trading platform), thereby pushing up the spot price of electricity on the exchange (Chart 32c). But the situation is gradually normalising with both electricity peak shortage and electricity spot prices moderating in the second week of May 2022. Power shortage was further accentuated by shortage of coal stocks at power plants. The number of thermal power plants with critical levels of coal stock (a week or less) increased to 104 as on May 11, 2022 from 32 a year ago. Normally, domestic shortfall of coal is supplemented by imported coal, but amidst the ongoing geopolitical tensions and supply disruptions, coal imports remain relatively subdued. As about three-fourths of the power generation relies on coal as a fuel, any disruptions in supply of coal spills over to electricity supply. This underscores the need for improving supply networks and creating spare capacity. 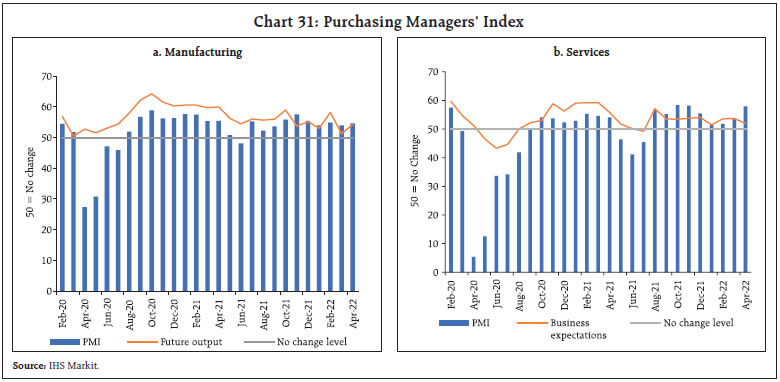 In the services sector, transport indicators improved with railways freight traffic increasing by 9.4 per cent (y-o-y) in April 2022 despite a high base (Chart 33a). An increase in coal freight was also recorded, even as iron ore and cement declined on a high base. Cargo at major ports recorded 5.6 per cent growth in April with some loss of momentum in volumes vis-à-vis the previous month, due to moderation in all commodities (Chart 33b).
With the reopening up of the services sector, hotel occupancy rates recovered in March 2022 recording their highest levels since the outbreak of the pandemic. Average room rate and revenue per available room inched up, although both remained below the pre-pandemic average (Chart 34).
Activity in the construction sector picked up during March-April 2022, with cement production and steel consumption recording expansion over the pre-pandemic month (Chart 35a)8. Rising demand was also reflected in new launches and sales of residential units in Q4:2021-22. Inventory overhang dipped to an eight-quarter low of 48 months (Chart 35b). The aviation sector maintained its recovery in April 2022, especially in the international passenger segment. Daily domestic airport footfalls averaged 6.9 lakh per day – an expansion of 1.0 per cent over the preceding month. International airport footfalls increased by 12.4 per cent sequentially, while the cargo segment increased by 2.6 per cent (m-o-m) for domestic cargo and contracted by 6.2 per cent (m-o-m) for international cargo. In the first fifteen days of May, domestic airport footfalls increased by 7.7 per cent over the corresponding period in April, signalling sustained demand for aviation. Responding to the removal of restrictions, services sector retained momentum which was echoed in high frequency indicators recording growth in most trade and transport sectors. Contact-intensive aviation and tourism sectors recorded sequential improvement, but the recovery remains lagged (Table 2). Inflation Provisional consumer price index (CPI) data for April 2022 released by the National Statistical Office (NSO) on May 12, 2022 showed that headline CPI inflation (year-on-year) rose to 7.8 per cent in April from 7.0 per cent in March on account of an acceleration across all major groups (Chart 36a). A positive price momentum (month-on-month change in prices in the current month) of 143 bps in April was partially offset by favourable base effects (month-on-month change in prices a year ago) of 64 bps, leading to an increase in headline inflation by around 80 bps between March and April. Food and beverages inflation was the main driver, rising to 8.1 per cent in April from 7.5 per cent in March. The sub-groups pushing up inflation were cereals, milk, fruits, vegetables, spices and prepared meals. On the other hand, price increases softened in respect of eggs, meat and fish, pulses, sugar and non-alcoholic beverages. Edible oils and fats recorded moderate m-o-m increase in prices in April compared to March, which was reflected in the decline in y-o-y inflation. After moderating for the past five months, fuel inflation increased sharply from 7.5 per cent in March to 10.8 per cent in April, primarily due to an increase in kerosene (PDS) and LPG inflation. Electricity prices continued to record negative inflation on a y-o-y basis (-0.6 per cent), despite increasing in April over March by 1.6 per cent. Fuel (weight of 6.84 per cent in the CPI basket) contributed around 9.3 per cent of headline inflation in April (Chart 36b). Inflation excluding food and fuel9 increased by 70 bps to 7.1 per cent in April from 6.4 per cent in March (Chart 36a). This was largely due to the pressures emanating from transport and communication, education, clothing and footwear, recreation and amusement, household goods and services, health and housing sub-groups. Inflation in pan, tobacco and intoxicants and personal care and effects sub-groups moderated. Along with higher inflation, there has been an uptick in both standard deviation and skewness of inflation in April over March levels,10 with few items contributing disproportionately to the overall inflation (Chart 37). High frequency food price data from the Ministry of Consumer Affairs, Food and Public Distribution (Department of Consumer Affairs) for May so far (May 1-12, 2022) indicate an increase in cereals prices, primarily on account of a surge in wheat prices. Pulses prices remained steady, although tur prices have moderated while masoor prices edged up. Edible oils prices registered a broad-based increase. Among key vegetables, tomato prices rose sharply, while onion prices moderated. Potato prices also hardened in May so far (Chart 38). Retail selling prices of petrol and diesel in the four major metros remained steady in May so far (until 12th). On May 7, 2022 LPG prices increased by ₹50 per cylinder. Kerosene prices remained steady in May after increasing sharply in April (Table 3).
Input costs increased sharply in April 2022 across manufacturing and services as reflected in the PMIs. In April, selling prices in manufacturing pushed inflation to its highest annual level, while selling prices in services rose at the sharpest rate since July 2017. | Table 3: Petroleum Products Prices | | Item | Unit | Domestic Prices | Month-over-month (per cent) | | May-21 | Apr-22 | May-22^ | Apr-22 | May-22 | | Petrol | ₹/litre | 94.37 | 112.61 | 112.97 | 8.3 | 0.3 | | Diesel | ₹/litre | 86.68 | 100.19 | 100.55 | 9.4 | 0.4 | | Kerosene (subsidised) | ₹/litre | 30.38 | 56.99 | 56.99 | 21.6 | 0.0 | | LPG (non-subsidised) | ₹/cylinder | 819.63 | 960.13 | 985.13 | 3.7 | 2.6 | ^: For the period May 1-12, 2022.
Note: Other than kerosene, prices represent the average Indian Oil Corporation Limited (IOCL) prices in four major metros (Delhi, Kolkata, Mumbai and Chennai). For kerosene, prices denote the average of the subsidised prices in Kolkata, Mumbai and Chennai.
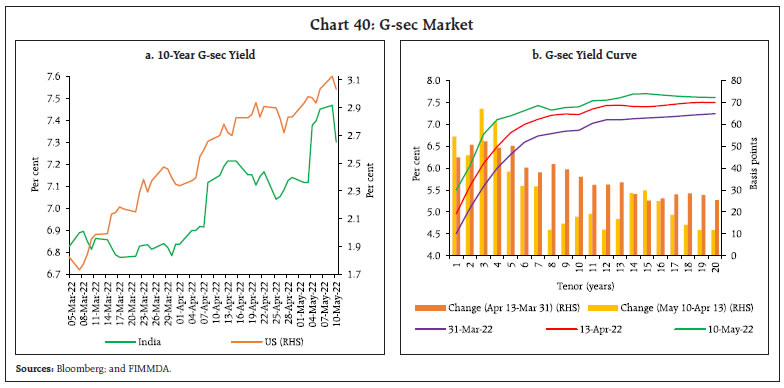
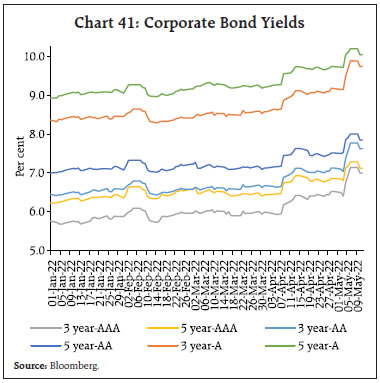
Sources: IOCL; Petroleum Planning and Analysis Cell (PPAC); and RBI staff estimates. | IV. Financial Conditions Liquidity conditions evolved in line with the overall stance of monetary policy, with the focus on withdrawal of accommodation as set out in April policy and reinforced through the repo rate and CRR increases announced on May 4, 2022. Daily liquidity absorptions under the liquidity adjustment facility (LAF) averaged ₹6.8 lakh crore in the second half of April 2022 through May 12, moderating from ₹7.5 lakh crore during the second fortnight of March through mid-April 2022. Since the inception of the SDF, average daily absorption under the SDF (which replaced the fixed rate reverse repo (FRRR) as the floor of the LAF corridor on April 8) stood at ₹2.0 lakh crore while the bulk of surplus liquidity was mopped up through variable rate reverse repo (VRRR) auctions (both main and fine-tuning). As liquidity surplus moderated from a peak of near ₹9 lakh crore, overnight money market rates firmed up towards the SDF rate, with the tri-party rate briefly breaching it (Chart 39). The transition from the FRRR to the higher SDF rate as the lower bound of the corridor in the April policy followed by policy rate hike in off-cycle meeting on May 4, 2022 has pulled up the overnight rates. Along the outer term money market segment, yields on 3-month T-bills trended higher in May. The interest rates on 3-month certificates of deposit (CDs) and 3-month commercial paper (CP) after softening intermittently in the second half of April due to low issuances amidst steady inflows to mutual funds, resumed upward momentum, thereafter, surging past the MSF rate. Bond yields exhibited a hardening bias beginning the second half of April 2022, following the Reserve Bank’s May 4 monetary policy decision. The 10-year G-sec yield hardened to an intra-day high of 7.42 per cent on May 4 after the hike in the policy repo rate and CRR was announced in an off-cycle meeting (Chart 40a). The rise in the US treasury yields also weighed on market sentiment. The short-end of the G-sec yield curve increased in sync with the transition from the FRRR to the SDF, reflecting the repricing of securities of the same maturity (Chart 40b). Subsequently, the policy rate hike brought about an upward shift in the yield curve. The bearishness in G-sec market spilled to corporate bond market wherein yields experienced synchronised hardening across maturity profile and rating spectrum (Chart 41). The yield on 3-year AAA rated corporate bond hardened by 58 bps from 6.41 per cent on April 13 to 6.99 per cent on May 10, 2022. Monetary and credit aggregates exhibited sequential improvement in April. Reserve money (RM), excluding the first-round impact of the CRR restoration, grew at 10.0 per cent on a y-o-y basis as on May 6, 2022 (13.5 per cent a year ago) with currency in circulation, the largest component of RM, growing at 9.9 per cent (14.4 per cent a year ago). On the other hand, money supply (M3) recorded a growth at 10.2 per cent as on April 22, 2022 (11.1 per cent a year ago), primarily driven by the growth in aggregate deposits at 10.0 per cent (10.3 per cent a year ago). The growth in scheduled commercial banks’ (SCBs’) credit to the commercial sector crossed double digits for the first time since August 2019 and accelerated to 11.1 per cent as on April 22, 2022 as compared with 5.7 per cent a year ago (Chart 42). 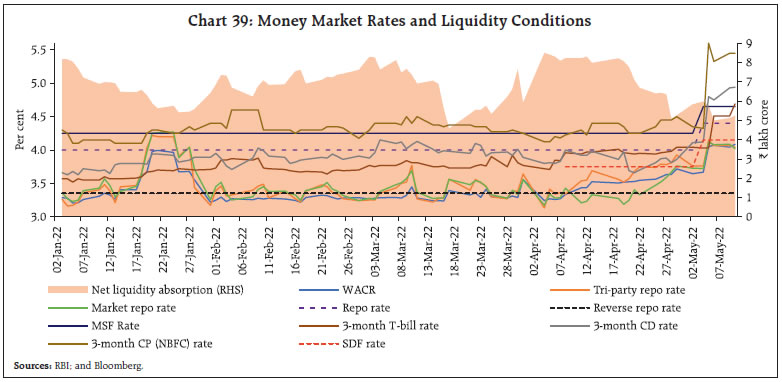
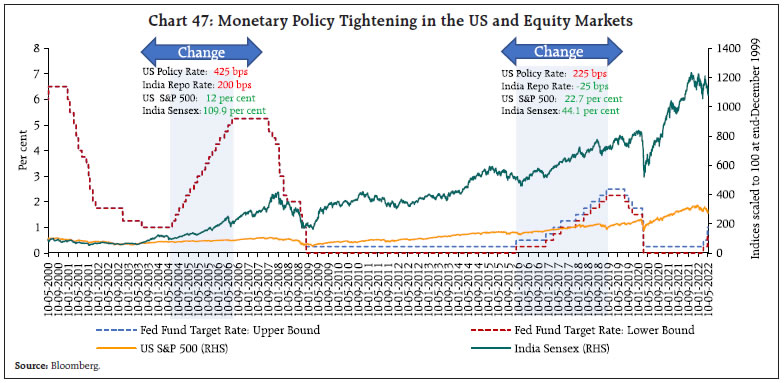
 The lagged impact of past monetary policy actions, forward guidance on the accommodative stance of monetary policy and surplus liquidity in the system facilitated transmission of policy rates to lending rates. The weighted average lending rates on fresh and outstanding rupee loans declined by 26 bps and 36 bps, respectively, on a point-to-point basis during April 2021 to March 2022 (Chart 43). The extent of pass-through to the weighted average lending rate (WALR) on outstanding loans was higher than on fresh rupee loans. The median marginal cost of funds-based lending rate (MCLR) of SCBs declined only by 2 bps, while lending rates on new loans declined only marginally. However, with the decline in shares of outstanding loans linked to the base rate and the MCLR and concomitant increase in the share of external benchmark linked outstanding loans which are priced at a lower rate, pass-through to the WALR on outstanding rupee loans was much larger11. 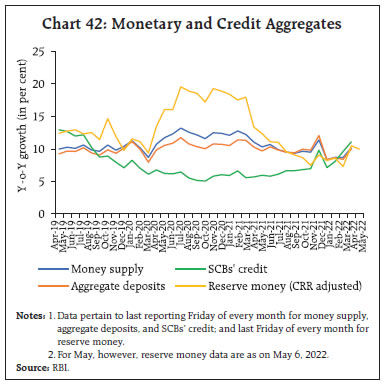 With an increase in the incremental credit to deposit ratio since December 2021, banks have started raising rates on term deposits to mobilise stable funding to meet the increased demand for credit.12 The median term deposit rate (i.e., average card rates on fresh deposits across all tenors) of SCBs increased from 4.04 per cent in December 2021 to 4.10 per cent in April 2022 (Chart 44). In response to the Reserve Bank’s repo rate hike of 40 bps on May 4, banks have started adjusting their benchmark rates for loan pricing, i.e., MCLRs and external benchmark linked lending rates (EBLRs), upwards. In April 2022, seven domestic banks, including two public sector banks and five private banks, increased their MCLRs in the range of 5 to 13 bps. The move to increase benchmark rates by some major banks is guiding the direction of lending and deposit rates of non-banking financial companies (NBFCs). Some major non-banks have increased their deposit and lending rates in April 2022. Q4:2021-22 earnings declared by 409 listed non-financial companies, constituting around 56.3 per cent of all listed non-financial companies, indicate a healthy performance in terms of most of the key parameters (Chart 45). Net sales growth during the quarter remained robust, partly driven by a rise in output prices. Raw material costs of firms surged during the quarter owing to the impact of rise in various commodity prices. To cushion the impact of rising input costs, a few firms increased prices of their products while others adopted cost cutting measures, such as reducing discretionary expenses on advertisements, etc. Furthermore, wages and salaries registered an increase during the quarter. Overall, operating expenditure increased at a faster rate than sales which weighed on firms’ operating margins. Nonetheless, growth in operating profits remained robust driven by strong performance from oil and gas companies. Other income, which includes income from treasury operations, etc., grew at a robust rate, however, higher tax expenses led to some moderation in net profits growth. 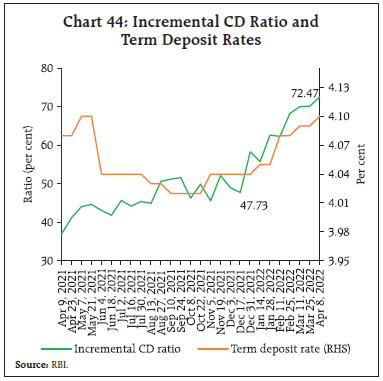 Banking and financial sector, based on an analysis of 120 companies constituting around 73.7 per cent of all listed financial companies, registered strong operating performance during Q4:2021-22 (Chart 46). Net sales, which primarily includes interest income, registered a sharp increase with pick-up in credit growth. Other income, which includes, profit/loss from treasury operations, fees and commissions, however, registered a decline during the period. Expenditure increased at a subdued rate than the topline, resulting in double-digit growth in operating profits. Furthermore, gaining from improved asset quality, provisioning costs declined sharply during the quarter, contributing to a sharp jump in net profits. 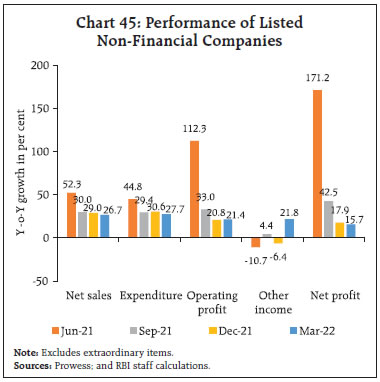 After declining by 2.6 per cent in April 2022, the Indian equity market benchmark BSE Sensex declined further by 7.2 per cent in May 2022 (up to May 12, 2022) tracking weak cues from global markets. Market sentiment remained cautious amidst concerns on rising global inflation, monetary policy tightening in the US and COVID-19 related lockdowns in China. The initial reaction of the equity market to a hike by the Fed of 50 bps was muted, however, it registered steep decline subsequently as investors fretted about monetary policy tightening in the world’s largest economy. Even though equity markets are expected to react negatively to interest rate hikes, strong demand conditions and improved profitability would act as a counter force. Historical data suggest that during the two episodes of policy rate hikes by the US Fed since 2000 – first during mid-2004 to mid-2006 and second during end-December 2015 to end-December 2018 – equity markets in India and the US gained as corporate earnings increased (Chart 47). 
 In contrast to heavy selling by foreign portfolio investors (FPIs) in recent months, domestic investors have emerged as a strong counterbalancing force in the wake of increasing diversification by households into stock markets through direct investments as well as indirect investments through mutual funds. The combined share of domestic institutional investors (DIIs), which includes domestic mutual funds, insurance companies, banks and financial institutions; retail investors and high net-worth individuals (HNIs) in NSE-listed companies reached 23.3 per cent at end-March 2022. In contrast, FPIs held 20.2 per cent at end-March 2022 (Chart 48). India remained an attractive destination for foreign direct investors in 2021-22. Gross foreign direct investment (FDI) inflows at US$ 83.6 billion in 2021-22 surpassed their level of US$ 82.0 billion recorded a year ago (Chart 49). However, net FDI moderated to US$ 39.3 billion in 2021-22 from US$ 44.0 billion a year ago, due to higher outward FDI by India and repatriation by foreign investors. Services and manufacturing sectors accounted for a major share in FDI equity inflows in 2021-22.
FPIs remained net sellers in April 2022 in the domestic market, amidst inflationary pressures, oil price surges, incoming information on policy normalisation in major AEs and geopolitical tensions. Net FPI outflows in the month to the tune of US$ 4.1 billion were largely driven by the sell-off in the equity market (Chart 50). A large part of FPI outflows in the month was recorded in financial services and information technology sectors. Net disbursements of external commercial borrowings (ECBs) to India, excluding inter-company borrowings, stood higher at US$ 7.7 billion during 2021-22 as compared with US$ 0.2 billion a year ago, while net disbursements, including inter-company borrowings, were to the tune of US$ 12.2 billion during this period as against US$ 4.1 billion a year ago. A large part of ECBs in March 2022 was routed to infrastructure development, expenditure for local capital goods and refinancing of earlier ECBs. Foreign exchange reserves at US$ 596.0 billion as on May 6, 2022 were equivalent to about 10 months of imports projected for 2022-23 (Chart 51). In the foreign exchange market, the Indian rupee (INR) appreciated by 0.1 per cent vis-à-vis the US dollar (m-o-m) in April 2022. This was reflected in the movement of the 40-currency real effective exchange rate (REER) of the INR, which appreciated by 0.2 per cent in the month (Chart 52).
High inflationary pressures have led to a significant appreciation in REERs in the UK and Canada, while the REER has remained stable in the US (Chart 53a). By contrast, price surges are accompanied by a moderation in the REER in the Euro area. Among major EMEs, inflationary pressures have induced a significant appreciation in the REER in Argentina (Chart 53b). Similarly, REERs have been largely driven by domestic price pressures in Brazil, Mexico, and South Africa. By contrast, high inflationary pressures are accompanied by a significant moderation in the REER in Turkey. Payment Systems Digital payments maintained a healthy expansion in April 2022. Large-value transfers through the Real Time Gross Settlement (RTGS) posted double-digit growth (y-o-y). On the retail side, transactions through the Unified Payments Interface (UPI) maintained robust volume and value growth, with values inching closer to hitting ₹10 lakh crore mark. The National Electronic Funds Transfer (NEFT), the Immediate Payment Service (IMPS), the National Electronic Toll Collection (NETC), and the National Automated Clearing House (NACH) also recorded acceleration in transactions (Table 4). The Bharat Bill Payment System (BBPS) registered the highest number of transactions in a month (7.4 crore), reflecting its popular adoption. The surge was led by electricity bills payment, with increased demand during the summer season, followed by loan repayments. Credit card transactions gained further traction, owing to the revitalisation of air travel and hospitality, combined with the emergence of new players and expansion into lower-tier cities.13 The number of outstanding credit cards increased to 7.36 crore in March 2022, around 19 per cent higher than a year ago. As part of its efforts to develop a consumer-friendly and robust payment ecosystem, the Reserve Bank has consolidated and updated the guidelines concerning the issuance of cards and conduct of operations by card issuers in India.14 These regulations simplify the extant regulatory environment relating to the card system, mandate issuers to take explicit consent of customers regarding the provision of card-related services and handling of their data, allow NBFCs to issue credit cards without a banking partner subject to the prior approval of the Reserve Bank, and strengthen the grievance redressal mechanism. Marking new strides in internationalisation of the UPI, the NPCI International Payments Ltd. has enabled the acceptance of BHIM UPI across NEOPAY15 enabled stores in the United Arab Emirates (UAE).16 As a measure to enhance digital financial inclusion, the BBPS has partnered with FAARMS17 to facilitate recurring payments for farmers throughout India.  Overall, the digital payment market is expanding, with the rise in e-commerce adoption, FinTech app installs18, number of active internet users19, and the number of smartphones20 combined with the leveraging of India Stack21 by FinTech players. Riding on the back of growing acceptance of existing digital modes and novel payment offerings such as Buy-Now-Pay-Later schemes and offline payments, the Indian digital payment market is expected to reach 21,700 crore transactions by 2026.22 Conclusion The global growth outlook appears grim as geopolitical tensions linger, commodity prices remain elevated and withdrawal of monetary accommodation gathers speed. Emerging economies face risks of capital outflows and higher commodity prices feeding into inflation prints. Meanwhile, the pandemic continues to impinge on near-term economic prospects. The Indian economy’s recovery remains resilient, although risks stemming from global developments have thwarted the momentum. Inflation risks have become more accentuated in recent months. The increase in international commodity prices also imparts a net terms of trade shock that is widening the trade and current account deficits. India faces challenges in building from the scars of the pandemic through larger investments in health and productivity of the human capital. With an acceleration in the pace of digitalisation, the footprint of the unicorn ecosystem in India is expanding, reflecting a rapidly changing economy. In order to achieve a higher growth path on a sustainable basis, private investment needs to be encouraged through higher capital expenditure by the government which crowds in private investment. Improving infrastructure, ensuring low and stable inflation and maintaining macroeconomic stability are critical for reviving animal spirits and spurring growth.
|