Against the backdrop of the Sri Lankan crisis, this article attempts to put the spotlight on fiscal risks confronting state governments in India, with emphasis on the heavily indebted states. The slowdown in own tax revenue, a high share of committed expenditure and rising subsidy burdens have stretched state government finances already exacerbated by COVID-19. New sources of risks have emerged in the form of rising expenditure on non-merit freebies, expanding contingent liabilities, and the ballooning overdue of DISCOMs. Introduction The prolonged COVID crisis has worsened fiscal positions of governments around the world as reflected in mounting debt levels. The sustainability of public debt at national and sub-national levels has again assumed centre-stage as the dominant fiscal risk. In particular, the pandemic has taken a heavy toll on finances of states in India, warranting a mid-term course correction at least among the more direly affected ones. Given this parlous situation, the tendency towards handing out cash subsidies, in normal times, provision of free utility services, revival of the old pension scheme by some states and extension of implicit and explicit guarantees by various state governments in India act like swords of Damocles. This article attempts to put the spotlight on the fiscal risks confronting state governments in India, with emphasis on the heavily indebted states. The rest of the article is structured into four parts. Section II assesses the financial health of Indian states in terms of various vulnerability indicators. Section III evaluates debt sustainability of the states by testing econometrically whether they meet the solvency condition. Drawing therefrom in terms of risk identification, Section IV undertakes a detailed risk assessment of the fiscally vulnerable states through risk quantification and stress testing. Conclusions and policy perspectives are discussed in Section V. II. Fiscal Vulnerability of Indian States A major motivation for undertaking this analysis is the unfolding of the crisis in Sri Lanka, which has culminated in its first ever debt default on May 19, 2022. The Sri Lankan economy was battered by the pandemic, as travel restrictions hit tourism; exports of textiles, garments and tea suffered a setback due to pandemic-driven slump in global trade; and remittances were impacted by the global growth slowdown. Apart from the pandemic, public policies also contributed towards the crisis – a sharp cut in direct and indirect taxes just before the pandemic; shift to organic farming by imposing total ban on the use of chemical fertilizer and pesticides to save on fertilizer subsidy, but with severe effect on rice output and productivity of the plantation sector that resulted in a spike in food inflation and shortages of essentials; and ambitious infrastructure projects funded by costly Chinese debt. Against this backdrop, the fiscal health of Indian states warrants a careful assessment. Up to the onset of the pandemic, the average GFD-GDP1 ratio of the states remained modest at 2.5 per cent during 2011-12 to 2019-20, lower than the Fiscal Responsibility Legislation (FRL) ceiling of 3 per cent. There were, however, substantial inter-state variations - while Andhra Pradesh, Kerala, Punjab and Rajasthan incurred average GFD of above 3.5 per cent of GSDP, Assam, Gujarat, Maharashtra, Odisha and Delhi ran ratios less than 2 per cent.2 States’ fiscal positions deteriorated sharply in 2020 with a sharp decline in revenue, increase in spending and a sharp rise in debt to GSDP ratios. In the first stage of the analysis, a panel of indicators is employed to identify fiscal vulnerability.3 Based on the debt-GSDP ratio in 2020-21,4 Punjab, Rajasthan, Kerala, West Bengal, Bihar, Andhra Pradesh, Jharkhand, Madhya Pradesh, Uttar Pradesh and Haryana turn out to be the states with the highest debt burden. These 10 states account for around half of the total expenditure by all state governments in India (Table 1). Other vulnerability indicators also capture these 10 states in their cross hairs. Their GFD-GSDP ratios were equal to or more than 3 per cent in 2021-22, besides deficits in their revenue accounts (except Uttar Pradesh and Jharkhand). Moreover, the interest payment to revenue receipts (IP-RR) ratio, a measure of debt servicing burden on states’ revenues, in 8 of these states was more than 10 per cent.5 Taking into account the warning signs flashing from all the indicators, we can identify a core subset of highly stressed states from among the 10 states identified by the necessary condition i.e., the debt/GSDP ratio. The highly stressed states are Bihar, Kerala, Punjab, Rajasthan, and West Bengal. Among the ten states, Andhra Pradesh, Bihar, Rajasthan and Punjab exceeded both debt and fiscal deficit targets for 2020-21 set by the 15th Finance Commission (FC-XV) (Chart 1a). Kerala, Jharkhand and West Bengal exceeded the debt target, while Madhya Pradesh overshot the fiscal deficit target. Haryana and Uttar Pradesh were exceptions as they met both criteria. Rajasthan, Kerala and West Bengal are projected to surpass the FC-XV targets for debt and fiscal deficit in 2022-23 (BE) (Chart 1b).
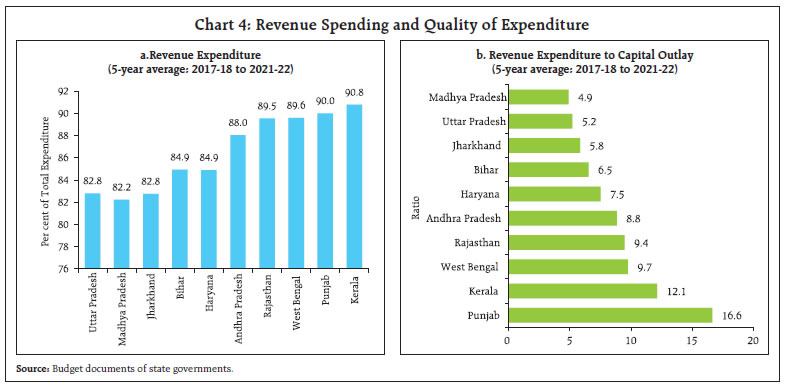
Government Revenue The ten selected states account for around half of the total revenue collected by all states and UTs. Their total revenue comprises tax revenue, non-tax revenue and central transfers, i.e., share in central taxes and grants (Chart 2a). Own tax revenue of Haryana, Kerala and Andhra Pradesh constitutes about half of their total revenue collections. The major source of revenue of other states is central transfers. Within own tax revenue, states’ goods and services tax (SGST), states’ excise duties and sales tax are the major sources of revenue (Chart 2b). 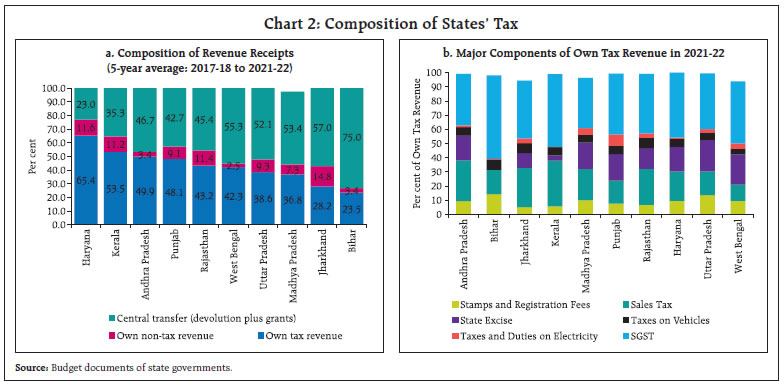 The own tax revenue of some of these 10 states, viz., Madhya Pradesh, Punjab and Kerala, has been declining over time, making them fiscally more vulnerable (Chart 3a). For most of these states, non-tax revenue has remained volatile, dropping significantly in recent years (Chart 3b). The decline in non-tax revenue is under general services, interest receipts and economic services. The declining own tax revenue and non-tax revenue affect the states’ expenditure planning and increase their dependence on market borrowing. Expenditure Quality The 10 states identified by the vulnerability indicators account for around half of the total expenditure by all states and UTs. The share of revenue expenditure in total expenditure of these states varies in the range of 80-90 per cent. Some states like Rajasthan, West Bengal, Punjab and Kerala spend around 90 per cent in revenue accounts (Chart 4a). This results in poor expenditure quality, as reflected in their high revenue spending to capital outlay ratios (Chart 4b). Although welfare-enhancing, the impact of revenue spending on economic activity lasts for just about a year. In contrast, the impact of capital outlay is stronger and lasts longer, with the peak effect materialising after two-three years. In the medium to long term, states with high revenue spending and low capital investment may experience slower revenue growth and higher interest outgo. 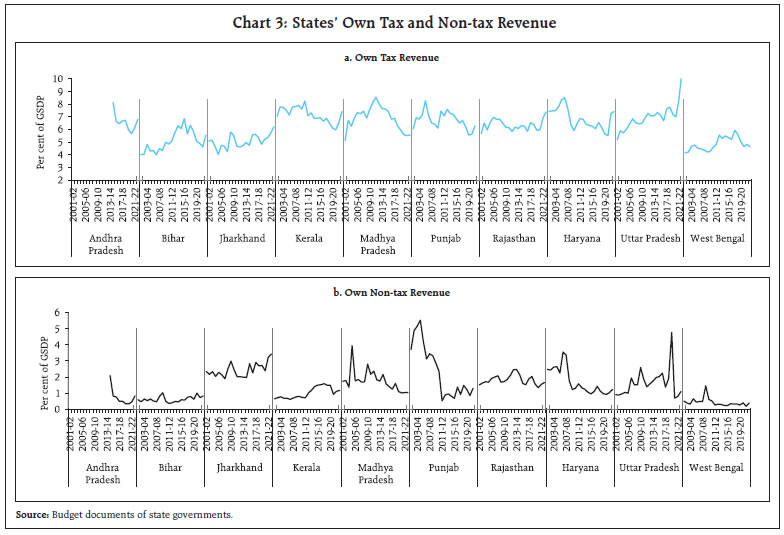
 Committed expenditure, which inter alia includes interest payments, pensions and administrative expenses, accounts for a significant portion (over 35 per cent) of the total revenue expenditure in states like Haryana, Uttar Pradesh, West Bengal, Kerala and Punjab, leaving limited fiscal space for undertaking developmental expenditure (Chart 5a). Consequently, the share of developmental expenditure in these states is considerably lower than the other states (Chart 5b).
SDL Yield Despite modest interstate spreads, there is an inverse relationship between fiscal performance of states and the SDL yields (Table 2). For instance, fiscally weak states with higher debt-GSDP ratios and higher IP-RR ratios tend to have higher SDL yields (Chart 6). In the absence of SDL ratings, these fiscal conditions seem to be playing the role of a differentiating filter in the determination of SDL yields. Hence, it is critical for the states to consolidate their fiscal position in order to lower their cost of borrowing. III. Debt Sustainability of Vulnerable States The IMF’s fiscal risk analysis and management framework6 provides a fiscal reaction function (FRF) to help assess debt sustainability and fiscal stress. The FRF assesses solvency by linking the primary balance to debt, while accounting for current economic conditions to reflect the impact of business cycle fluctuations (IMF, 2016; Bohn, 1998; Adams, et al., 2010; Tiwari, 2012; Kaur, et al., 2018). When the primary balance (relative to GDP) moves in the same direction as public debt (relative to GDP), it implies that rising debt ratios lead to higher primary surpluses which can be used for repayment and servicing of debt implying debt sustainability. Using this approach, the following equation is estimated in a panel data framework with annual data from 2001-02 to 2021-22: 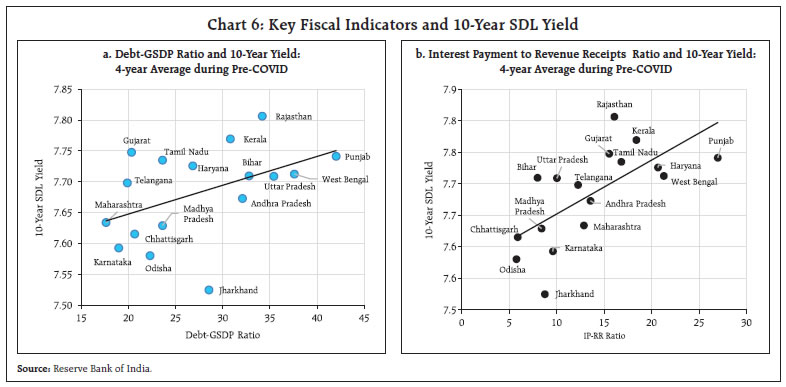
 where GSDP is the gross state domestic product; S is the primary balance to GSDP ratio; D is debt to GSDP ratio, which also includes contingent liabilities in the form of explicit guarantees; GSDPGAP is the deviation of actual output from its trend; EXPGAP is the deviation of actual primary expenditure from its trend; and ε is the error term. ‘β’ is the coefficient of interest as it measures the response of primary balance to debt. A coefficient value between zero and one implies that a rise in Debt-GSDP ratio in the current period leads to a rise in primary balance in the subsequent period which is consistent with a sustainable fiscal policy adjustment to debt. On the other hand, a negative coefficient indicates that the response could be destabilising as rise in debt ratios in the current year leads to a fall in primary surplus next year, making debt servicing difficult. Equation 1 is estimated for (i) all states7; (ii) 10 most indebted states; and (iii) 5 most indebted states.8 The performance of states is based on debt-GSDP ratio in 2020-21 (Table 1 in Section 2 and Table 39). The results indicate that for all states and for the 10 most indebted states, the coefficients of the explanatory variables are all statistically significant and have the correct signs as per the a priori expectations. The positive coefficient of Dt-1 obtained for all states, except the 5 most indebted ones, suggests that the primary balance of the state governments generally increases in response to rising debt ratios, indicative of debt sustainability. | Table 3: Estimation Results | | Explanatory Variables | Estimated Coefficients | | All States/UTs | 10 most indebted States | 5 most indebted States | | 1 | 2 | 3 | 4 | | Constant | -3.65*** | -2.87*** | 1.54 | | | (0.00) | (0.00) | (0.59) | | Dt-1 | 0.07*** | 0.04*** | -0.09 | | | (0.00) | (0.00) | (0.24) | | GSDPGAPt | 3.53*** | 3.22* | 5.79 | | | (0.00) | (0.08) | (0.26) | | EXPGAPt | -9.63*** | -7.92*** | -13.14*** | | | (0.00) | (0.00) | (0.00) | | AR (1) | 0.46*** | 0.44*** | 0.38** | | | (0.00) | (0.00) | (0.02) | | Adjusted R2 | 0.50 | 0.40 | 0.62 | | DW | 1.99 | 2.02 | 1.68 | Notes: 1) Figures in the parentheses represent respective P values.
2) ***, ** and * denote significance at 1 per cent, 5 per cent and 10 per cent levels, respectively. | The coefficient of Dt-1 turns out to be negative for the 5 most indebted states, though lacks statistical significance, implying that rising debt ratios have no significant impact on the primary balance ratios of these states. Thus, it can be concluded from the analysis that while the aggregate state government debt in India is still sustainable, the public debt of the 5 most indebted states does not satisfy the sustainability condition. An analysis of various indicators of debt sustainability of these 5 states reveals that the Domar stability condition (the real rate of interest on debt10 should be lower than the real GDP growth rate: r-g <0) was fulfilled in these states during the last five years except in 2020-21 (Table 4). On the other hand, the rate of growth of public debt turns out to be higher than GSDP growth most of the time in the last five years, which has resulted in mounting debt-GSDP ratio in these states. | Table 4: Debt Sustainability Indicators | | States | 2018-19 | 2019-20 | 2020-21 | 2021-22 | 2022-23 | | 1 | 2 | 3 | 4 | 5 | 6 | | r-g (Percentage point) | | Bihar | -6.2 | -6.0 | 2.3 | -3.4 | -3.5 | | Kerala | -4.6 | 3.3 | 10.8 | -5.4 | -3.0 | | Punjab | -0.5 | 2.9 | 7.9 | -2.4 | | | Rajasthan | -1.8 | -2.0 | 5.7 | -11.2 | -5.5 | | West Bengal | -5.3 | -1.8 | -0.1 | -10.5 | -4.1 | | Difference in nominal GSDP and debt growth (Percentage point) | | Bihar | 5.0 | -2.0 | -11.4 | -5.5 | -0.3 | | Kerala | -0.2 | -5.2 | -17.1 | 0.5 | -0.6 | | Punjab | 0.2 | -2.9 | -12.9 | 1.4 | | | Rajasthan | -1.2 | -3.7 | -14.2 | 2.9 | -0.7 | | West Bengal | 4.0 | -0.6 | -4.9 | 8.4 | 0.6 | | Source: RBI Staff Estimates. | IV. Fiscal Risk Analysis of States In a robust fiscal risk analysis framework, it is important to identify the potential sources and nature of fiscal risks, achieve quantification of fiscal risk and recommend suitable risk management practices for adoption11. IV.1 Risk Identification Fiscal risks can arise from macroeconomic shocks and the realisation of contingent liabilities. Contingent liabilities can be either ‘explicit’, viz., government loan guarantees, or ‘implicit’, wherein even without any specific guarantee, there is widespread public expectation that the government will rescue or bailout the troubled entities. Globally, the most common sources of contingent liabilities are troubled financial institutions, state-owned enterprises, subnational governments, private non-financial companies, and public-private partnerships, as the government has to rescue or bailout these entities in case of a default even without any direct stake or ownership in the defaulting entity (IMF, 2016). Besides, natural disasters often amplify fiscal risks, depending on the magnitude and nature of fiscal responses deployed to mitigate their impact on the economy. Legal cases, though infrequent, can pose significant fiscal risks at times. The major macroeconomic risks facing the state governments in India currently arise from uncertainties surrounding the evolving COVID situation, spillovers from the Russia-Ukraine war operating through high global food and commodity prices, and the synchronized monetary tightening by central banks across the world. Apart from these macroeconomic shocks, the other potential sources of fiscal risk for the Indian states stem from declining own tax revenue, increase in expenditure following growing preference for distribution of “freebies”, relaunch of the old pension scheme, increased frequency of natural disasters, realisation of government guarantees extended to state-owned enterprises and rising overdues of loss-making power distribution companies (DISCOMs). Pension Expenditure The old pension system (defined benefits) – primarily a pay-as-you-go system and hence, unfunded – had numerous drawbacks, particularly in terms of medium-term fiscal sustainability and the tax burden on future generations. Many states (excluding West Bengal) had switched to the New Pension Scheme (NPS) after realising that the old system was unsustainable in the long run.12 The recent reversal of positions on the old pension scheme by Rajasthan and Chhattisgarh, however, has reignited the debate about the pros and cons of the old pension scheme versus the NPS, with a few more states reportedly contemplating taking similar steps. Pension expenditure alone accounts for 12.4 per cent (average of 2017-18 to 2021-22) of total revenue expenditure of the 10 most indebted states. It is estimated that the pension outgo will continue to be in the range of 0.7-3.0 per cent of GSDP in the ten most indebted states until 2030-31 (Chart 7). As the current state government retirees are primarily the beneficiaries of the old pension scheme, the immediate financial strain will not be felt if the states choose to revert to the old pension scheme. However, when state government employees who joined after 2004-05 under the NPS begin to retire from 2034 onwards, the cost of such a move will become apparent. In other words, the adoption of the old pension scheme is likely to benefit the current generation at the expense of future generations. State Subsidies and Freebies As per the latest available data from the Comptroller and Auditor General of India (CAG), the state governments’ expenditure on subsidies has grown at 12.9 per cent and 11.2 per cent during 2020-21 and 2021-22, respectively, after contracting in 2019-20 (Chart 8a).14 Commensurately, the share of subsidies in total revenue expenditure by states has also risen from 7.8 per cent in 2019-20 to 8.2 per cent in 2021-22. At a disaggregated level, there are stark variations among states. For instance, Jharkhand, Kerala, Odisha, Telangana and Uttar Pradesh are the top five states with the largest rise in subsidies over the last three years. States like Gujarat, Punjab and Chhattisgarh spend more than 10 per cent of their revenue expenditure on subsidies (Chart 8b). Subsidies, however, are known to crowd out resources from other useful purposes (Gopalan, 2013). In the recent period, state governments have started delivering a portion of their subsidies in the form of freebies.15 While there is no precise definition of freebies, it is necessary to distinguish them from public/merit goods, expenditure on which brings economic benefits, such as the public distribution system, employment guarantee schemes, states’ support for education and health (Singh, 2022). On the other hand, provision of free electricity, free water, free public transportation, waiver of pending utility bills and farm loan waivers are often regarded as freebies, which potentially undermine credit culture, distort prices through cross-subsidisation eroding incentives for private investment, and disincentivise work at the current wage rate leading to a drop in labour force participation. Some freebies may benefit the poor if properly targeted with minimal leakages, but their advantages must be evaluated against the large fiscal costs and inefficiencies they cause by distorting prices and misallocating resources. Additionally, the provisions of free electricity and water are known to accelerate environmental degradation and depletion of water tables. 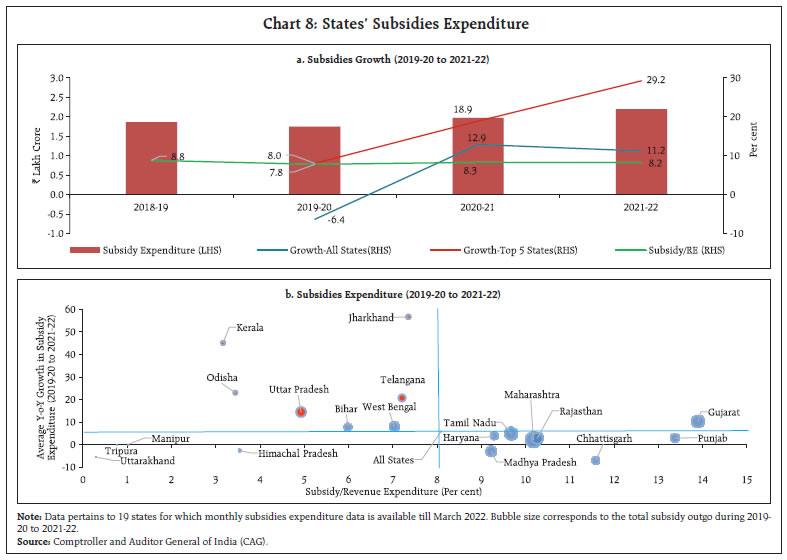 To derive an estimate of freebies, we have collated data on major financial assistance/ cash transfers, utility subsidies, loan or fee waivers and interest free loans announced by the states in their latest budget speeches (i.e., for 2022-23). As per these estimates, expenditure on freebies range from 0.1 - 2.7 per cent of GSDP for different states (Table 5). The freebies have exceeded 2 per cent of GSDP for some of the highly indebted states such as Andhra Pradesh and Punjab (Annex 1). | Table 5: Freebies Announced by the States in 2022-23 | | | (As a per cent of GSDP) | (As a per cent of Revenue Receipts) | (As a per cent of Own Tax Revenue) | | 1 | 2 | 3 | 4 | | Andhra Pradesh | 2.1 | 14.1 | 30.3 | | Bihar | 0.1 | 0.6 | 2.7 | | Haryana | 0.1 | 0.6 | 0.9 | | Jharkhand | 1.7 | 8.0 | 26.7 | | Kerala | 0 | 0 | 0.1 | | Madhya Pradesh | 1.6 | 10.8 | 28.8 | | Punjab* | 2.7 | 17.8 | 45.4 | | Rajasthan | 0.6 | 3.9 | 8.6 | | West Bengal | 1.1 | 9.5 | 23.8 | *: Dhasmana, I. (2022). “Not all states are so financially weak that they can’t announce freebies”. Business Standard. April 2022.
Source: Budget documents of the state government. | The Centre’s GST compensation payout will come to an end in June 2022, further reducing the headroom available for social sector expenditure. In such a situation, a multitude of social welfare schemes in the form of freebies will not only put a heavy burden on the exchequer but will also exert upward pressures on yields if they are financed through market borrowing. It will be important, therefore, for the state governments to reprioritise their expenditure to achieve optimum long-term welfare advantages by ensuring that the beneficiaries get empowered permanently and forego such benefits. Also, states should ensure that there is a sunset clause for each social sector scheme. Reducing the quantum of subsidies by ensuring that only the deserving receive them will free up resources to invest in health, education, agriculture, R&D and rural infrastructure, which will help create more jobs and reduce poverty on a sustainable basis (Gulati 2022). Contingent Liabilities Contingent liabilities are the contractual obligations of the government to pay in the event of a default by the borrower, either on the principal amount borrowed or interest payments on such amount or both. The contingent liabilities of states have been rising in recent years. As per the latest available information, the off-budget borrowings by states - loans raised by state-owned entities and guaranteed by the state governments - have reached around 4.5 per cent of GDP in 2022 (CRISIL, 2022). While the power sector accounts for almost 40 per cent of these guarantees, other beneficiaries include sectors like irrigation, infrastructure development, food and water supply. Contingent liabilities have surpassed 5 per cent of GSDP in states like Punjab, Rajasthan, Uttar Pradesh and Andhra Pradesh (Table 6). DISCOMs Bailouts The power sector accounts for much of the financial burden of state governments in India, both in terms of subsidies and contingent liabilities. Illustratively, many state governments provide subsidies, artificially depressing the cost of electricity for the farm sector and a section of the household sector. State governments also infuse capital into power distribution companies (DISCOMs) through equity and debt to enable them to undertake productive investments. Additionally, periodic bailouts (3 bailouts of DISCOMs in the last 20 years16) wherein states take over either the losses or the debt burden of the DISCOMs have substantial repercussion for state finances. | Table 6: Guarantees issued by State Governments (Per cent of GSDP) | | | Bihar | Kerala | Punjab | Rajasthan | West Bengal | Andhra Pradesh | Uttar Pradesh | Haryana | | 2017-18 | 1.1 | 2.5 | 4.5 | 7.5 | 0.9 | 4.6 | 6.3 | 2.2 | | 2018-19 | 1.0 | 3.4 | 0.9 | 7.6 | 0.6 | 6.2 | 6.9 | 2.6 | | 2019-20 | 0.9 | 3.2 | 4.1 | 8.1 | 0.5 | 8.1 | 6.7 | 2.7 | | 2020-21 (RE) | 3.4 | 3.9 | 5.3 | 8.6 | 0.6 | 9.0 | 8.0 | NA | NA: Not Available
Sources: Budget documents of state government; state governments; and PRS Legislative Research (PRS). | Despite various financial restructuring measures17, the performance of the DISCOMs has remained weak, with their losses surpassing the pre-UDAY level of 0.4 per cent of GDP in 2018-19 (Chart 9a). In addition, their long-term debt started increasing since 2017-18, surpassing the pre-UDAY level by 2018-19 and rising further in 2019-20 (Chart 9b). The combined losses of DISCOMs in the five most indebted states, viz., Bihar, Kerala, Punjab, Rajasthan and West Bengal, constituted 24.7 per cent of the total DISCOMs losses in 2019-20, while their combined long-term debt was 22.9 per cent of the total DISCOM debt in 2019-20 (Chart 9c). Furthermore, overdues of DISCOMs to power generating companies (GENCOs) have increased since March 2018 (with some moderation during November 2020 to April 2021 due to the additional liquidity provided to DISCOMs under the Atma Nirbhar Bharat Abhiyan)18 which may require fresh liquidity injections to ensure uninterrupted power supply (Chart 9d). 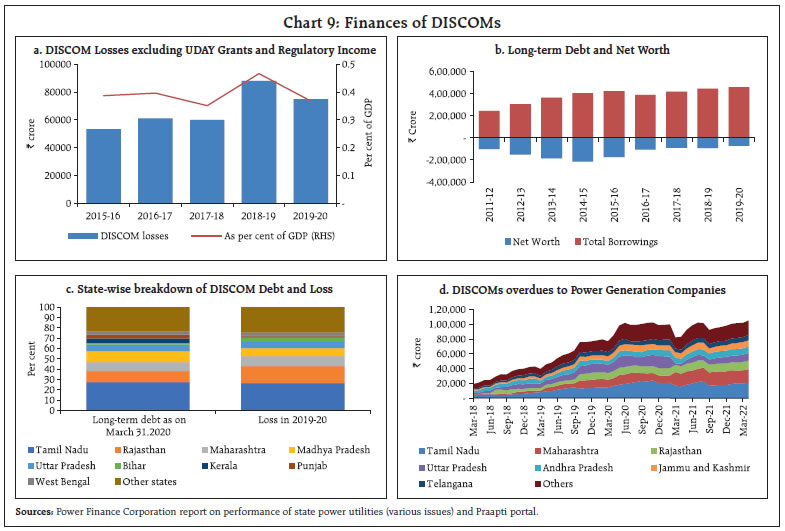 A rescue package for the DISCOMs may involve substantial financial burden for the states. For instance, if: (i) 75 per cent of the long-term debt of the DISCOMs (as at end-March 2020) is taken over by the state governments (similar to UDAY); and (ii) the states infuse liquidity (in the form of equity) into the DISCOMs to the tune of overdue outstanding to the GENCOs as of April 2022, the burden on the exchequer will be significant. For the 18 major states, the cost of the bailout will be 2.3 per cent of their combined GSDP, though there are significant differences amongst states. Tamil Nadu, Madhya Pradesh, Rajasthan and Punjab are most vulnerable to a possible bailout while Gujarat, Assam, Haryana and Odisha are relatively insulated from this risk (Table 7). For avoiding such bailouts, going forward, the DISCOMs need to undertake appropriate tariff revisions that reflect the underlying cost of power supply, keeping in view the rising cost of imported coal. The overall risk rating of state governments, based on the sources, nature, and quantum of risks are summarised (Chart 10).
IV.2 Debt Forecasts and Stress Testing In the base case scenario, for all the states taken together, the debt-GSDP ratio is projected to moderate between 2021-22 and 2026-27 (underlying assumptions are set out in Annex 2). The moderation in the ratio is primarily attributable to the stellar fiscal performance of a few states, namely, Gujarat, Maharashtra, Delhi, Karnataka and Odisha. Most of the other states are likely to exceed the debt-GSDP ratio of 30 per cent in 2026-27. Punjab is expected to remain in the worst position as its debt-GSDP ratio is projected to exceed 45 per cent in 2026-27, with further deterioration in its fiscal position. Rajasthan, Kerala and West Bengal are projected to exceed the debt-GSDP ratio of 35 per cent by 2026-27. These states will need to undertake significant corrective steps to stabilise their debt levels (Table 8). 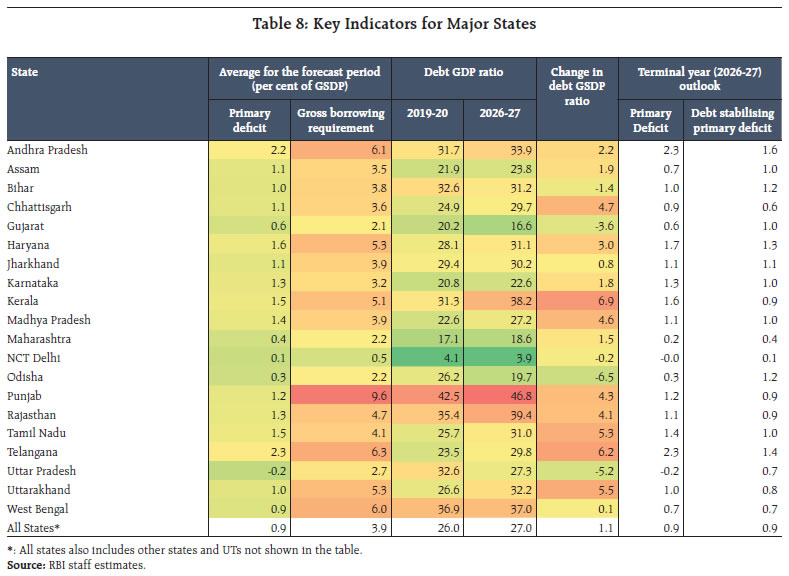 For all states taken together, the decline in the debt-GSDP ratio is driven by favorable interest rate - growth differential (the difference between the impact of real interest rate and real GDP growth) that offsets the accruals to debt from primary deficits (Chart 11). The decline is more pronounced in the initial years of the forecast due to high inflation.19 This pattern is broadly shared by the five most indebted states, except in the case of Punjab and Rajasthan where debt begins to rise after declining in the initial years. Stress Testing State finances are vulnerable to a variety of unexpected shocks that might alter their fiscal outcomes, causing slippages relative to their budgets and expectations. For some states, shocks may increase their debt by a significant amount, posing fiscal sustainability challenges. Some hypothetical scenarios are created based on past events and the risk ratings for the states. Among the 5 most indebted states, Punjab and Rajasthan appear to be most vulnerable to fiscal shocks arising out of realisation of contingent liabilities (Table 9). Financial restructuring or bailout of ailing DISCOMs will also have most severe impact on the debt-GSDP ratio of these two states. The financial risks from freebies seem to be moderate in case of these states, except Punjab which spends a large amount on provision of free utilities. | Table 9: Impact on Debt to GSDP under different Scenarios | | States | Scenario 1
(Contingent Liabilities fully invoked) | Scenario 2
(UDAY-like bailout of DISCOMs) | Scenario 3
(Own Tax Revenue Growth Shock) | Scenario 4
(Subsidies/Freebies Financed through Borrowings) | | Bihar | 3.4 | 0.8 | 0.9 | 0.1 | | Kerala | 3.9 | 1.8 | 0.7 | 0.0 | | Punjab | 5.3 | 2.5 | 1 | 2.7 | | Rajasthan | 8.6 | 3.7 | 0.4 | 0.6 | | West Bengal | 0.9 | 0.9 | 0.7 | 1.1 | Note: Scenario 1: If the contingent liabilities (as a per cent of GSDP) is invoked, the debt to GSDP ratio of Rajasthan and Punjab could increase substantially (by 5.3 and 8.6 percentage points, respectively).
Scenario 2: In the case of a UDAY-like bailout, if the states takeover 75 per cent of the DISCOMs debt as at end-March 2020, the debt burden of Punjab, Bihar and Rajasthan may increase by 2.5, 1.8 and 3.7 percentage points, respectively.
Scenario 3: Own tax revenue shock is taken as the minimum of all the negative deviations from the mean of own tax revenue to GSDP ratios of the states in the last ten years (from 2012-13 to 2021-22). The impact of own tax revenue shocks will be relatively modest at less than 1 per cent of GSDP.
Scenario 4: Financing of freebies entirely through market borrowings will have a mild to moderate impact on the finances of the most indebted states.
Sources: Budget documents of states; Power Finance Corporation Reports; and information collected from state governments. | V. Conclusions The recent economic crisis in neighbouring Sri Lanka is a reminder of the critical importance of public debt sustainability. The fiscal conditions among states in India are showing warning signs of building stress. The slowdown in own tax revenue, a high share of committed expenditure and rising subsidy burden have stretched state government finances exacerbated by COVID-19. For the five most indebted states, the debt stock is no longer sustainable, as the debt growth has outpaced their GSDP growth in the last five years. New sources of risks have emerged – relaunch of the old pension scheme by some states; rising expenditure on non-merit freebies; expanding contingent liabilities; and the ballooning overdue of DISCOMs - warranting strategic corrective measures. Stress tests show that the fiscal conditions of the most indebted state governments are expected to deteriorate further, with their debt-GSDP ratio likely to remain above 35 per cent in 2026-27. As a corrective measure, the state governments must restrict their revenue expenses by cutting down expenditure on non-merit goods in the near term. In the medium term, these states need to put efforts towards stabilising debt levels. Further, large scale reforms in power distribution sector would enable the DISCOMs to reduce losses and make them financially sustainable and operationally efficient. In the long term, increasing the share of capital outlays in the total expenditure will help create long-term assets, generate revenue and boost operational efficiency. Alongside, state governments need to conduct fiscal risk analyses and stress test their debt profiles regularly to be able to put in place provisioning and other specific risk mitigation strategies to manage fiscal risks efficiently. References Adams, C., Ferrarini, B. and Park, D. (2010). “Fiscal Sustainability in Developing Asia.” ADB Economics Working Paper. Series No. 205, Mandaluyong City: Asian Development Bank. Bohn, H. (1998). “The Behavior of U.S. Public Debt and Deficits.” The Quarterly Journal of Economics, 113(3), 949–963. http://www.jstor.org/stable/2586878 CRISIL (2022). ‘Off-balance-sheet borrowings of states may have reached a decadal high of 4.5% of GSDP’ May 04, 2022. Available at: https://www.crisil.com/en/home/newsroom/press-releases/2022/05/off-balance-sheet-borrowings-of-states-may-have-reached-a-decadal-high-of-4-point-5-percent-of-gsdp.html Gopalan, R. (2013). “We understand the harmful effect of subsidies.” Interview with economic affairs secretary, Business Standard, January 21, 2013. Gulati, Ashok and Juneja Ritika (2022) “The poverty debate is an opportunity for food subsidy reforms”, Financial Express, April 25, 2022. IMF (2016). “Analyzing and Managing Fiscal Risks – Best Practices”. IMF Policy Paper. IMF (2000). “A Framework for Assessing Fiscal Vulnerability.” IMF Working Papers 2000, 052, A001, available from: https://doi.org/10.5089/9781451847246.001.A001> [Accessed 11 June 2022] Kaur, B., Mukherjee, A. and Ekka, A.P. (2018) “Debt sustainability of states in India: An assessment.” Ind. Econ. Rev. 53, 93–129 (2018). https://doi.org/10.1007/s41775-018-0018-y Singh, N.K. (2022). “In a free fall” The Indian Express. April 21, 2022. Available at: https://indianexpress.com/article/opinion/columns/freebies-are-a-passport-to-fiscal-disaster-7879244/ Tiwari, A. (2012). “Debt Sustainability in India: Empirical Evidence Estimating Time-Varying Parameters.” Economics Bulletin. 32. 1133-1141. Websites: https://cag.gov.in/en https://www.pfcindia.com/ https://www.business-standard.com/
| Annex 1: List of some recent Schemes of Financial Assistance/ Subsidies announced by the States | S.
No. | Scheme | Description | Allocation for 2022-23 (BE)
(in ₹ Crore) | As per cent of GSDP | As per Cent of Revenue Receipts | As per cent of Own Tax Revenue | | ANDHRA PRADESH | | 1. | Jagananna Ammavodi | Financial assistance of ₹15000 to the students’ mother to encourage parents to send children to school | 6,500 | 0.5 | 3.4 | 7.1 | | 2. | YSR Aasra | Reimbursement of the outstanding bank loans of SHGs as on 11.04.2019 | 6,400 | 0.5 | 3.3 | 7.0 | | 3. | Electricity Subsidy | Free power supply/ concessional power supply/ cash transfer for electricity for agriculture/ to horticulture farmers/aqua culture farmers. | 5000 | 0.4 | 2.6 | 5.5 | | 4. | YSR Cheyutha | Financial assistance of ₹75,000 to women in the age group of 45-60 years belonging to SC, ST, BC, and minorities to improve their livelihood. | 4,236 | 0.3 | 2.2 | 4.7 | | 5. | YSR Rythu Bharosa | Financial assistance of ₹7500 per farmer family including tenants and ₹13,500 to landless cultivators belonging to SC, ST, BC, Minorities. | 3,900 | 0.3 | 2.0 | 4.3 | | 6. | YSR Sunna Vaddi Panta Runalu | Subsidy on interest for crop loans up to ₹1,00,000 to the farmers. | 500 | 0.0 | 0.3 | 0.5 | | 7. | Dr. YSR Aarogya Aasara | Financial assistance of ₹225 per day as post-operative sustenance allowance to patients for the post-operation recovery period | 300 | 0.0 | 0.2 | 0.3 | | 8. | YSR Vahana Mitra | Financial assistance of ₹10,000 per annum to self-owned auto/taxi drivers for meeting expenses on insurance, fitness certificate, repairs, and other requirements. | 260 | 0.0 | 0.1 | 0.3 | | 9. | Financial support to religious persons | Salary and remuneration fund to Archakas and other employees | 120 | 0.0 | 0.1 | 0.1 | | Incentives to Imams and Mouzans | 126 | 0.0 | 0.1 | 0.1 | | 10. | YSR Nethanna Nestham | Financial assistance of ₹24,000/- per annum to every handloom owning weaver family to modernize equipment. | 199 | 0.0 | 0.1 | 0.2 | | Total | 27,541 | 2.1 | 14.4 | 30.3 | | BIHAR | | 1. | Sashakt mahila, Saksham mahila | Cash incentives to female students for completing senior secondary and graduation | 900 | 0.1 | 0.5 | 2.2 | | 2. | Mukhya Mantri Balika Cycle Yojana | Financial assistance of ₹3000 per female student | 200 | 0.0 | 0.1 | 0.5 | | Total | 1,100 | 0.1 | 0.6 | 2.7 | | JHARKHAND | | 1. | Electricity subsidy | Free electricity up to 100 units to farmers and poor | 4,855 | 1.2 | 5.8 | 19.5 | | | | Tariff subsidy to the consumers | 1,800 | 0.4 | 2.2 | 7.2 | | 2. | Guruji Credit Card Scheme | Soft loan up to loan up to ₹10 lakhs at a low interest rate without mortgage to student for pursuing higher education. | - | | | | | Total | 6,655 | 1.7 | 8.0 | 26.7 | | KERALA | | 1. | Interest subsidy | On prompt repayment of agricultural loans taken from co-operative institutions | 50 | 0.0 | 0.0 | 0.1 | | Total | 50 | 0.0 | 0.0 | 0.1 | | MADHYA PRADESH | | 1. | Electricity subsidy | To farmers and domestic users | 21,000 | 1.6 | 10.8 | 28.8 | | Total | 21,000 | 1.6 | 10.8 | 28.8 | | PUNJAB20 | | 1. | Electricity Subsidy | Free electricity up to 300 units to every household | 5,000 | 0.8 | 5.2 | 13.4 | | 2. | Waiver | Waive off pending electricity bills. | - | | | | | 3. | Financial Assistance to Women | Financial assistance of ₹1000 to every adult woman for female empowerment | 12,000 | 1.9 | 12.6 | 32.1 | | Total | 17,000 | 2.7 | 17.8 | 45.4 | | RAJASTHAN | | 1. | Electricity subsidy | Free electricity up to 50 units for those consuming less than 100 units and concessional rates for higher consumption slab | 4500 | 0.3 | 2.1 | 4.6 | | 2. | Mukhya Mantri Digital Seva Yojana | Provision of free smart phones to the lady heads of the Chiranjeevi families for 3 years | 2500 | 0.2 | 1.2 | 2.5 | | 3. | Waivers | Farm loan waivers | 1,000 | 0.1 | 0.5 | 1.0 | | 4. | Indira Gandhi Matritave Poshan Yojana | Financial assistance of ₹6000 on birth of second child to pregnant women | 210 | 0.0 | 0.1 | 0.2 | | 5. | Mukhya Mantri Divyang Scooty Yojana Scheme, Kali Bal Bheel and Devnarayan Yojana | Provision of free scooties to students | 170 | 0.0 | 0.1 | 0.2 | | 6. | Rajasthan Krishi Shramik Sambal Mission | Financial assistance of ₹5000 to landless farmers to purchase agricultural equipment | 100 | 0.0 | 0.0 | 0.1 | | 7. | Byaj Maafi Yojana | Waiver of mandi charges | | | | | | Total | 8,480 | 0.6 | 3.9 | 8.6 | | WEST BENGAL | | 1. | Lakshmi Bhandar | Financial assistance of ₹1000 to every SC/ST woman and ₹500 to every other woman for their financial empowerment | 10,767 | 0.6 | 5.4 | 13.6 | | 2. | Krishak Bondhu | One Time Grant to the Family of Deceased Farmer under Krishak Bondhu | 500 | 0.0 | 0.3 | 0.6 | | Financial assistance of ₹10,000 to all farmers for agricultural purposes | 4,994 | 0.3 | 2.5 | 6.3 | | 3. | Kanyashree Prakalpa | Annual incentive of ₹75 and one-time grant of ₹25,000 to ensure that girls stay in school and delay their marriage until after 18 years of age. | 1866.2 | 0.1 | 0.9 | 2.4 | | 4. | Rupashree Prakalpa | Financial assistance of ₹25000 per indigent women for the purpose of marriage | 750 | 0.0 | 0.4 | 0.9 | | Total | 18,877 | 1.1 | 9.5 | 23.8 | | HARYANA | | 1. | Monthly stipend to SC/ BPL/BC students | monetary incentive to improve the educational avenues of the students and enhance their admission and retention. | 242 | 0.0 | 0.2 | 0.3 | | 3. | Mukhjya Manti Vivha Shagun Yojana | Financial assistance to poor families, widows, destitute women, sportspersons for the marriage of their daughters. | 180 | 0.0 | 0.2 | 0.2 | | 4. | Aapki Beti, Humari Beti (Ladli) Scheme | Financial assistance of ₹21,000 on birth of first and second girl child to SC and BPL families. | 160 | 0.0 | 0.2 | 0.2 | | 5. | Stipend to college students | Stipends of ₹1000 per month to all SC students in government college in the State for their upliftment and welfare. | 45 | 0.0 | 0.0 | 0.1 | | 6. | Free Bicycles | Provision of free bicycles to SC students in classes IX to XII. | 6 | 0.0 | 0.0 | 0.0 | | 7. | Scheme for Welfare of Scheduled Castes Families Fisheries Sector | Financial assistance will be provided to the fish farmers, fishermen and fish contractors of notified waters in the State. | 5.6 | 0.0 | 0.0 | 0.0 | | Total | 638.6 | 0.1 | 0.6 | 0.9 | Note: Data for Punjab pertains to 2021-22 while for the other states it pertains to 2022-23 (BE).
Source: Budget documents of the States. |
| Annex 2: Assumptions for the State-Level Debt Sustainability Model | | Variable | Assumptions | | Gross State Domestic Product (GSDP) at constant prices | • For FY 2021-22, data for 18 states is directly obtained from MOSPI. The all states average GSDP is assumed to be the same as the weighted average of these 18 states.
• For FY2022-23 to FY 2026-27, the consolidated GSDP of all states is assumed to grow based on IMF projections.
• Inter-state differences in growth rates are accounted for by assuming the relative growth performance of the state in the projection period will follow the 5-year average of period of 2014-15 to 2018-19. | | Inflation based on GDP deflator | • For FY2021-22, data for 18 states is directly obtained from MOSPI. For the remaining states, average inflation of these 18 states is assumed.
• For FY2022-23 to FY 2026-27, inflation is based on IMF projections. All states are assumed to have the same inflation. | | Primary deficit | • For FY2022-23, data for 23 states is directly obtained from budgets. For the remaining states, state’s primary deficit as a per cent to GSDP is assumed to be the historical average of the 10-year period from 2009-10 to 2018-19.
• For FY2022-23 to FY2026-27, state’s primary deficit (after netting out the one time impact of DISCOM bailouts under UDAY) as a per cent of state’s GSDP is assumed to be the historical average of the 10-year period from 2009-10 to 2018-19.
• For Andhra Pradesh, 2014-15 is excluded from the average considering the year of bifurcation of the state. For Telangana, average of 2015-16 to 2018-19 is considered in making assumptions for the forecast period. | | Interest rate | • Yield on fresh borrowings assumed to be 7.3 per cent in 2022-23 based on the price discovered in auctions in April and May 2022.
• Yield assumed to decline gradually to 6.9 per cent by 2026-27 with softening inflationary conditions. |
|