In a global landscape marred by fears of recession and war, the Indian economy shows resilience. The recent revival of the monsoon, the pick-up in manufacturing and services, stabilisation of inflation pressures and strong buffers in the form of adequate international reserves, sufficient foodgrain stocks and a well-capitalised financial system together brighten the outlook and strengthen the conditions for a sustainable high growth trajectory in the medium-term. Introduction India’s inflation is on the backfoot. For the second month in a row in June, headline CPI inflation eased in India, according to the July 12, 2022 data release of the National Statistics Office (NSO), on the back of receding food inflation. Very grudgingly, as we foretold, but diverging from the global central tendency. Fingers are crossed, but time may prove our other oracle true – that the worst of inflation may be behind us. Several global developments are pointing in that direction. First, central banks across the world are engaged in the most aggressive monetary policy tightening in decades so much so that financial markets wilt in the fear of imminent recession. Second, commodity prices are easing across the board, with even announcements of a big stimulus failing to halt their meltdown. Third, supply chain pressures are edging down globally and in India. Prices of goods, which were caught up in supply chain tangles are approaching a tipping point. Fourth, retailers that had built inventories are cutting prices to shift stock. Fifth, both input and output in the global manufacturing purchasing managers’ index (PMI) moderated in June. In India too, such positive developments may gradually appear. Formation of falling international commodity prices into a trend may encourage food manufacturing companies to stop ‘shrinkflating’ and start reducing prices. Manufacturing and services input and output prices moderated in June, the former down to a 3-month low. Furthermore, suppliers’ delivery time turned positive for the first time since February 2021 reflecting the easing of supply chain constraints facing India. Most importantly, monetary policy has gone on to the front foot against inflation and as Governor Shri Shaktikanta Das pointed out: “…..our current assessment is that inflation may ease gradually in the second half of 2022-23, precluding the chances of a hard landing in India”1. Amidst growing apprehensions of recession, the global manufacturing PMI fell in June 2022 to a 22-month low as new orders moderated and international flows declined. Reflecting ongoing improvement in demand, however, the global services PMI accelerated to its highest level since April 2011 and saved the blushes. Meanwhile, reshoring of supply chain has begun. Businesses are shifting to dual sourcing, long term contracts, and vertical integration of production processes to gain strategic control. Foreign direct investment (FDI) is transforming, with more of reinvestment from local subsidiaries and less of capital invested by parents from across borders. More than 100 countries accounting for 90 per cent of global GDP are pursuing ‘make at home’ policies which include strategic control over technologies and key inputs. One global development that almost flew underneath the radar is that the annual rate of world population growth fell below one per cent for the first time since 1950. It is projected to slow even further through this century. Low fertility rates are combining with improvements in healthcare to accelerate the aging of the human species, which in turn will impact global growth adversely. Although the global population will reach 8 billion this year – 1 billion in 1804; 4 billion in 1974; and 7 billion in 2011 – the populations of 61 countries are projected to decline between 2022 and 2050. Eventually, the world’s population is expected to peak at 10.4 billion in the 2080s and then begin to fall. Global life expectancy, which was 72.8 years in 2011, fell to 71 years in 2021 under the impact of the COVID-19 pandemic. India is set to become the most populous country in the world by 2023. According to the fifth round of the National Family Health Survey, 2019-21, released by the Ministry of Health and Family Welfare (MOHFW) in May 2022, however, India’s fertility rate – the number of children a woman bears in her child bearing life time – has fallen below 2.1, the rate at which the population can replace itself. Back to the here and now. COVID-19 infections have been rising in India with new mutations of the virus. High frequency indicators of economic activity are mixed. Green shoots of revival in contact-intensive services are breaking through. The Indian economy is showing resilience and dynamism in spite of the geopolitical situation and high risk aversion in financial markets that is stampeding portfolio investors and taking down all currencies against the unrelenting strength of the US dollar. Apparently, markets are differentiating between currencies on the basis of the size and speed of monetary policy tightening relative to the US Fed. In comparison with peers, the depreciation of the INR has been modest at 5.1 per cent on a financial year basis and 7.0 per cent on a calendar year basis to date. In its assessment of financial sector soundness and resilience, the June 2022 issue of the RBI’s Financial Stability Report released on June 30, 2022 points out that capital in the banking system is high at 16.7 per cent of risk weighted assets at the end of March 2022, with tier 1 capital of 13.6 per cent. For urban cooperative banks, the capital to risk weighted asset ratio (CRAR) rose to 15.8 per cent and for non-banking financial companies (NBFCs) to 26.9 per cent for the same reference date. For banks, profitability has improved and gross non-performing assets have fallen to a six year low as a ratio of total assets, with the net non-performing assets ratio at 1.7 per cent. Banks stand up well to stress testing, with all banks able to comply with minimum capital requirements under a severe stress scenario. Network analysis shows that bilateral exposures are lower than pre-pandemic levels, reducing contagion risks. Global spillovers and financial markets are assigned high risk, with global uncertainty, commodity prices, geopolitical conditions and monetary policy normalisation as main drivers. Set against this backdrop, the remainder of the article is structured into four sections. Section II captures the rapidly evolving developments in the global economy. An assessment of domestic macroeconomic conditions is presented in Section III. Section IV reviews financial conditions in India. The last Section concludes the article. II. Global Setting Aggressive monetary tightening and the protracted war in Europe continue to weigh down global growth prospects during 2022 and 2023 (Chart 1). Model-based nowcast of quarter on quarter (Q-o-Q) growth of global GDP shows that it is in contraction in Q1 and Q2 of 2022 (Chart 2).2 Among high frequency indicators, the global composite PMI picked up in June 2022 to 53.5 from 51.3 a month ago (Chart 3). While the manufacturing PMI declined marginally to 52.2 – its lowest level since August 2020 – the services PMI accelerated to 53.9 from 51.9 a month ago. A silver lining is that input costs rose at the slowest rate in four months, reflecting easing of supply constraints and lower inventory build-up. Output prices also moderated, indicating that faltering demand appears to be stalling the momentum of global inflation. Global merchandise trade volume growth accelerated to 3.1 per cent (y-o-y) in April from 2.0 per cent in March on positive monthly momentum as well as a favourable base effect (Chart 4a). The Baltic Dry Index, a measure of shipping charges for dry bulk commodities, spiked in May before shedding 14.8 per cent in June (Chart 4b).
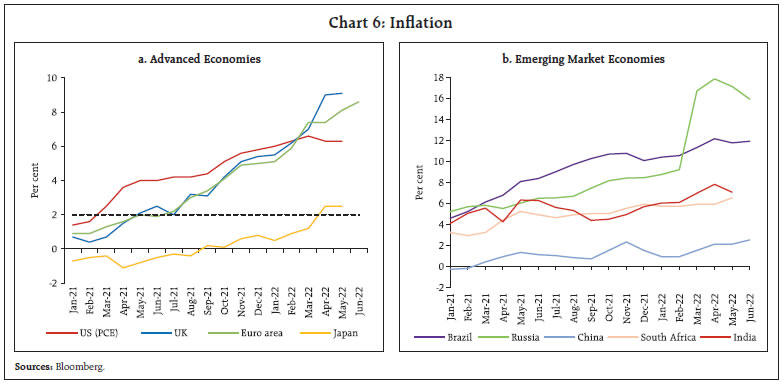
The World Investment Report (2022) released in June reveals that global foreign direct investment (FDI) which grew 64 per cent in 2021 from an exceptionally low level in 2020 is unlikely to be sustained. Data for Q1:2022 show greenfield projects and international project finance deals down by 21 per cent and 4 per cent, respectively. The Bloomberg commodity price index witnessed a correction in the second half of June, averaging 7 per cent below the first half’s average (Chart 5a). Crude oil prices exhibited heightened volatility and changing momentum owing to exceptionally stringent supply conditions. The renewed pledge by the G7 of further sanctions against Russia while also considering a price cap for Russian oil sent mixed signals to the oil markets. Overall, crude oil prices have recorded a 36.7 per cent gain year to date (up to July 15, 2022) despite a moderation in June 2022 (Chart 5b). Oil prices have been exhibiting a softening bias in July – on July 6, oil prices fell below US$100 for the first time since April 25 on the back of recession fears and the strong US dollar. Nonetheless, risks remain as the International Energy Agency’s (IEA) oil market report for June 2022 projected that world oil demand would reach 101.6 million barrels per day in 2023. On the supply side, non-OPEC economies are set to account for nearly 80 per cent of growth next year; non-OPEC+3 is set to add 1.9 million barrels per day in 2022 and 1.8 million of barrels per day in 2023. As on July 8, 2022 Brent futures averaged around US$102 per barrel for 2022 and US$90 per barrel for 2023. 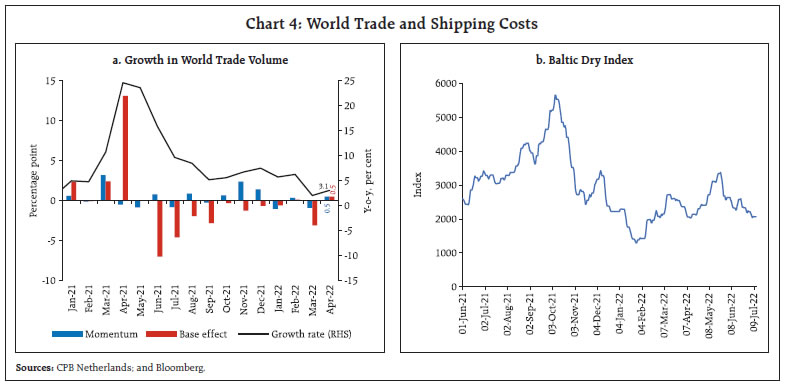 Gold prices have continued to tumble for the third consecutive month with futures data also showing a lower trajectory of prices than a month ago (Chart 5c). The FAO food price index retreated for the third successive month to 154.2 in May from the all-time high registered in March due to moderation in prices of vegetable oil, cereal and sugar while meat and dairy prices continued to increase (Chart 5d). The war has severely affected the supply of foodgrains as Russia and Ukraine account for a quarter of global exports of wheat, a fifth of barley and maize exports, and more than half of sunflower oil exports. They also provide about an eighth of all calories traded in the world4. Two-thirds of the world is suffering inflation above 7 per cent, though there are signs that the pace of acceleration in inflation is slowing down in some countries. The US headline CPI inflation (y-o-y) soared to 40-year high of 9.1 per cent in June 2022 from 8.6 per cent a month ago, the highest since November 1981. The monthly momentum of 1.3 per cent in June was the largest in 17 years, with energy prices increasing 7.5 per cent (m-o-m) and contributing nearly half of the overall momentum in CPI. Core inflation, however, moderated to 5.9 per cent in June from 6.0 per cent in May due to favourable base effects. Euro area annual inflation soared to a new record of 8.6 per cent in June, primarily driven by energy and followed by food, alcohol and tobacco. CPI inflation in the UK also accelerated to a fresh peak of 9.1 per cent (y-o-y) in May 2022, with food and non-alcoholic beverages contributing the highest to the monthly momentum (Chart 6a). Among BRICS economies, inflation in Brazil at 11.9 per cent in June remained in double digits for the tenth consecutive month, while in China, it rose to a twenty-two month high of 2.5 per cent (Chart 6b). In Russia, the annual inflation rate fell to 15.9 per cent in June of 2022 from 17.8 percent in the previous month, the lowest inflation rate since it entered double-digit territory in March. 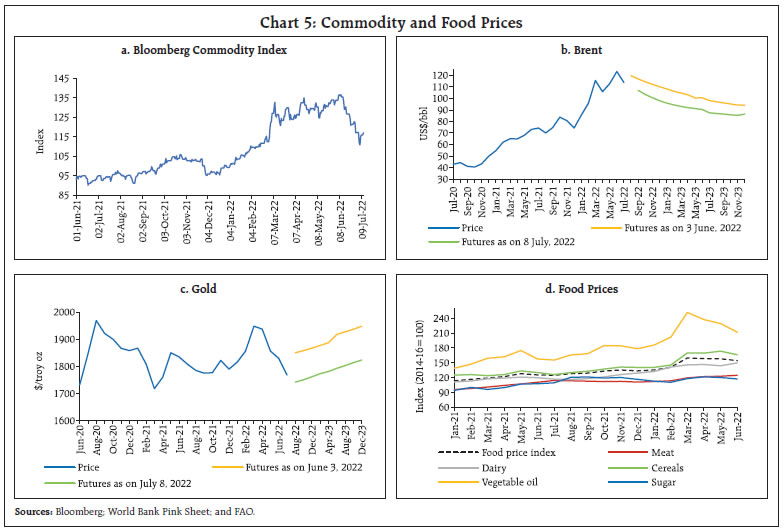
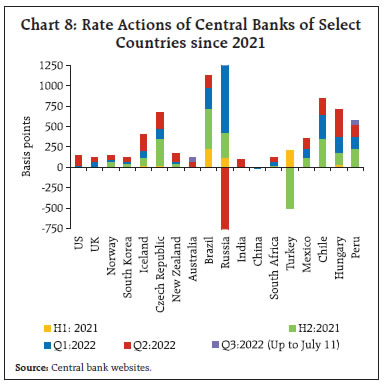
 After a sell-off in early June, global financial markets recovered marginally towards the end of June. The MSCI World Equity Index shed 22 per cent year to date (up to July 15, 2022) as AE equity index declined by 22 per cent while EME equity index declined by 21.6 per cent (Chart 7a). In the bond markets, the US Treasury yield spread (10 year minus 2 year) narrowed markedly, averaging 7 bps in the second half of June vis-a-vis 19 bps for the first half. Policy rate sensitive short-term yields spiked while longer-term yields softened due to the dampening medium term growth outlook (Chart 7b). In fact, a yield curve inversion — one of the most widely used indicators of an impending recession – took place in the early days of July, suggesting that the US economy might be heading towards a hard landing. The dollar index picked up momentum considerably after weakening in the first half of the month (Chart 7c). Most EME currencies underwent downward corrections with net portfolio outflows (Chart 7d). Monetary tightening continued synchronously across the globe in June 2022 with many central banks increasing the pace of tightening to tackle historically high levels of inflation. Sixty increases in key interest rates were effected by major central banks during March-May 2022.5 In its June meeting, the US Federal Reserve raised the target range of the Federal Funds rate by 75 basis points (bps) to 1.5 - 1.75 per cent, the first 75 bps hike in 28 years, resulting in a cumulative hike of 150 bps since March 2022. Chairman Powell also signaled a 50-75 bps hike for the next meeting. The ECB Governing Council met for an ad hoc meeting on June 15, 2022 to calm jittery markets and reassure that it would apply flexibility in reinvesting redemptions falling due in the Pandemic Emergency Purchase Programme (PEPP) portfolio. In its June meeting, the Bank of England (BoE) raised its policy rate by 25 bps, taking it to 1.25 per cent. The Bank of Japan reiterated its accommodative stance with yield curve control, thereby remaining in direct contrast to its peers. Most EME central banks have continued with policy tightening, including Hungary, Mexico and Brazil which hiked their benchmark rates by 185 bps, 75 bps and 50 bps respectively in their latest meetings (Chart 8). On the other hand, the People’s Bank of China maintained status quo on its policy rates after reducing the 5-year loan prime rate (LPR), mortgage reference rate by 15 bps to 4.45 per cent in its May policy announcement. 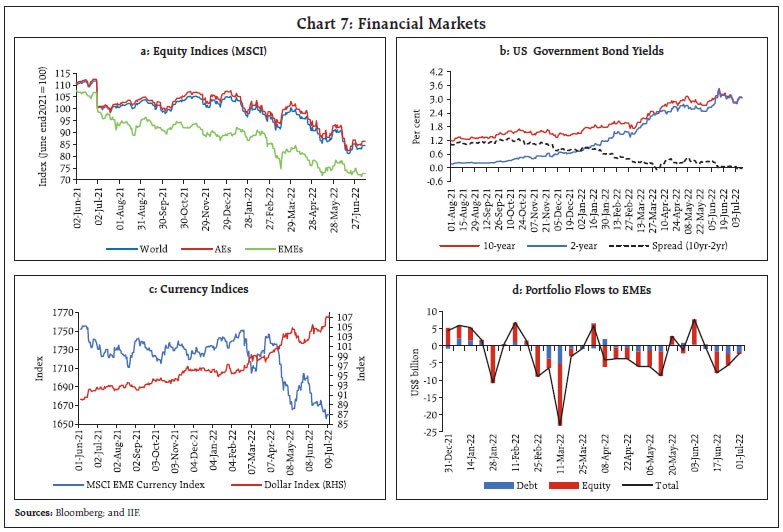
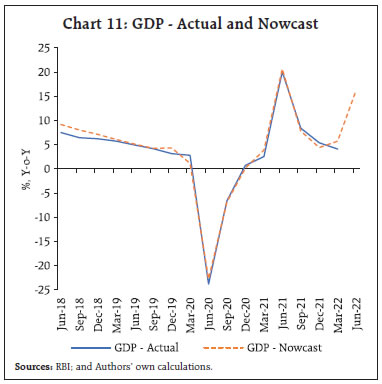
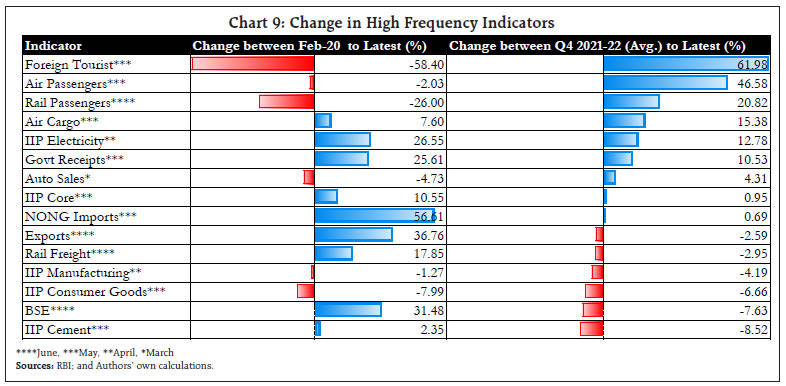 III. Domestic Developments Several indicators suggest that the Indian economy is making resilient progress in Q1:2022-23 inspite of the drag from global spillovers, elevated inflation and some slackening of external demand as geopolitical developments take their toll on world trade. Domestically, the number of new Covid-19 cases increased6 and an intense heatwave in major regions limited economic activity, despite which most of the high frequency indicators showed improvement especially in services sector activity (Chart 9). There were also significant improvements in domestic supply delivery time, backlogs and decline in truck freights which was reflected in the fall of index of supply chain pressures for India (ISPI)7 (Chart 10). Our 27 factor nowcasting model (Kumar, 2020) places real GDP growth in Q1:2022-23 at 16.2 per cent, in line with the RBI’s projection, but above the median forecast of professional forecasters at 14.0 per cent. Although this largely reflects base effects of the steep contraction in the corresponding quarter a year ago, the nowcast finds quarter-on-quarter positive momentum of 0.9 per cent versus 0.7 per cent in the previous quarter (Chart 11). 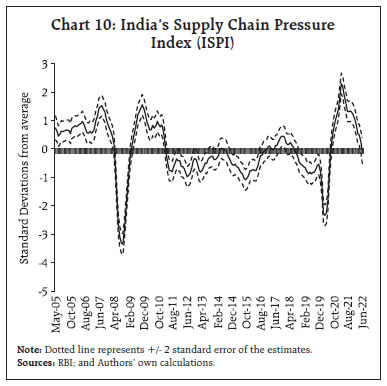
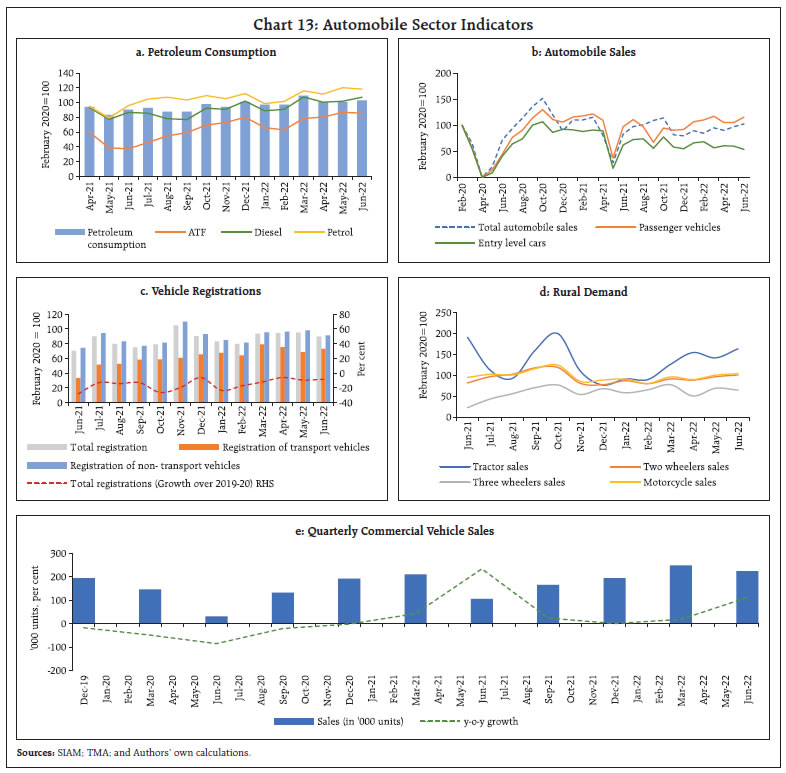
 Aggregate Demand Mixed signals characterise the evolution of aggregate demand in June and July. Sequential stagnation in e-way bills, on account of moderation in inter-state e-way bills points to an ebbing of inter-state trading activity in June, even as intra-state trading remained robust (Chart 12a). Toll collections plateaued in terms of both value and volume (Chart 12b). Fuel consumption increased in June, aided by increased off-take in high speed diesel, even as petrol and aviation turbine fuel (ATF) consumption recorded a marginal dip (Chart 13a). Furthermore, the entry level passenger vehicle (PV) segment (in the range of under 3600 mm) dipped further in June, its share falling to 15.2 per cent of total PV sales, from 16.1 per cent in June 2021 (Chart 13b). Retail sales of automobiles were dampened in June by a fall in registration of non-transport vehicles, primarily two-wheelers which constitute 80 per cent of total non-transport vehicle registrations (Chart 13c). The fast moving consumer goods (FMCG) sales ebbed in June 2022, with urban FMCG demand recording a steeper decline – especially in tier 2 cities – reflecting the impact of high inflation.8 On the other hand, automobile sales surpassed pre-pandemic levels led by continuing improvement in passenger vehicle sales. Within automobiles, rural demand reflected buoyancy, with tractor sales remaining robust on the back of good returns on Rabi crop and government’s approval of an increase in MSP for all Kharif crops. Domestic sales of two wheelers and motorcycle sales crossed pre-pandemic levels, although the three-wheeler segment continued to lag (Chart 13d). With the advancement of Southwest monsoon, the farm sector outlook remains positive. Transport sector indicator of commercial vehicle sales in Q1:2022-23, recorded growth year-on-year, as well as over corresponding pre-pandemic quarter (Apr-Jun 2019), even as it moderated sequentially (Chart 13e). 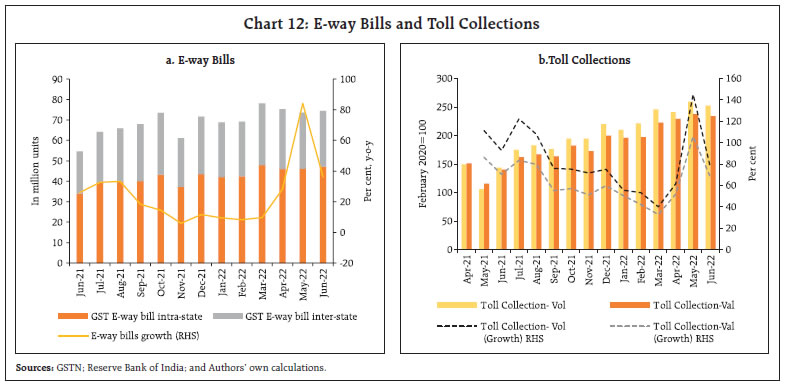
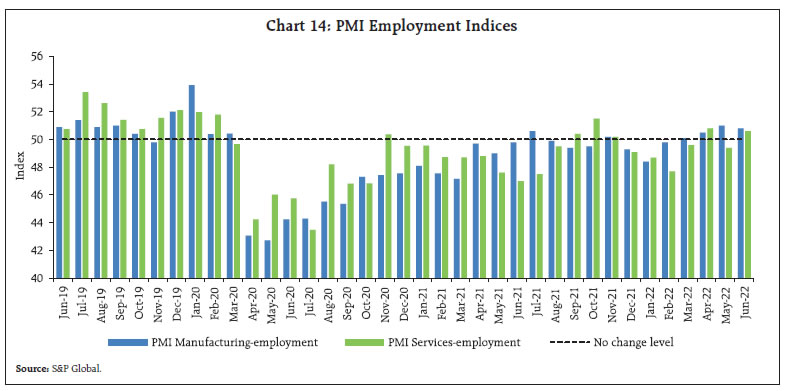 The purchasing managers’ index (PMI), which is a survey-based indicator of organised sector employment, indicated sustained improvement in employment conditions in June 2022. Although manufacturing sector employment eased marginally on a sequential basis, it remained in expansionary mode. Services sector employment turned expansionary in June 2022 after contracting in the previous month (Chart 14). Organised sector employment proxied by the Naukri Jobspeak index recorded a growth of 12 per cent year-on-year in April-June 2022, with the hospitality sector showing strong growth, followed by retail, real estate, insurance and banking. Demand for work under the Mahatma Gandhi National Rural Employment Guarantee Act (MGNREGA) eased on a y-o-y basis in June 2022, reflecting the beginning of Kharif crop sowing in rural parts of the country and the consequent increase in demand for farm labour (Chart 15). As per the household survey of the Centre for Monitoring Indian Economy (CMIE), the labour participation rate fell to 38.8 per cent in June 2022 from 39.9 per cent last month. The employment rate also moderated from 37.1 per cent in May to 35.8 per cent in June. This led to an increase in the unemployment rate from 7.1 per cent last month to 7.8 per cent in June (Chart 16). In July so far, employment conditions, however, improved as reflected in a fall in 30 day moving average unemployment numbers to 7.3 per cent as on July 15. As per the preliminary data released by the Ministry of Commerce and Industry on July 4, India’s merchandise exports at US$ 37.9 billion in June 2022 registered a robust growth of 16.8 per cent on a y-o-y basis (Chart 17). At US$ 116.7 billion, merchandise exports recorded the highest ever quarterly level during Q1:2022-23.
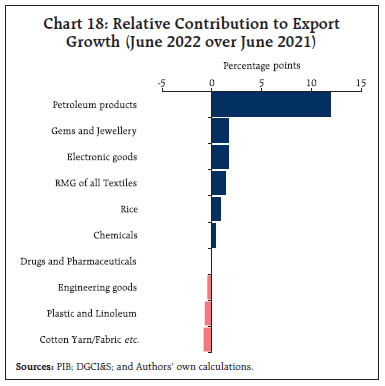
Six out of ten major commodity groups accounting for 47.6 per cent of total exports grew on a y-o-y basis in June 2022 (Chart 18). Petroleum products alone contributed 71 per cent of export growth. Exports of petroleum products to the Netherlands and Sri Lanka have increased four times during March to May 2022 over the corresponding period of the previous year (Chart 19). The Netherlands is a gateway for Indian exports to EU countries. To ensure sufficient domestic supplies of petroleum products, the Government of India imposed cesses of ₹6 per litre and ₹13 per litre on exports of petrol and diesel, respectively9. 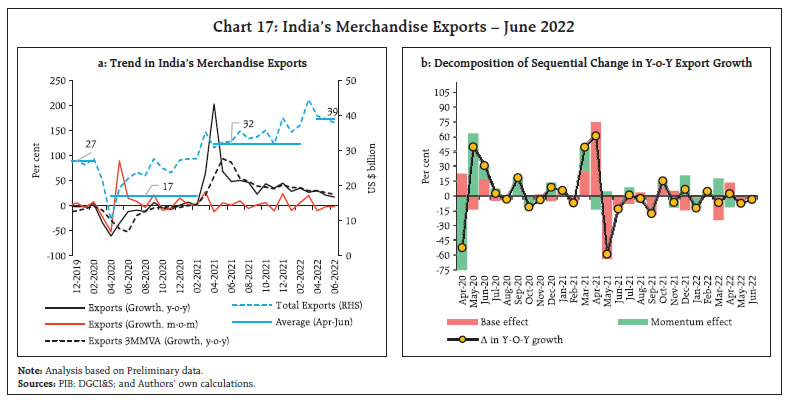
 With a share of 37.5 per cent in global rice exports, India’s exports rose to US$ 1.03 billion in June 2022. Indian rice exports benefited from a price advantage over rice varieties sold by Vietnam and Thailand, the other major exporters (Chart 20). External demand for Indian rice was also buoyed by the appetite for wheat alternatives and an import duty cut in Bangladesh10. India’s increasing defence cooperation with ASEAN countries like Vietnam, Malaysia and Philippines highlights the domestic defence export potential (Chart 21). 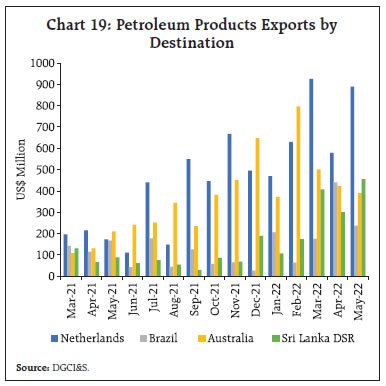
India and the EU - our second largest trading partner after the US - have recently concluded the first round of negotiations for the India-EU Trade and Investment Agreements11, which were re-launched after a 9-year pause. India runs a trade surplus with the EU, with exports at US$ 65 billion and imports at US$ 54 billion during 2021-22. India primarily exports mineral fuels, iron and steel, organic chemicals and machinery to the EU and imports machinery, pearls and precious stones, electrical equipment, aircrafts and spacecrafts and parts from the EU (Chart 22).
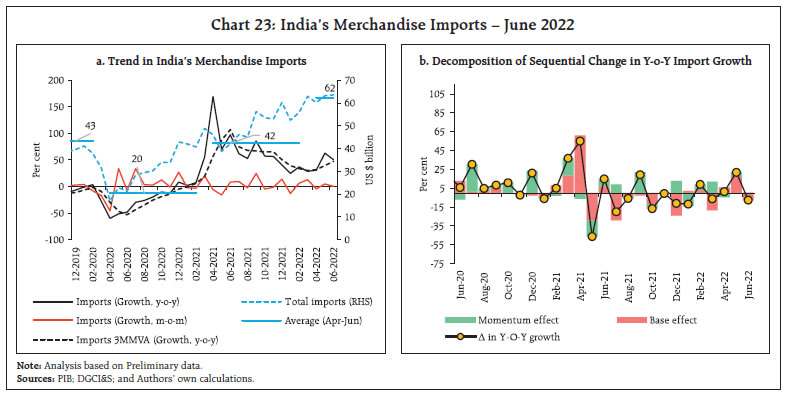
India’s merchandise imports at US$ 63.6 billion surged to their highest monthly level in June 2022, growing by 51.0 per cent on a y-o-y basis (Chart 23). Non-oil non-gold imports at US$ 40.2 billion registered robust growth in June 2022. Petroleum products and coal, coke and briquettes, accounting for 42.7 per cent of total imports, contributed 68 per cent of total import growth (Chart 24). Imports of petroleum and its products rose by 94.2 per cent in value and 20.5 per cent in volume terms in June 2022 (Chart 25). Excise duty exemption for biofuels has been expanded to encourage the blending of higher proportions of ethanol and vegetable oil with gasoline and diesel.12 A Green Hydrogen Policy has been announced to achieve the target of net-zero carbon emission by 2070. India plans to introduce a production-linked incentive (PLI) scheme to encourage manufacturing of electrolysers to extract hydrogen from water.13 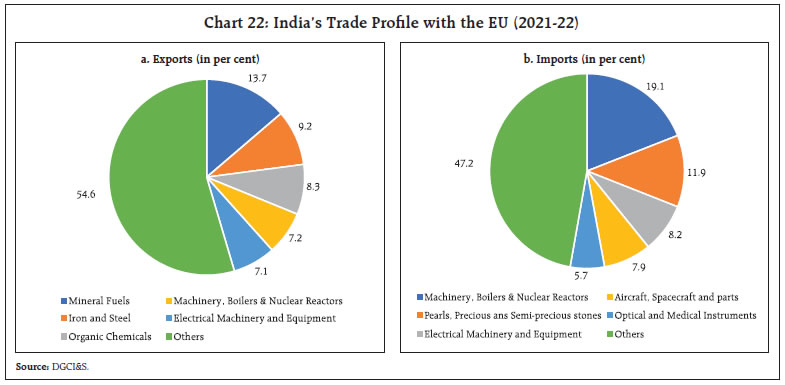
 Gold imports at US$ 2.6 billion in June 2022 were almost half the level of US$ 6.0 billion in May 2022, even though they grew by 169.4 per cent on a y-o-y basis. As international gold prices remained stable in June, the entire increase was on account of an increase in volume. According to the World Gold Council, the fall in gold demand in June marks the end of the wedding season. The Government of India has recently increased the customs duty on gold from 10.75 per cent to 15 per cent to curb the surge in gold imports.14
Imports of coal jumped by 241.8 per cent on a y-o-y basis in June 2022, rising for the fifth consecutive month (Chart 26). With the rapidly increasing demand for electricity and a shortage of domestic coal supply, the government has decided to put its import substitution plan for coal on hold till domestic production of the fuel touches the 1 billion tonne mark.15 India’s merchandise trade deficit widened to its highest monthly level of US$ 25.6 billion in June 2022 as against a deficit of US$ 9.6 billion a year ago and US$ 24.3 billion in May 2022. On a quarterly basis too, Q1:2022-23 recorded the highest ever trade deficit of US$ 70.3 billion (Chart 27). Going forward, India’s export performance is expected to improve as new export orders with Indian manufacturers recorded a third consecutive monthly increase and suppliers’ delivery times improved for the first time in 15 months16 (Chart 28). Supply disruptions are expected to ease further with vendor performance improving in China after lengthening delivery time for 24 straight months since June 202017. The easing of logistics pressures was also reflected in improved port operations and reduced container waiting time in Shanghai (Chart 29).
During April-May 2022, the Union government frontloaded capex, with the y-o-y growth in capital spending of 70.1 per cent turning out to be the highest in several years (Chart 30). Consequently, the fiscal deficit widened to 12.3 per cent of budget estimates (BE) during the period, as compared with 8.2 per cent of BE a year ago. On the receipts front, tax collections remained buoyant, driven by a growth of 60.2 per cent in direct tax revenue. Indirect tax collections reported a more modest increase of 9.0 per cent – double digit growth in goods and services tax (GST) was offset by a contraction in customs and excise duty collections (Chart 31). GST collections (Centre plus states) stood at ₹1.45 lakh crore in June 2022, the second highest since the inception of GST. This also marks the fourth consecutive month in which GST collections have surpassed ₹1.4 lakh crore (Chart 32). In Q1:2022-23, the pick-up in the year-on-year growth in GST revenues was driven by a positive momentum and a favourable base effect. 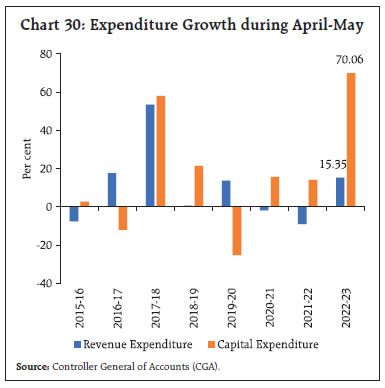 Revenue collections of the States rose by 22.2 per cent in April 2022 due to increase in tax revenues across all sub-components and higher non-tax revenues (Chart 33). While revenue expenditure increased sharply, capital outlay declined. The GST Council extended the period for the levy of the GST compensation cess up to March 31, 2026 for repaying back-to-back loans taken during the pandemic to meet the shortfall in compensation cess collection. In its 47th meeting held on June 29, 2022, the GST Council made recommendations relating to changes in GST rates and laws and procedures18 that will be made effective from July 18, 2022.
Aggregate Supply Crop sowing in the ongoing Kharif season has slowed due to the uneven distribution of the south-west monsoon across the country. As on July 8, 2022, the total sown area touched 407 lakh hectares - 9.3 per cent lower in comparison with the previous year’s level. Among major crops, all crops except coarse cereals and pulses registered negative year-on-year growth (Chart 34). The progress of the south-west monsoon has been slow and uneven during the month of June with an 8 per cent reduction in cumulative rainfall from the normal (1970-2020) as of end-June. Furthermore, June rainfall is 8 per cent lower than the historic median level (1901-2021) [Chart 35]. Adequate precipitation and an even spatial spread during July and August would be critical for crop prospects. The pickup in rainfall activity in July augurs well for the outlook. The monsoon covered the entire country as on July 2, 2022. By July 11, the cumulative seasonal rainfall reached 7 per cent above the period average (LPA). While south peninsula and central India recorded positive deviation from normal rainfall,it was negative for north west India as well as east and north east India. (Chart 36 a). 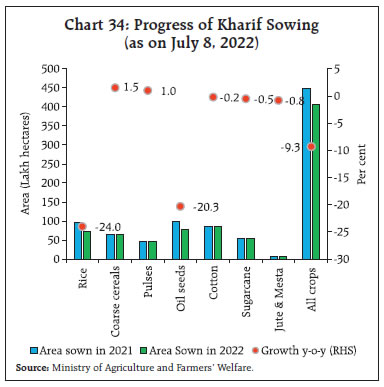 According to the Indian Meteorological Department’s (IMD) latest forecast, monthly rainfall in July is expected to be normal [94 to 106 per cent of the LPA which is 280.4 mm]. The spatial distribution is predicted to be normal and above normal for most parts of north India, central India and southern Peninsula. However, normal to below normal rainfall is forecast for east and north-east India, adjacent areas to east and central India and some parts of the southern peninsula.
The total live storage in 143 major reservoirs as on July 07, 2022 at 30 per cent of the full reservoir level (FRL) was lower than 32 per cent during the previous year, but higher than the decadal average of 25 per cent (Chart 36 b). Procurement of 187.9 lakh tonnes of wheat has been achieved so far in the Rabi marketing season 2022-23, which is 57.7 per cent of the initial target (444 lakh tonnes) and 5.1 per cent lower than the revised target (195 lakh tonnes). As on July 11, the cumulative procurement of rice at 582 lakh tonnes (Kharif marketing season 2021-22) is the same as that in the previous year. The stocks to norm ratio of rice is 3.5 times higher than the quarterly buffer norm for July-September while in the case of wheat, the stock levels are marginally higher (1.03 times). In the industrial sector, the headline manufacturing PMI remained in expansionary mode at 53.9 in June 2022 albeit moderating from 54.6 recorded a month ago. Pressures on input costs continued to dent future output, which declined to a 27-month low. PMI services, on the other hand, accelerated to 59.2 in June from 58.9 in May 2022, expanding at the fastest pace in more than 11 years. The expansion in services activity was driven by an improvement in demand (Chart 37). In the services sector, transport indicators recorded robust growth, with railways freight traffic recording growth over both pre-pandemic levels and over a year ago (11.3 per cent y-o-y) in June 2022 (Chart 38a). An increase in freight movement was recorded in respect of coal and cement, even as iron ore and pig iron declined on a high base a year ago. Cargo at major ports recorded expansion by 13.6 per cent (y-o-y) in June, attributed to increase in coking coal and thermal coal freight, and other miscellaneous cargo which together accounts for about 39 per cent of total cargo (Chart 38b). Construction sector activity continued on an uptrend in May-June 2022, with cement production and steel consumption recording sustained growth over pre-pandemic levels (Chart 39). The impact of rising input costs was muted as demand outstripped supply, reflected in capacity utilisation increasing to about 70.0 per cent for the cement industry in June 202219.
Activity in the aviation sector moderated in June 2022, with the domestic passenger segment contracting in relation to the previous month, even as international passenger traffic recorded double digit growth which has been maintained in July so far. The cargo segment fared better, recording growth over May for both domestic and international segments. In July (up to 11), activity in the domestic passenger and cargo segment contracted m-o-m reflecting the impact of the monsoon which put on hold travel plans for work and leisure (Table 1).
Inflation The provisional data released by the National Statistical Office (NSO) on July 12, 2022 showed that inflation, measured by year on year (y-o-y) changes in the all-India consumer price index (CPI), eased marginally in June (7.01 per cent) relative to its reading a month ago (Chart 40a). Over the previous month, the index increased by 52 bps but it was offset by a favourable base effect (month-on-month change in prices a year ago) of 56 bps, leading to the decline in headline inflation by 3 bps between May and June. The month-over-month (m-o-m) increase in prices of food and beverages group was of the order of 0.9 per cent, 1.0 per cent for the fuel group and only 0.1 per cent for the ‘core’ category. At the sub-group level, m-o-m price increases were significant in the case of vegetables and eggs whereas prices declined in the case of oils and fats, fruits, pulses, and transport and communication within the miscellaneous group (Chart 41). In June, there was a marginal decline in the contribution of the food group to overall CPI inflation (Chart 40b), stemming from softer price changes (y-o-y) in respect of edible oils, eggs, vegetables, pulses, sugar and prepared meals. On the other hand, inflation edged up for cereals, meat, fish, milk, fruits and spices (Chart 42). The fuel group (weight of 6.84 per cent in the CPI basket) contributed 10.0 per cent of headline inflation in June, with inflation in the category edging up from 9.5 per cent in May to 10.4 per cent in June. There was a sharp increase in kerosene and LPG prices. Electricity prices remained in deflation. Core inflation increased marginally to 6.0 per cent in June from 5.9 per cent in May, primarily under sub-groups such as pan, tobacco and intoxicants, clothing and footwear, recreation, amusement, household goods and services, education, and personal care and effects. On the other hand, inflation in respect of transport and communication recorded a sharp moderation due to a fall in petrol and diesel prices on account of the full direct impact of the cut in excise duties in May. In terms of spatial distribution, Telangana, Haryana, Sikkim and Andhra Pradesh experienced high inflation in excess of 8 per cent whereas Bihar, Tamil Nadu, Kerala and Himachal Pradesh recorded inflation in the range of 4-6 per cent (Chart 43). High frequency food prices data from the Ministry of Consumer Affairs, Food and Public Distribution (Department of Consumer Affairs) for July so far (July 1-12, 2022) indicate an increase in cereals prices, primarily driven by rice. Pulses prices, other than tur, declined marginally. Edible oil prices registered a broad-based decline in line with falling international prices. Among key vegetables, onion and potato prices have edged up, while tomato prices have plunged (Chart 44).
Retail selling prices of petrol and diesel in the four major metros remained steady in July so far (until July 12). Kerosene prices increased sharply while LPG prices edged up (Table 2). | Table 2: Petroleum Products Prices | | Item | Unit | Domestic Prices | Month-over-month
(per cent) | | July-21 | June-22 | July-22^ | June-22 | July-22 | | Petrol | ₹/litre | 102.81 | 104.18 | 104.18 | -5.4 | 0.0 | | Diesel | ₹/litre | 93.51 | 93.48 | 93.48 | -4.9 | 0.0 | | Kerosene (subsidised) | ₹/litre | 33.34 | 61.99 | 71.44 | 5.4 | 15.2 | | LPG (non-subsidised) | ₹/cylinder | 845.13 | 1013.25 | 1042.42 | 1.1 | 2.9 | ^: For the period July 1-12, 2022.
Note: Other than kerosene, prices represent the average Indian Oil Corporation Limited (IOCL) prices in four major metros (Delhi, Kolkata, Mumbai and Chennai). For kerosene, prices denote the average of the subsidised prices in Kolkata, Mumbai and Chennai.
Sources: IOCL; Petroleum Planning and Analysis Cell (PPAC); and RBI staff estimates. | Input cost pressures increased at a slower pace in June 2022 across manufacturing and services as reflected in the PMIs. Selling prices edged up across manufacturing and services, with the manufacturing sector registering price increases higher than the long-run average and those of services hitting a five-year high. IV. Financial Conditions Daily absorption under the liquidity adjustment facility (LAF) moderated, averaging ₹4.1 lakh crore during June 8 through July 14, 2022 from ₹5.3 lakh crore during May 5 to June 7, 2022 (Chart 45). Of the total surplus liquidity, nearly ₹2.1 lakh crore was absorbed under the standing deposit facility (SDF) while the remaining was mopped up through variable rate reverse repo (VRRR) auctions (both main and fine-tuning) at an effective absorption rate of 4.74 per cent. Reflecting these liquidity conditions, overnight money market rates firmed up above the SDF rate towards the end of June, although on an average basis, the weighted average call rate (WACR) traded 2 bps below the SDF rate during the month and in the collateralised segment, the tri-party rate and the market repo rate generally traded above the SDF rate since the second half of June. 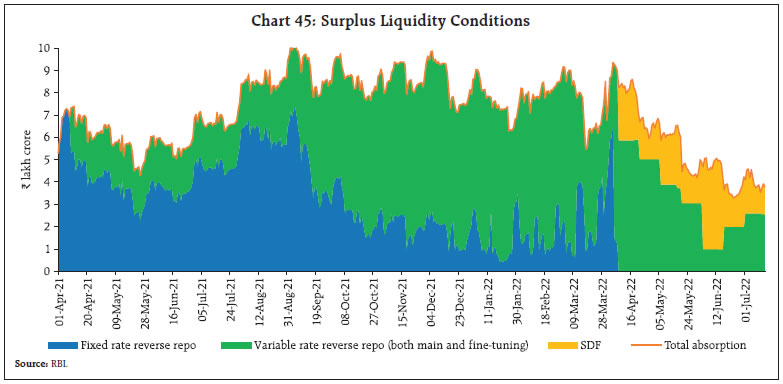
 In the term money market segment, yields on 3-month certificates of deposit (CDs) and 3-month commercial paper (CPs) increased, with their spreads above the marginal standing facility (MSF) rate averaging 15 bps and 50 bps, respectively, during June 8 through July 14, 2022 (Chart 26). At the same time, the yield on 3-month T-bill firmed up by end-June to reach closer to the ceiling of the LAF corridor. Narrowing liquidity surplus amidst strong credit growth prompted banks to raise funds through CD issuances from the primary market. Outstanding CD issuances amounted to ₹2.2 lakh crore as on July 1, 2022 compared with ₹0.7 lakh crore a year ago. In the fixed income market, bond yields largely softened during June 8 through July 14, 2022 with the yield on the 10-year G-sec easing from its peak of 7.62 per cent to close at 7.38 per cent on July 14. The rise in US treasury yields and inflation apprehensions ahead of the release of the CPI inflation print kept market sentiments on edge in early June. Recession concerns in the US amidst aggressive US Fed tightening, however, pushed down US treasury yields with a concomitant impact on domestic yields in India. While declining crude oil prices and benign CPI inflation print on domestic front aided softening of yields, some of the gains were wiped after US CPI inflation came in higher than market expections. Across the yield curve, the decline at the long end was more pronounced than in the mid segment and the short end of the curve (Chart 47a). The spread between 2-year G-sec and 3-month T-bill yields moderated, reflecting the impact of monetary tightening, resulting in a decline in curvature21 (the yield curve becoming less hump-shaped) (Chart 47b). While the upward shift in the level of the yield curve is consistent with a declining slope (as measured by the 10-year and 2-year spread) since April, a perceptible decline in curvature is evident since the May policy meeting, indicating the impact of monetary tightening across various maturity segments. Overall, the yield curve is indicating an improvement in long-term growth prospects, an upshift in ex ante inflation expectations and tighter monetary policy in the period ahead (Patra et.al, 2022).22 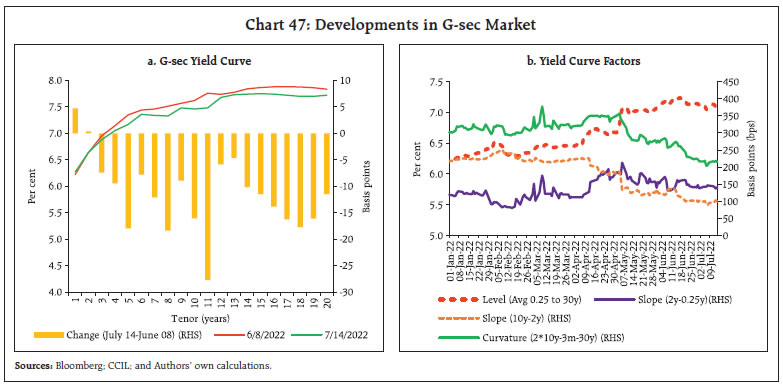 Corporate bond yields softened in tandem with the G-sec yields across tenors and the rating spectrum (Table 3). Credit risk premium as reflected in the spread of corporate bond yields over G-sec yields of equivalent maturities also declined marginally during the same period. Consequently, corporates were deterred from raising funds in the bond market, with primary market issuances during 2022-23 so far (up to May 2022) remaining tepid at ₹0.33 lakh crore. In view of the ongoing geopolitical tensions triggering safe haven demand for the US dollar and causing persistent depreciation of the INR, the Reserve Bank announced the following measures on July 6, 2022 to enhance forex inflows while ensuring overall macroeconomic and financial stability: (i) exemptions of incremental FCNR(B) and NRE deposits accruing between July 1, 2022 till November 4, 2022 from the maintenance of cash reserve ratio (CRR) and statutory liquidity ratio (SLR) effective fortnight beginning July 30, 2022;23 and (ii) permitting banks temporarily (up to October 31, 2022) to raise fresh FCNR(B) and NRE deposits without reference to the extant regulations on interest rates effective July 7, 2022. Following the relaxations, few major banks have increased the interest rates on FCNR(B) deposits. | Table 3: Financial Markets - Rates and Spread | | Instrument | Interest Rates
(per cent) | Spread (bps)
(over corresponding risk-free rate) | | Jun-22 | July 2022
(Up to July 13) | Variation
(in bps) | Jun-22 | July 2022
(Up to July 13) | Variation
(in bps) | | 1 | 2 | 3 | (4 = 3-2) | 5 | 6 | (7 = 6-5) | | Corporate Bonds | | | | | | | | (i) AAA (1-yr) | 6.67 | 6.41 | -26 | 35 | 35 | 0 | | (ii) AAA (3-yr) | 7.55 | 7.41 | -14 | 45 | 40 | -5 | | (iii) AAA (5-yr) | 7.64 | 7.42 | -22 | 22 | 14 | -8 | | (iv) AA (3-yr) | 8.26 | 8.13 | -13 | 116 | 112 | -4 | | (v) BBB-minus (3-yr) | 11.94 | 11.81 | -13 | 484 | 480 | -4 | | 10-yr G-sec | 7.49 | 7.34 | -15 | | | | Note: Yields and spreads are computed as monthly averages.
Source: FIMMDA; and Bloomberg. |
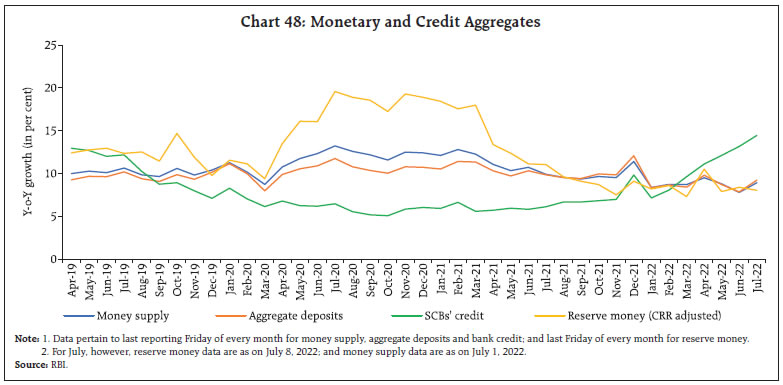 Reserve money (RM), excluding the first-round impact of the cash reserve ratio (CRR)24, grew by 8.0 per cent on a y-o-y basis as on July 8, 2022 (10.8 per cent a year ago) [Chart 48]. Growth in currency in circulation (CiC), the largest component of RM, declined to 8.0 per cent from 11.5 per cent a year ago. Money supply (M3), the liabilities of the banking sector, registered a growth of 8.9 per cent as on July 1, 2022 (10.1 per cent a year ago), primarily driven by its largest component – aggregate deposits with banks. The recent pick-up in scheduled commercial banks’ (SCBs’) credit gained further traction in the recent period and recorded a three-year high of 14.4 per cent y-o-y as on July 1, 2022 (6.1 per cent a year ago). Banks increased their external benchmark lending rates (EBLRs) by 50 bps in June. Twenty-eight domestic banks (including ten public sector banks and eighteen private banks) have also increased their 1-year marginal cost of funds-based lending rates (MCLRs) in the range of 5-50 bps during June. In the case of term deposits, twenty-five out of thirty-three domestic banks increased their term deposit rates in the range of 3-38 bps (Chart 49 and Table 4). The weighted average lending rate (WALR) on fresh rupee loans and outstanding loans of SCBs increased by 35 bps and 7 bps, respectively, during May 2022. Across bank groups, the WALR (fresh loans) for public and private sector banks increased by 37 bps and 26 bps, respectively. 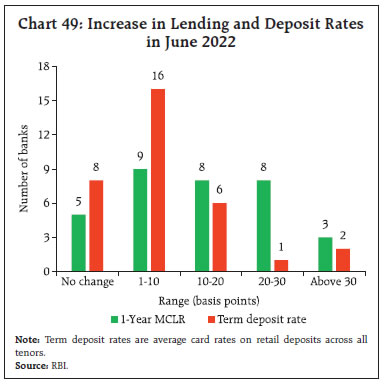
| Table 4: Transmission from the Repo Rate to Banks’ Deposit and Lending Rates | | Period | Repo Rate (bps) | Term Deposit Rates (bps) | Lending Rates (bps) | | Median TDR - Fresh Deposits | WADTDR - Out-standing Deposits | 1-Year Median MCLR | WALR - Out-standing Rupee Loans | WALR - Fresh Rupee Loans | | Oct 2019 – March 2022 | -140 | -180 | -180 | -128 | -150 | -189 | | April 2022 | 0 | 0 | 0 | 0 | -2 | -12 | | May 2022 | 40 | 0 | 4 | 3 | 7 | 35 | | | | (0 to 60) | | (0 to 35) | | | | June 2022 | 50 | 3 | - | 20 | - | - | | | | (0 to 38) | | (0 to 50) | | | Note: Figures in parentheses indicate range of bank-wise variation for 33 domestic banks.
WALR: Weighted Average Lending Rate;
WADTDR: Weighted Average Domestic Term Deposit Rate.
TDR: Term Deposit Rate; MCLR: Marginal Cost of Funds-based Lending Rate.
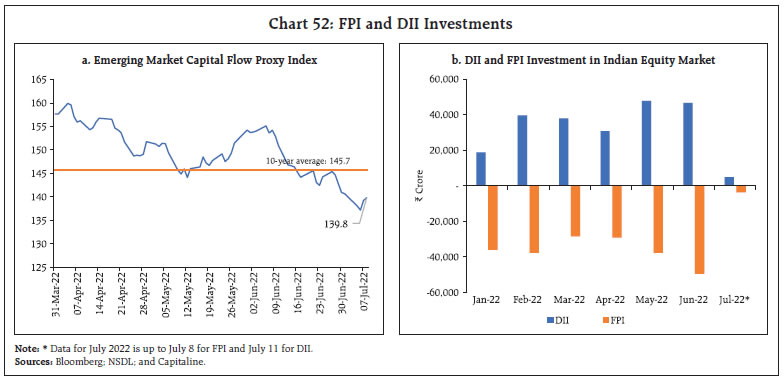
Sources: RBI; and Authors’ own calculations. | While banks have been quick to increase their lending rates, transmission to deposit rates has been relatively slow. Deposit rates are dependent on demand for credit as well as liquidity conditions in the banking system.25 As the pickup in credit demand gathers momentum, banks may be forced to raise deposits at higher rates to meet this additional demand. The incremental credit to deposit ratio, which rose from 77.2 per cent in end-March to 246.8 per cent as on June 17, 2022 could incentivise banks to increase deposit rates faster in the coming months. With the increase in G-Sec yields of various maturities in recent months, the interest rates on few small savings schemes (SSSs) fell below the formula-based rates26 which were left unchanged following a review on June 30, 2022. Indian equity markets weakened in the first half of June 2022 owing to growing fears of recession, which triggered sell-offs across the globe on investors’ risk aversion. Furthermore, weak global cues following the announcement of a 75 bps hike in the policy rate by the US Fed also dampened market spirits. The domestic equity market rebounded, however, in the second half of June and extended the gains in July amidst softening commodity prices and positive cues emanating from gains in global equity markets. In line with global market peers, the benchmark index (Sensex) declined by 2.1 per cent from end-May 2022 to close at 54,395 on July 11, 2022 (Chart 50a). Nevertheless, Indian equities accounted for 3.2 per cent of the total world market capitalisation, substantially higher than the long-term average (July 2012 to July 2022) of 2.46 per cent (Chart 50b). At this level, India is the fifth largest contributor to world market capitalisation following the US, China, Japan and Hong Kong. Amidst the correction, equity market valuations declined in June to their lowest level since May 2020. The Sensex is trading at a trailing price/earnings ratio (P/E) of 22.0 (as on July 11, 2022), down from 23.7 at end-March 2022, and the ten-year average P/E multiple of 22.5 (Chart 51a). While the index has become inexpensive compared with its valuation in recent years, it remains expensive when compared with emerging market peers (Chart 51b). 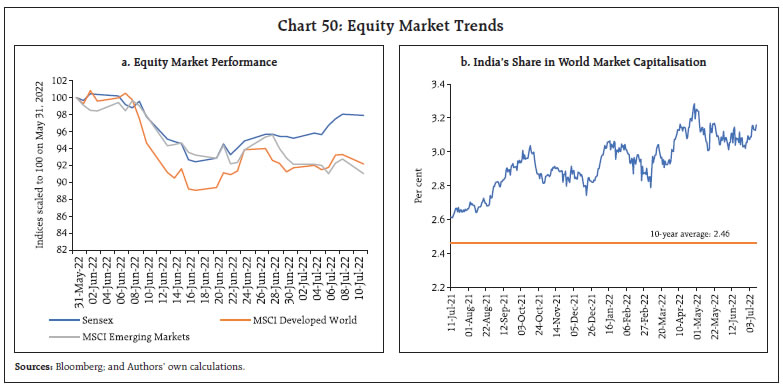 Amidst monetary tightening, global investors are shunning emerging market assets as captured by the Bloomberg emerging market capital flow proxy index.27 The index stood at 139.8 on July 08, 2022, which is below its 10-year average of 145.7 (Chart 52a). In consonance, foreign portfolio investors (FPIs) were net sellers in the Indian equity market for the ninth consecutive month in June, with an outflow of ₹49,469 crore (highest monthly outflow since March 2020) and the sell-off continued in July (up to July 8, 2022) to the tune of ₹3,716 crore. Overall, FPIs have withdrawn ₹1.2 lakh crore from the Indian equity market in 2022-23 so far, but the sell-off has been absorbed by domestic institutional investors (DIIs) (Chart 52b). DIIs have invested in equity markets for the 16th consecutive month in June 2022, with a net inflow of ₹1.3 lakh crore in 2022-23 so far (up to July 11, 2022) as against ₹21,024 crore in the corresponding period last year. Mutual fund equity/growth-oriented schemes have recorded net monthly inflows since March 2021, highlighting the positive sentiment among domestic investors. Equity schemes attracted net inflows of ₹48,797 crore in 2022-23 so far (up to June 2022) as against ₹15,627 crore in the corresponding period last year. Furthermore, systematic investment plans (SIPs) recorded an inflow of ₹12,276 crore in June marking the 10th consecutive month of SIP inflows being greater than ₹10,000 crore. 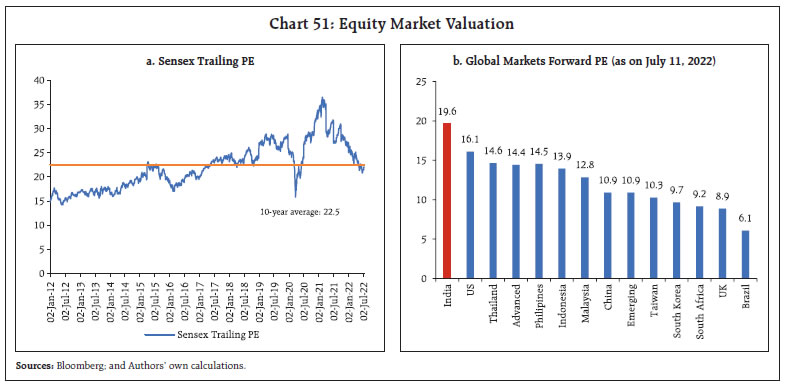
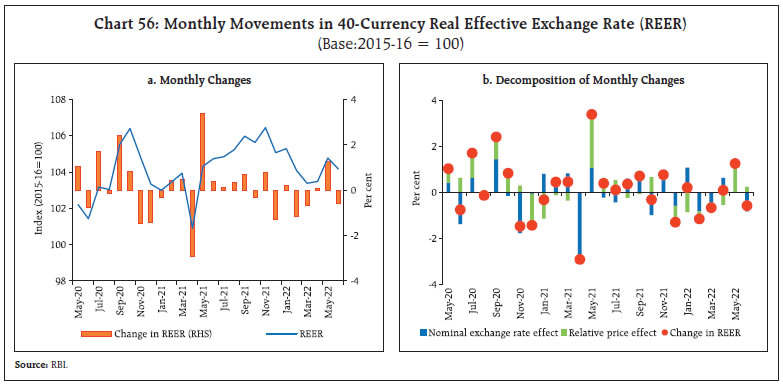
 FPIs have also reduced their presence in the Indian debt market over time. As on July 11, 2022, FPIs had utilised only 22.9 per cent of their investment limit in the central government securities, as against 61 per cent at end-March 2019 (Chart 53a). Furthermore, utilisation of FPIs’ limit in the corporate bond segment also declined to 17.7 per cent as on July 11, 2022 as compared with 75.9 per cent at the end-March 2019 (Chart 53b). To encourage foreign portfolio investment in the debt segment, the Reserve Bank announced relaxation on FPI investment norms on July 06, 2022. They included: (i) expanding the investable space for non-resident investors under the fully automatic route (FAR) route to new issuances of G-Secs of 7-year and 14-year tenors; (ii) exemption on the short-term limit on investments by FPIs in government securities and corporate debt till October 31, 2022; (iii) providing a window till October 31, 2022 for FPIs to invest in corporate money market, viz., commercial paper (CP) and non-convertible debentures (NCDs) with an original maturity of up to one year. These measures are expected to enhance foreign currency inflows while ensuring overall macroeconomic and financial stability. 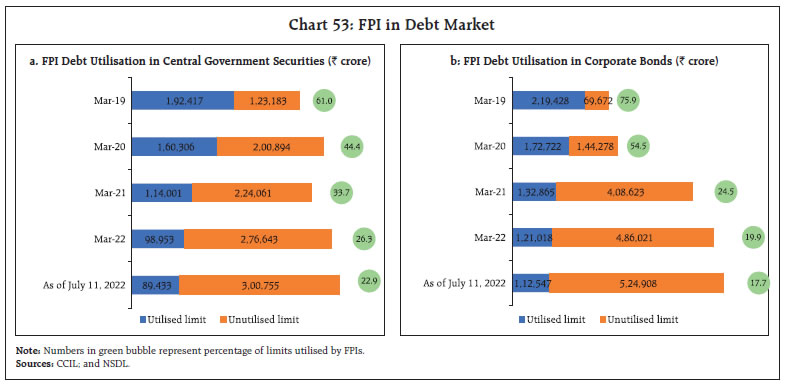 During April-May 2022, gross inward foreign direct investment (FDI) marginally decreased to US$ 16.4 billion and repatriation of FDI increased to US$ 5.0 billion from their levels a year ago (Chart 54). Manufacturing, retail and wholesale trade, computer services, communication services and financial services received most of the investment and accounted for 76.7 per cent of the fresh equity flows. Gross disbursements of external commercial borrowings (ECBs) to India were to the tune of US$ 2.4 billion during April-May 2022 as compared with US$ 3.0 billion a year ago, while on a net basis (i.e., excluding repayments and inter-company borrowings), ECBs recorded net outflows of US$ 1.6 billion as against net disbursement of US$ 0.1 billion a year ago. In May 2022, a considerable amount of borrowing was routed to new projects, on-lending/sub-lending, and working capital. The foreign exchange reserves at US$ 580.3 billion on July 8, 2022 were equivalent to 9.5 months of imports projected for 2022-23 (Chart 55). In the foreign exchange market, the Indian rupee (INR) depreciated by 1.0 per cent vis-à-vis the US dollar (m-o-m) in June 2022 on the back of FPI equity outflows and strong US dollar. This was also mirrored in the movement of the 40-currency real effective exchange rate (REER) which depreciated by 0.6 per cent in June 2022 over its level a month ago (Chart 56).
The current account deficit (CAD) narrowed to 1.5 per cent of GDP in Q4:2021-22 from 2.6 per cent in the previous quarter, mainly on account of a decrease in the trade deficit and net investment income outgoes (Table 5). Resilient services exports and remittances receipts eased merchandise import pressures on the current account in Q4:2021-22. Notwithstanding strong FDI inflows in Q4:2021-22, there was net portfolio capital outflows by FPIs. Overall, these factors led to a drawdown of reserves in the quarter. | Table 5: Balance of Payments Indicators | | (As per cent of GDP, unless indicated otherwise) | | Indicator | Q4: 2020-21 | Q4: 2021-22 | 2020-21 | 2021-22 | | (i) Current Account Balance (+Surplus/- Deficit) | -1.0 | -1.5 | 0.9 | -1.2 | | (ii) Exports | 11.6 | 13.4 | 11.1 | 13.5 | | (iii) Imports | 16.8 | 19.6 | 14.9 | 19.5 | | (iv) Trade Balance | -5.3 | -6.2 | -3.8 | -6.0 | | (v) Remittances Receipts (US$ billion) | 20.9 | 23.7 | 80.2 | 89.1 | | (vi) Remittances Receipts | 2.6 | 2.7 | 3.0 | 2.8 | | (vi) Net Terms of Trade (Index)# | 102.3 | 99.3 | 104.3 | 100.6 | | (vii) Net Capital Flows | 1.6 | -0.2 | 2.4 | 2.7 | | of which: | | | | | | FDI | 0.3 | 1.6 | 1.6 | 1.2 | | FPI | 0.9 | -1.7 | 1.4 | -0.5 | | Other Investments | 0.3 | 0.0 | -0.6 | 2.0 | | (viii) Reserve change, (-) increase/ (+) decrease | -0.4 | 1.8 | -3.3 | -1.5 | Note: # An increase in net terms of trade index implies favourable export prices relative to imports.
Sources: RBI and IMF. |
| Table 6: Key External Vulnerability Indicators (end-March) | | (Per cent, unless indicated otherwise) | | Indicator | 2021 | 2022 | | 1. External Debt (US$ billion) | 573.7 | 620.7 | | 2. External Debt to GDP Ratio (%) | 21.2 | 19.9 | | 3. Short-term Debt (RM) to Total Debt Ratio | 44.1 | 43.1 | | 4. Reserves to Total Debt Ratio (%) | 100.6 | 97.8 | | 5. Short-term Debt (RM) Ratio to Reserves (%) | 17.5 | 20.0 | | 6. Reserve Cover of Imports (in months) ^ | 17.4 | 11.8 | | 7. Net International Investment Position (US$ billion) # | -355.2 | -359.8 | | 8. Net IIP to GDP ratio (%) # | -13.3 | -11.3 | RM: Residual maturity; IIP: International investment position;
#: Negative sign indicates non-residents’ net claims on India; and
^: Based on actual imports (BOP basis).
Source: RBI. | India’s net international investment position (IIP) worsened by US$ 4.7 billion during 2021-22 (i.e., increase in non-residents’ claims on India), but the net IIP to GDP ratio improved to 11.3 per cent in the year (Table 6). On a similar note, external debt as on end-March 2022 remained modest, recording a decline as a ratio of GDP vis-à-vis end-March 2021. Payment Systems In June 2022 and July 2022 (up to July 10), there was sustained momentum (y-o-y) in the volume and value of payments through all digital platforms (Table 7). The disbursal of Pradhan Mantri Kisan Samman Nidhi (PM-KISAN) payments28 spurred acceleration in transaction value through the National Automated Clearing House (NACH) and the Aadhaar enabled Payment System (AePS). The World Bank’s Global Findex 2021 survey29 provides evidence that government payments were pivotal in opening of new accounts. In India, 38 per cent of adults opened their first ever accounts with financial institutions to receive government payments, while the corresponding figure for developing countries stood at 18 per cent. Furthermore, more than 80 million adults in India made their first digital merchant payment during the pandemic. The cumulative number of digital (QR-code based) payment acceptance devices deployed under the Payments Infrastructure Development Fund (PIDF)30 scheme more than doubled by end-April 2022 from end-September 2021 (Table 8), while the corpus increased by 32 per cent to ₹811.4 crore.
| Table 8: Progress under the PIDF Scheme | | Location | end-September 2021 | end-April 2022 | | Physical Devices* | Digital Devices** | Physical Devices* | Digital Devices** | | Tier 3 and 4 Centres | 98,504 | 20,46,075 | 1,65,356 | 42,93,988 | | Tier 5 and 6 Centres | 84,968 | 30,47,750 | 1,40,421 | 61,01,464 | | North Eastern States | 18,449 | 2,42,145 | 30,994 | 4,96,271 | | Tier 1 and 2 Centres | 44,021 | 2,00,708 | 74,721 | 5,13,393 | | Total | 2,45,942 | 55,36,678 | 4,11,492 | 1,14,05,116 | *Physical devices include point of sale (PoS), mobile PoS (mPoS), General Packet Radio Service (GPRS), Public Switched Telephone Network (PSTN), etc.
**Digital devices include inter-operable quick response (QR) code-based payments such as UPI QR, Bharat QR, etc.
Source: RBI. | On the start-up front, there is early evidence of moderation in investor enthusiasm after a bumper 2021-22 in terms of fundraising (Chart 57). The Reserve Bank recently released the Payments Vision 202531, with “E-payments for Everyone, Everywhere, Everytime” as its core theme. Targeting secure growth of digital finance, the Reserve Bank will soon issue suitable guidelines and measures to make the digital lending ecosystem safe and sound while enhancing customer protection and encouraging innovation.32 The Reserve Bank has also set up a Committee for Review of Customer Service Standards pertaining to Regulated Entities (REs) to inter alia review the evolving needs of the customer service landscape, especially in the context of evolving digital financial products and their distribution, and to suggest measures for strengthening the overall consumer protection framework. V. Conclusion Short-term global economic prospects are transfixed in the cross hairs of synchronized monetary tightening and the war in Europe. The outlook is shrouded in high uncertainty. A sliver of hope has become visible in the recent moderation in global commodity prices, and especially food prices. This suggests that unjust inflation may be peaking, providing a breather for beleaguered nations across the world but is it presaging inexpedient recession? In 1923, John Maynard Keynes wrote: “Of the two, perhaps deflation is the worse; because it is worse to provoke unemployment than to disappoint the rentier”33. The Indian economy remains resilient in the face of formidable global headwinds. Knock-on effects of geopolitical spillovers are visible in several sectors, tapering the pace of recovery. In spite of this overwhelming shock, there are sparks in the wind that ignite the innate strength of the economy and set it on course to becoming the fastest growing economy in the world, though besieged it might be by fears of recession. The recent revival of the southwest monsoon and rejuvenation of sowing activity has raised hopes of another bountiful year for agricultural activity, raising expectations that rural demand will soon catch up with urban spending and consolidate the recovery. The biggest source of relief is from inflation coming off its recent peak, albeit at an elevated level still. Nonetheless, the signs of its generalization and the potential unhinging of inflation expectations have elicited a pre-emptive and frontloaded monetary policy response. Amidst all these developments, India’s financial sector remains sound and stable. If the commodity price moderation witnessed in recent weeks endures alongside the easing of supply chain pressures, the worst of the recent surge in inflation will be left behind, enabling the Indian economy to escape the global inflation trap and enjoy the fruits of the ebullient supply response that is taking place. The international environment is hostile and hence, close and continuous monitoring of the widening trade deficit and portfolio outflows is warranted, notwithstanding strong reserve buffers, moderating external debt and a fairly valued exchange rate that has wilted less in the face the monotonic strengthening of the US dollar than many peers.
|