The near-term outlook for private investment activity in India is gauged from project investment proposals of the private corporate sector. With the resumption of business activities and improving demand conditions after the ebbing of the Covid-19 pandemic, announcement of new projects increased significantly during 2021-22, especially infrastructure projects. Of the total capex investment envisaged during 2021-22, more than one third is expected to be spent in 2022-23. Introduction Capital expenditure (capex) of the private corporate sector plays a significant role in driving the overall investment climate in the economy. An assessment of the private investment outlook, therefore, is vital to gauge the prospects of growth. Given the lag in publication of annual accounts of corporate sector, balance sheet-based investment rate may not be useful in assessing the short-term investment outlook. As an alternative, survey-based methods are popularly used by major economies to gather information on envisaged corporate investment plans and investment sentiment. The results of such surveys pave the way for assessment of both current investment climate and investment intentions that are likely to materialise in the short to medium term. In India too, such surveys are being conducted since the late 1980s for the assessment and forecasting/nowcasting of private investment. The capex plans of the private corporate sector through the projects that are funded by banks and financial institutions has been used for providing an outlook on investment based on the methodology adopted by Rangarajan (1970)1 on time phasing of capex. Such articles were published initially in the Economic and Political Weekly and subsequently in the RBI Bulletin since 1989. The article is organised under five sections. Section II sets out the methodology and its limitations. Characteristics of projects sanctioned or contracted during the period of review, funding thereof, and distributional aspects in terms of regions and industries are presented in Section III. Section IV deals with the phasing profile of the sanctioned/contracted loans/financing and estimates growth of corporate investment. Section V concludes the study. II. Methodology and Limitations This article follows Rangarajan (1970) for assessing near-term outlook of investment activity of private corporate. For this purpose, data on investment intentions were gathered through three different sources, viz., (i) banks and financial institutions (FIs)2 which are involved in the business of project finance to private corporate, (ii) finances raised for capex purpose through the external commercial borrowings (ECBs), including issuance of foreign currency convertible bonds (FCCBs), rupee denominated bonds (RDBs), and (iii) initial public offerings (IPOs), follow-on public offerings (FPOs) and rights issues during a year. In order to avoid double counting and consequent overestimation of capital investment, due care has been taken to ensure that each capex project enters the information set only once, even if it is financed through multiple sources, by using databases internal to the RBI as well as information provided by the Securities and Exchange Board of India (SEBI). This study covers only those projects that are financed through any of the sources mentioned above, with project cost above ₹10 crore and private ownership above 51 per cent. Projects undertaken by Central and State governments, trusts and educational institutions are not covered in this study. The estimates are obtained based on the assumption that companies adhere to their ex-ante capital expenditure plans. These estimates may, however, digress from the ex-post estimates of corporate fixed investment available in the National Accounts Statistics (NAS). This is in view of the possibility that some ex-ante intentions may not fructify into realised investment in terms of their amount and timing of investment and some projects may be self-financed. III. Characteristics of Projects Sanctioned/Contracted The investment climate in terms of number of new project announcements remained weak during 2019-20 and deteriorated further in 2020-21 due to COVID-19 pandemic. Subsequently, with resumption of business activities and improved demand sentiments, the new capex project announcements showed some signs of revival. During 2021-22, 28 banks and FIs which were actively involved in project finance, reported 403 projects, significantly higher than 220 projects reported during 2020-21 as well as 320 projects reported during 2019-20, mainly due to increase in small ticket projects. Though envisaged total project cost of ₹1,43,314 crore almost doubled as compared to the record low of ₹75,558 crore in 2020-21 on the back of Covid-19 induced lockdown and related restrictions, it remained lower than the pre-Covid levels (Annex: Table A1). A total of 361 companies, which did not avail of any financing from the banks/FIs for capex projects, raised an amount of ₹47,824 crore through ECBs/FCCBs/RDBs and 27 other companies raised ₹3,410 crore for their capex needs through domestic equity issues under the IPO route. Overall, investment plans of 791 projects were made during 2021-22 aggregating to ₹1,94,548 crore as against 576 projects in 2020-21 with investment intentions of ₹1,16,603 crore, which remained comparatively lower than the levels seen since 2016-17 (Annex: Table A1-A4). (i) Size-wise The number and share of mega projects (₹5,000 crore & above) in the total project cost recorded a noticeable decrease during 2020-21 and 2021-22. The large projects (project cost: ₹1,000 crore - ₹5,000 crore) contributed a significantly higher share (47 per cent) in project cost sanctioned during 2021-22. Though the number of large projects increased to 36 during 2021-22 from 24 projects during previous year, their share in total cost of projects moderated during 2021-22 (Annex: Table A5). (ii) Purpose-wise Investments in greenfield (new) projects accounted for a predominant share (89 per cent) in the total project cost sanctioned by banks and FIs during 2021-22, comparable with the trend seen in the past. In terms of number of projects, greenfield projects increased significantly during 2021-22 as compared to previous year, even higher than the green field projects announced during 2019-20. 11 per cent of total project cost was directed towards expansion and modernisation of existing projects (Annex: Table A6). (iii) Industry-wise The total project cost increased in 2021-22 from 2020-21 across the board with many industries registering significant rise. For instance, the total cost of infrastructure projects increased from ₹56,103 crore to ₹81,221 crore during this period. In non-infrastructure sector, industries like construction, textile, electrical equipments & electronics and metal & metal products, recorded significant rise in the total cost of projects envisaged in 2021-22 (Annex: Table A7). 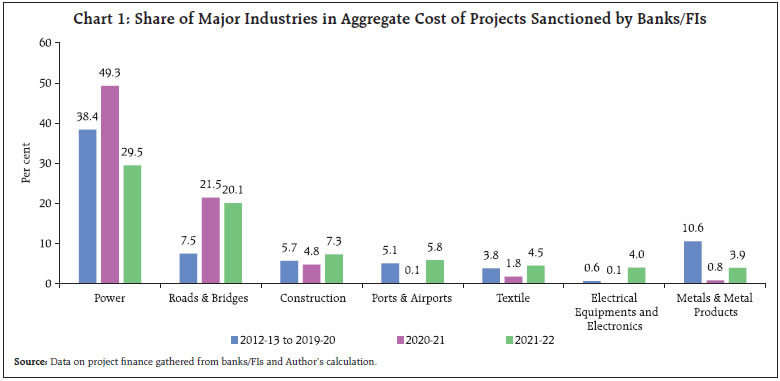 The infrastructure sector, comprising (i) power, (ii) telecom, (iii) ports and airports, (iv) storage and water management, (v) SEZ, industrial, biotech and IT park, and (vi) roads and bridges, remained the major sector accounting for more than half of the total project cost during 2021-22. However, its share in total project cost has declined from 74.3 per cent in 2020-21 to 56.7 per cent in 2021-22, despite increase in number of projects during the same period. The decline in share of infrastructure projects was mainly driven by declining share of power sector, even though it retained its top position in the project sanctioned by banks/FIs. Also, share of investment in ‘Road & Bridges’ improved significantly in the recent years as compared to 2012-13 to 2019-20. In contrast, the share of investment in ‘Metal & metal products’ remained significantly lower than its share during 2012-13 to 2019-20 though it improved in 2021-22 as compared to previous year (Chart 1). Within the power sector, project announcements in solar and wind power projects remained dominant during 2021-22, reflecting various policy initiatives by the government to promote the use of renewable energy resources (Box 1). Box 1: Emphasis on Renewable Energy Recognising the impact of climate change on environment and overall economy, majority of the countries across the world are putting their efforts to shift from conventional energy sources to non-conventional or renewable energy sources. Many countries, both developed and developing, have started taking steps to rapidly increase the share of renewable energy in the overall energy mix. During annual Conference of Parties (COP)-21 in Paris, India too committed that it will achieve 40 per cent of its installed power generation capacity from non-fossil fuel sources by 2030. Further, in COP-26 at Glasgow, UK, Hon’ble Prime Minister of India announced five ambitions which include (i) India’s non-fossil energy capacity to reach 500 GW by 2030 and, (ii) India will meet 50 per cent of its energy requirements with renewable energy by 2030. To meet these objectives, Government of India took various policy initiatives to promote the renewable energy sector and to reduce carbon emission. These include, inter alia, provision of renewable repurchase obligation (RPO) under the National Tariff Policy, development of solar parks and ultra-mega solar power projects, production link incentive (PLI) schemes for advance chemistry cell battery storage and solar panels, development of power transmission network through green energy corridor project, making solar roof tops mandatory as a part of housing loan provided by banks, waiver of inter-state transmission charges and losses, supporting research and development on various aspects of renewable energy, permitting 100 percent foreign direct investment in the sector through the automatic route3. As per the Annual Report 2021-22 of the Ministry of Power, Government of India, India has achieved the target of generating 40% of installed power generation capacity from non-fossil fuel sources in November 2021 - the first country to have achieved its NDC, nine years in advance of committed time line. As per the Central Electricity Authority (CEA), as on March 2022, installed capacity of renewable energy (including nuclear-based) is around 163 GW, constituting 41 percent of the total installed capacity. Progress in Renewable Energy Sector Total installed capacity increased significantly over the period since 2014, from 75.5 GW as on March 2014 to 156.6 GW as on March 2022. Despite pandemic led supply disruption, which was further aggravated by Russia-Ukraine war and increase in prices of wind and solar energy components, India was able to add about 15 GW capacity during 2021-22, leading to 11.4 per cent increase in total install capacity as on end-March 2022 over March 2021. As per the ‘Renewables 2022 Global Status Report’ of REN214, in cumulative renewable energy capacity at end-December 2021, India ranked fourth after China, United State and Brazil. Also, India ranked third in the world in terms of new capacity addition. The share of installed solar capacity in total installed capacity increased substantially from 3.5 per cent in March 2014 to 28.5 per cent in March 2021 and further to 34.5 per cent in March 2022. On an average, large hydro power plants and wind power accounted for about 41 per cent and 29 per cent share in total installed capacity of renewable energy during 2014-2022 (Chart 2). Among the states, as on April 2022, Rajasthan secured top position with a share of 15.7 per cent in total installed capacity. Of the total installed capacity, the top 5 states, viz., Rajasthan, Gujarat, Tamil Nadu, Karnataka and Maharashtra together accounted for around 70 per cent share.
Investment in Renewable Energy Sector During April 2000 to March 2022, non-conventional energy sector received FDI equity inflows to the tune of ₹75,000 crore, which accounts for around 2 per cent of total FDI inflows in India. FDI equity inflows in non-conventional energy sector increased substantially in recent years. In 2021-22, the sector grabbed an all-time high FDI equity inflows of ₹11,905 crore (Chart 3). Despite notable progress in renewable energy sector, majority of the energy demand is still fulfilled through fossil-fuel sources. Materialisation of investment intentions in this sector, as announced by top companies in their latest annual investors meet, along with various policy initiatives taken by the government could possibly translate into substantial investment in renewable sector going forward. | (iv) State-wise State-wise data reveals that during 2021-22, more than half (56.4 per cent) of the projects were taken up in five states, viz., Rajasthan, Uttar Pradesh, Gujarat, Maharashtra and Tamil Nadu. The share of these five states increased significantly from an average share of 40.7 per cent during 2012-13 to 2019-20 to more than 50.0 per cent during the last two years. (Chart 4 and Annex: Table A8). In 2021-22, Rajasthan accounted for the highest share in the total cost of projects sanctioned by banks/FIs, retaining the top place for two consecutive years. While the share of Rajasthan, Uttar Pradesh and Gujarat declined during 2021-22, Maharashtra, Tamil Nadu and Karnataka improved their share in the total cost of projects (Chart 4 and Annex: Table A8). IV. Phasing Profile of Investment Intentions The information on the phasing profile of envisaged capex from the cohort of projects sanctioned during different years helps in generating short-term (one year ahead) forecasts of capex. The phasing from the cohort of projects sanctioned by the banks/FIs in 2021-22 indicates that about 41.8 per cent (₹59,897 crore) of the total proposed expenditure was expected to be spent in the same year, while 30.9 per cent (₹44,282 crore) is likely to be spent in 2022-23 and another 17.6 per cent (₹25,267 crore) in the subsequent period. Of the total cost of projects sanctioned in 2021-22, 9.7 per cent was already spent prior to 2021-22. From the planned expenditure, the capex envisaged in 2021-22 through banks/FIs showed a decline of 3.8 per cent, from ₹1,33,498 crore during 2020-21 to ₹1,28,366 crore during 2021-22 (Annex: Table A1). In 2021-22, capex planned to be incurred from resources raised through ECB route increased sharply by 73.4 per cent to ₹64,178 crore from its level a year ago. The capital market (equity route) enabled the financing of envisaged capex of ₹1,178 crore in 2021-22, significantly higher than in the previous year (Annex: Table A2, A3). To sum up, a total capex investment of ₹1,93,722 crore was expected to be made by the private corporate sector in 2021-22, recording an increase of 13.5 per cent from the planned phasing of the previous year. This rise is attributed to resources raised through ECB route (Annex: Table A4). The phasing profile of the envisaged capex, based on the pipeline projects5 sanctioned by the banks/ FIs in the previous years prior to the reference year, increased from ₹68,469 crore in 2021-22 to ₹71,012 crore in 2022-23; but based on all channels of financing together, it remained lower at ₹97,644 crore in 2022-23 as against ₹1,07,535 crore in 2021-22 (Annex: Table A1 and A4). V. Conclusion This article uses data on investment intentions by the private corporate sector based on the phasing plans (ex-ante) of their project proposals to arrive at the aggregate investment intentions and assess the outlook for investment activity in the near term. After set back in pandemic period, announcements of new investment projects increased significantly during 2021-22, with total cost of project recording an increase of about 90 per cent over 2020-21, but still remaining below the pre-pandemic level. Infrastructure sector continued to attract maximum capex projects, led by ‘Power’ and ‘Road & Bridges’ sectors. Reflecting various policy initiatives undertaken by the government, investment in renewable energy is gaining traction over the years. This would help in achieving the targets set under COP-26. Going forward, improved private corporate balance sheet, rising capacity utilisation level, robust demand sentiments, higher capital spending and various policy initiatives by the government are expected to revive the capex cycle.
Annex | Table A1: Phasing of Capex of Projects Sanctioned by Banks/FIs | | Year of sanction ↓ | No of Projects | Project Cost in the Year of Sanction (in ₹ crore) | Project Cost due to Revision/ Cancella- tion^ (in ₹ crore) | 2012-13 | 2013-14 | 2014-15 | 2015-16 | 2016-17 | 2017-18 | 2018-19 | 2019-20 | 2020-21 | 2021-22 | 2022-23 | Beyond 2022-23 | | | 1 | 2 | 3 | 4 | 5 | 6 | 7 | 8 | 9 | 10 | 11 | 12 | 13 | 14 | 15 | | up to 2012-13 | | | | 2,35,368 | 1,35,834 | 48,733 | 14,263 | 7,316 | 2,045 | | | | | | | | 2013-14 | 472 | 1,34,019 | 1,27,328 | 15,139 | 34,769 | 44,925 | 19,909 | 7,105 | 2,677 | 1,472 | | | | | | | | | | (5.0) | | | | | | | | | | | | | | 2014-15 | 326 | 87,601 | 87,253 | 98 | 14,822 | 34,589 | 25,765 | 9,535 | 1,246 | 162 | 1,036 | | | | | | | | | (0.4) | | | | | | | | | | | | | | 2015-16 | 346 | 95,371 | 91,781 | | 3,787 | 7,434 | 37,517 | 28,628 | 8,079 | 4,964 | 1,152 | 220 | | | | | | | | (3.8) | | | | | | | | | | | | | | 2016-17 | 541 | 1,82,807 | 1,79,249 | | 1,352 | 3,952 | 25,388 | 71,186 | 41,075 | 21,643 | 8,566 | 4,001 | 2,086 | | | | | | | (2.0) | | | | | | | | | | | | | | 2017-18 | 485 | 1,72,831 | 1,68,239 | | | 620 | 15,184 | 12,445 | 63,001 | 41,436 | 22,767 | 10,202 | 2,342 | 242 | | | | | | (2.6) | | | | | | | | | | | | | | 2018-19 | 409 | 1,76,581 | 1,59,189 | | | | 569 | 6,862 | 11,000 | 59,973 | 47,080 | 21,248 | 9,759 | 2,663 | 35 | | | | | (9.8) | | | | | | | | | | | | | | 2019-20 | 320 | 2,00,038 | 1,75,830 | | | | | | 4,049 | 14,524 | 53,978 | 58,556 | 28,116 | 14,114 | 2,493 | | | | | (12.1) | | | | | | | | | | | | | | 2020-21 | 220 | 75,558 | 75,558 | | | | | | | 2,491 | 3,709 | 29,013 | 26,166 | 9,711 | 4,468 | | | | | (0.0) | | | | | | | | | | | | | | 2021-22 | 403 | 1,43,314 | | | | | | | | | 3,610 | 10,258 | 59,897 | 44,282 | 25,267 | | Total& | | | | 2,50,605 | 1,90,564 | 1,40,253 | 1,38,595 | 1,43,077 | 1,33,172 | 1,46,665 | 1,41,898 | 1,33,498 | 1,28,366 | 71,012 | 32,263 | | Percentage change | | | | | -24.0 | -26.4 | -1.2 | 3.2 | -6.9 | 10.1 | -3.3 | -5.9 | -3.8 | # | | &: Column totals indicate envisaged capex in a particular year covering the projects which received financial assistance in various years. The estimate is ex-ante incorporating only envisaged investments. They are different from those actually realised/utilised.
#: Per cent change for 2022-23 is not worked out as capex from proposal that are likely to be sanctioned in 2022-23 is not fully available.
^: Figures in bracket are percentage of revision/cancellation. |
| Table A2: Phasing of Capex Projects* Funded Through ECBs/ FCCBs/RDBs** | | Loans contracted in ↓ | No of LRNs issued | Total loan contracted
(₹ crore) | 2012-13 | 2013-14 | 2014-15 | 2015-16 | 2016-17 | 2017-18 | 2018-19 | 2019-20 | 2020-21 | 2021-22 | 2022-23 | Beyond 2022-23 | | | 1 | 2 | 3 | 4 | 5 | 6 | 7 | 8 | 9 | 10 | 11 | 12 | 13 | 14 | | up to 2012-13 | | | 53,465 | 22,667 | 6,400 | 1,333 | | | | | | | | | | 2013-14 | 563 | 80,736 | | 56,197 | 20,976 | 3,563 | | | | | | | | | | 2014-15 | 478 | 57,327 | | | 36,791 | 16,806 | 3,151 | 575 | 2 | 2 | | | | | | 2015-16 | 314 | 38,885 | | | | 28,998 | 7,311 | 2,572 | 4 | | | | | | | 2016-17 | 346 | 22,154 | | | | | 14,953 | 6,005 | 1,192 | 2 | 2 | | | | | 2017-18 | 419 | 37,896 | | | | | | 17,822 | 13,054 | 6,484 | 529 | 7 | | | | 2018-19 | 515 | 72,490 | | | | | | | 46,221 | 17,725 | 1,236 | 5,398 | 1,844 | 66 | | 2019-20 | 495 | 95,491 | | | | | | | | 65,367 | 17,157 | 11,717 | 965 | 285 | | 2020-21 | 344 | 40,382 | | | | | | | | | 18,084 | 21,523 | 642 | 133 | | 2021-22 | 361 | 47,824 | | | | | | | | | | 25,533 | 21,793 | 498 | | Total& | | | 53,465 | 78,864 | 64,167 | 50,700 | 25,415 | 26,974 | 60,473 | 89,580 | 37,008 | 64,178 | 25,244 | 982 | | Percentage change | | | | 47.5 | -18.6 | -21.0 | -49.9 | 6.1 | 124.2 | 48.1 | -58.7 | 73.4 | # | | *: Projects which did not receive assistance from banks/FIs.
**: Rupee Denominated Bonds (RDBs) have been included since 2016-17.
#: Per cent change for 2022-23 is not worked out as capex from proposals that are likely to be drawn in 2022-23 is not fully available.
&: The estimate is ex-ante incorporating only envisaged investment. They are different from those actually realised/utilised.
LRN: Loan registration number |
| Table A3: Phasing of Capex of Projects Funded Through Equity Issues* | | Equity issued during ↓ | No. of Companies | Capex Envisaged
(₹ crore) | 2012-13 | 2013-14 | 2014-15 | 2015-16 | 2016-17 | 2017-18 | 2018-19 | 2019-20 | 2020-21 | 2021-22 | 2022-23 | Beyond 2022-23 | | | 1 | 2 | 3 | 4 | 5 | 6 | 7 | 8 | 9 | 10 | 11 | 12 | 13 | 14 | | Up to 2012-13 | | | 988 | 494 | 108 | | | | | | | | | | | 2013-14 | 21 | 454 | | | 384 | 70 | | | | | | | | | | 2014-15 | 24 | 1,078 | | | 189 | 557 | 332 | | | | | | | | | 2015-16 | 40 | 4,511 | | | 11 | 644 | 2,753 | 849 | 183 | 71 | | | | | | 2016-17 | 29 | 1,159 | | | | 14 | 471 | 368 | 163 | 143 | | | | | | 2017-18 | 51 | 1,538 | | | | | | 419 | 327 | 787 | 5 | | | | | 2018-19 | 39 | 609 | | | | | | | 506 | 90 | 13 | | | | | 2019-20 | 12 | 53 | | | | | | | 2 | 49 | 2 | | | | | 2020-21 | 12 | 663 | | | | | | | | | 139 | 421 | 84 | 19 | | 2021-22 | 27 | 3,410 | | | | | | | | | 10 | 757 | 1,304 | 1,339 | | Total& | | | 988 | 494 | 692 | 1,285 | 3,556 | 1,636 | 1,181 | 1,140 | 169 | 1,178 | 1,388 | 1,358 | | Percentage change | | | | -50.0 | 40.1 | 85.7 | 176.7 | -54.0 | -27.8 | -3.5 | -85.2 | 597.0 | # | | *: Projects which did not receive assistance from banks/FIs/ECBs/FCCBs/RDBs.
#: Per cent change for 2022-23 is not worked out as capex from proposals that are likely to be implemented in 2022-23 is not fully available.
&: The estimate is ex-ante incorporating only envisaged investment, they are different from those actually realised/utilised. |
| Table A4: Phasing of Capex of Projects Funded Through Banks/FIs/IPOs/ECBs/FCCBs/RDBs* | | Year of sanction ↓ | No of Companies | Project Cost (₹ crore) | 2012-13 | 2013-14 | 2014-15 | 2015-16 | 2016-17 | 2017-18 | 2018-19 | 2019-20 | 2020-21 | 2021-22 | 2022-23 | Beyond 2022-23 | | Banks/ FIs/ ECBs/ FCCBs/ RDBs/IPOs | | | 1 | 2 | 3 | 4 | 5 | 6 | 7 | 8 | 9 | 10 | 11 | 12 | 13 | 14 | | up to 2012-13 | | | 2,89,821 | 1,58,995 | 55,241 | 15,596 | 7,316 | 2,045 | | | | | | | | 2013-14 | 1056 | 2,08,518 | 15,139 | 90,966 | 66,285 | 23,542 | 7,105 | 2,677 | 1,472 | | | | | | | 2014-15 | 828 | 1,45,658 | 98 | 14,822 | 71,569 | 43,128 | 13,018 | 1,821 | 164 | 1,038 | | | | | | 2015-16 | 700 | 1,35,177 | | 3,787 | 7,445 | 67,159 | 38,692 | 11,500 | 5,151 | 1,223 | 220 | | | | | 2016-17 | 916 | 2,02,562 | | 1,352 | 3,952 | 25,402 | 86,610 | 47,448 | 22,998 | 8,711 | 4,003 | 2,086 | | | | 2017-18 | 955 | 2,07,673 | | | 620 | 15,184 | 12,445 | 81,242 | 54,817 | 30,038 | 10,736 | 2,349 | 242 | | | 2018-19 | 963 | 2,32,288 | | | | 569 | 6,862 | 11,000 | 1,06,700 | 64,895 | 22,497 | 15,157 | 4,507 | 101 | | 2019-20 | 827 | 2,71,374 | | | | | | 4,049 | 14,526 | 1,19,394 | 75,715 | 39,833 | 15,079 | 2,778 | | 2020-21 | 576 | 1,16,603 | | | | | | | 2,491 | 3,709 | 47,236 | 48,110 | 10,437 | 4,620 | | 2021-22 | 791 | 1,94,548 | | | | | | | | 3,610 | 10,268 | 86,187 | 67,379 | 27,104 | | Total& | | | 3,05,058 | 2,69,922 | 2,05,112 | 1,90,580 | 1,72,048 | 1,61,782 | 2,08,319 | 2,32,618 | 1,70,675 | 1,93,722 | 97,644 | 34,603 | | Percentage Change | | | | -11.5 | -24.0 | -7.1 | -9.7 | -6.0 | 28.8 | 11.7 | -26.6 | 13.5 | # | | *: Rupee Denominated Bonds (RDBs) have been included since 2016-17.
#: Per cent change for 2022-23 is not worked out as capex from proposals that are likely to be sanctioned in 2022-23 is not fully available.
&: The estimate is ex-ante incorporating only envisaged investment, they are different from those actually realised/utilised. |
| Table A5: Size-wise Distribution of Projects Sanctioned by Banks/FIs: 2012-13 to 2021-22 | | Period | Number and Share of Projects | Less than ₹100 crore | ₹100 crore to ₹500 crore | ₹500 crore to ₹1000 crore | ₹1000 crore to ₹5000 crore | ₹5000 crore & above | Total | | 2012-13 | No. of Projects | 245 | 119 | 20 | 23 | 7 | 414 | | | Per cent Share | 4.8 | 14.6 | 7.3 | 26.8 | 46.4 | 100 (1,89,483) | | 2013-14 | No. of Projects | 306 | 115 | 25 | 21 | 5 | 472 | | | Per cent Share | 8.3 | 20.0 | 13.9 | 29.1 | 28.7 | 100 (1,27,328) | | 2014-15 | No. of Projects | 223 | 65 | 18 | 19 | 1 | 326 | | | Per cent Share | 9.0 | 16.6 | 14.6 | 47.8 | 12.0 | 100 (87,253) | | 2015-16 | No. of Projects | 214 | 76 | 34 | 21 | 1 | 346 | | | Per cent Share | 8.6 | 20.9 | 26.0 | 38.5 | 5.9 | 100 (91,781) | | 2016-17 | No. of Projects | 287 | 180 | 29 | 40 | 5 | 541 | | | Per cent Share | 5.8 | 23.3 | 11.9 | 41.7 | 17.4 | 100 (1,79,239) | | 2017-18 | No. of Projects | 263 | 149 | 28 | 42 | 3 | 485 | | | Per cent Share | 5.2 | 21.0 | 10.8 | 43.8 | 19.1 | 100 (1,68,239) | | 2018-19 | No. of Projects | 220 | 110 | 39 | 36 | 4 | 409 | | | Per cent Share | 4.8 | 17.0 | 17.0 | 39.6 | 21.6 | 100 (1,59,189) | | 2019-20 | No. of Projects | 150 | 84 | 45 | 36 | 5 | 320 | | | Per cent Share | 3.3 | 11.9 | 18.6 | 37.4 | 28.8 | 100 (1,75,830) | | 2020-21 | No. of Projects | 128 | 52 | 15 | 24 | 1 | 220 | | | Per cent Share | 5.5 | 16.8 | 14.2 | 53.5 | 10.0 | 100 (75,558) | | 2021-22 | No. of Projects | 202 | 126 | 37 | 36 | 2 | 403 | | | Per cent Share | 5.6 | 19.9 | 19.8 | 46.8 | 7.8 | 100 (1,43,314) | Note: i. Figures in brackets are total cost of projects in ₹ crore.
ii. Per cent share is the share in total cost of projects. Percentages may not total 100 due to rounding. |
| Table A6: Purpose-wise Distribution of Projects Sanctioned by Banks/FIs during 2012-13 to 2021-22 | | Period | Number and Share of Projects | New | Expansion & Modernisation | Diversification | Others | Total | | 2012-13 | No. of Projects | 303 | 107 | – | 4 | 414 | | | Per cent Share | 84.2 | 14.7 | – | 1.1 | 100 (1,89,483) | | 2013-14 | No. of Projects | 361 | 95 | 2 | 14 | 472 | | | Per cent Share | 65.2 | 20.1 | – | 14.7 | 100 (1,27,328) | | 2014-15 | No. of Projects | 203 | 92 | 2 | 29 | 326 | | | Per cent Share | 39.4 | 14.7 | 0.2 | 45.7 | 100 (87,253) | | 2015-16 | No. of Projects | 260 | 64 | 3 | 19 | 346 | | | Per cent Share | 73.6 | 14.3 | 0.1 | 12 | 100 (91,781) | | 2016-17 | No. of Projects | 429 | 97 | 4 | 11 | 541 | | | Per cent Share | 78.6 | 9.9 | 0.1 | 11.3 | 100 (1,79,249) | | 2017-18 | No. of Projects | 396 | 80 | 2 | 7 | 485 | | | Per cent Share | 89.0 | 9.5 | 0.1 | 1.5 | 100 (1,68,239) | | 2018-19 | No. of Projects | 309 | 80 | – | 20 | 409 | | | Per cent Share | 76.8 | 19.3 | – | 3.9 | 100 (1,59,189) | | 2019-20 | No. of Projects | 262 | 37 | 1 | 20 | 320 | | | Per cent Share | 79.8 | 13.7 | – | 6.4 | 100 (1,75,830) | | 2020-21 | No. of Projects | 181 | 38 | 1 | – | 220 | | | Per cent Share | 94.1 | 5.9 | – | – | 100 (75,558) | | 2021-22 | No. of Projects | 313 | 89 | 1 | – | 403 | | | Per cent Share | 89.1 | 10.8 | 0.1 | – | 100 (1,43,314) | Note: i. Figures in brackets are total cost of projects in ₹ crore.
ii. Per cent share is the share in total cost of projects. Percentages may not total 100 due to rounding.
iii. -: Nil/ Negligible. |
| Table A7: Industry-wise Distribution of Projects Sanctioned by Banks/FIs: 2012-13 to 2021-22 | | Industry | 2012-13 | 2013-14 | 2014-15 | 2015-16 | 2016-17 | 2017-18 | 2018-19 | 2019-20 | 2020-21 | 2021-22 | | No. of Pro jects | Per cent Share | No. of Pro jects | Per cent Share | No. of Pro jects | Per cent Share | No. of Pro jects | Per cent Share | No. of Pro jects | Per cent Share | No. of Pro jects | Per cent Share | No. of Pro jects | Per cent Share | No. of Pro jects | Per cent Share | No. of Pro jects | Per cent Share | No. of Pro jects | Per cent Share | | Infrastructure | 82 | 47.9 | 87 | 39.8 | 74 | 48.8 | 108 | 72.0 | 204 | 62.6 | 150 | 51.8 | 122 | 60.4 | 99 | 61.5 | 63 | 74.3 | 96 | 56.7 | | i) Power | 71 | 39.4 | 70 | 35.1 | 65 | 42.2 | 92 | 57.1 | 170 | 45.4 | 117 | 36.5 | 78 | 26.8 | 47 | 32.9 | 35 | 49.3 | 59 | 29.5 | | ii) Telecom | 2 | 5.6 | 1 | – | 1 | 4.9 | 1 | 0.3 | 1 | – | – | – | – | – | – | – | – | – | – | – | | iii) Ports & Airports | 1 | 1.9 | 1 | 0.8 | – | – | 3 | 2.4 | 8 | 5.7 | 6 | 3.1 | 4 | 14.2 | 4 | 8.4 | 1 | 0.1 | 2 | 5.8 | | iv) Storage & Water Management | – | – | 5 | 1.1 | 2 | 0.6 | 4 | 4.2 | 6 | 3.7 | 2 | 0.4 | 13 | 5.7 | 4 | 0.4 | 5 | 1.2 | 2 | 0.2 | | v) SEZ, Industrial, Biotech and IT Park | 8 | 0.9 | 8 | 1.5 | 3 | 0.9 | 1 | 0.4 | 2 | 0.4 | 9 | 1.6 | 11 | 3.2 | 8 | 1.3 | 5 | 2.2 | 3 | 1.1 | | vi) Roads & Bridges | – | – | 2 | 1.2 | 3 | 0.3 | 7 | 7.6 | 17 | 7.3 | 16 | 10.1 | 16 | 10.4 | 36 | 18.5 | 17 | 21.5 | 30 | 20.1 | | Construction | 20 | 2.8 | 27 | 2.1 | 29 | 4.0 | 26 | 1.8 | 60 | 12.0 | 39 | 5.3 | 26 | 2.3 | 44 | 11.4 | 27 | 4.8 | 23 | 7.3 | | Textiles | 31 | 1.9 | 58 | 10.3 | 50 | 4.1 | 49 | 4.8 | 57 | 4.1 | 54 | 3.7 | 27 | 3.4 | 11 | 0.5 | 15 | 1.8 | 56 | 4.5 | | Electrical Equipments & Electronics | 10 | 1.9 | 9 | 2.0 | 7 | 0.2 | 2 | 0.2 | 9 | 0.2 | 6 | 0.2 | 1 | 0.1 | 4 | – | 1 | 0.1 | 5 | 4.0 | | Metal & Metal Products | 51 | 28.9 | 44 | 17.0 | 17 | 17.4 | 14 | 1.5 | 23 | 4.9 | 21 | 9.7 | 16 | 3.0 | 14 | 0.8 | 6 | 0.8 | 27 | 3.9 | | Chemicals & Fertilisers | 19 | 1.1 | 15 | 1.0 | 7 | 2.6 | 11 | 1.6 | 10 | 2.1 | 23 | 11.4 | 19 | 2.9 | 12 | 1.3 | 9 | 1.6 | 20 | 3.4 | | Cement | 11 | 3.9 | 12 | 7.1 | 7 | 3.8 | 5 | 1.9 | 5 | 2.3 | 3 | 0.6 | 10 | 5.1 | 2 | 0.1 | 5 | 1.3 | 3 | 3.2 | | Transport Services | 16 | 1.7 | 15 | 0.5 | 5 | 0.6 | 10 | 1.2 | 12 | 0.4 | 16 | 4.1 | 5 | 0.2 | 14 | 1.4 | 1 | 0.1 | 19 | 2.5 | | Hospitals & Health Services | 17 | 1.4 | 10 | 0.7 | 2 | 0.1 | 1 | – | 22 | 1.1 | 18 | 1.8 | 15 | 2.6 | 12 | 0.7 | 7 | 0.3 | 19 | 2.3 | | Food Products | 36 | 0.9 | 43 | 1.8 | 34 | 2.9 | 26 | 1.8 | 38 | 0.9 | 47 | 2.8 | 28 | 1.4 | 32 | 1.9 | 20 | 1.5 | 25 | 1.7 | | Pharmaceuticals | 10 | 0.4 | 19 | 1.3 | 9 | 1.5 | 11 | 0.3 | 12 | 1.1 | 15 | 0.6 | 23 | 1.6 | 9 | 0.6 | 7 | 0.5 | 20 | 1.3 | | Manufacturing of Non-electric Machinary | 9 | 0.7 | 6 | 1.2 | – | – | – | – | 4 | 0.2 | 2 | – | 20 | 3.7 | 3 | 0.1 | 3 | 0.3 | 7 | 1.3 | | Printing & Publishing | 1 | – | 2 | 4.2 | 1 | – | 1 | – | 3 | 0.1 | 1 | 0.1 | – | – | 1 | 0.6 | – | – | 1 | 1.1 | | Glass & Pottery | 3 | – | 11 | 0.3 | 19 | 0.7 | 8 | 0.5 | 19 | 0.6 | 20 | 0.8 | 2 | – | – | – | 12 | 0.6 | 9 | 1.1 | | Coke and Petroleum Products | – | – | 1 | 0.5 | 1 | 3.4 | 2 | 2.0 | 2 | 0.5 | 1 | 0.4 | – | – | 3 | 8.0 | – | – | 7 | 1.0 | | Others* | 98 | 6.2 | 113 | 10.2 | 64 | 9.8 | 72 | 10.3 | 61 | 7.0 | 69 | 6.9 | 95 | 13.2 | 60 | 10.9 | 44 | 12.2 | 66 | 4.7 | | Total | 414 | 100 | 472 | 100 | 326 | 100 | 346 | 100 | 541 | 100 | 485 | 100 | 409 | 100 | 320 | 100 | 220 | 100 | 403 | 100 | | Total Cost of Projects (in ₹ crore) | 1,89,483 | 1,27,328 | 87,253 | 91,781 | 1,79,249 | 1,68,239 | 1,59,189 | 1,75,830 | 75,558 | 1,43,314 | *: Comprise industries like Hotel & Restaurants, Rubber & Plastic Products, IT Software, Sugar and allied products, Transport Equipment, Paper & Paper Products, Agricultural & Related Activities, Mining & Quarrying, Entertainment, Trading of services, other manufacturing, other services.
Note: i. Per cent share is the share in total cost of project. Percentages may not total 100 due to rounding.
ii. -: Nil/Negligible. |
| Table A8: State-wise Distribution of Projects Sanctioned by Banks/FIs: 2012-13 to 2021-22 | | Industry | 2012-13 | 2013-14 | 2014-15 | 2015-16 | 2016-17 | 2017-18 | 2018-19 | 2019-20 | 2020-21 | 2021-22 | | No. of Pro jects | Per cent Share | No. of Pro jects | Per cent Share | No. of Pro jects | Per cent Share | No. of Pro jects | Per cent Share | No. of Pro jects | Per cent Share | No. of Pro jects | Per cent Share | No. of Pro jects | Per cent Share | No. of Pro jects | Per cent Share | No. of Pro jects | Per cent Share | No. of Pro jects | Per cent Share | | Rajasthan | 41 | 5.3 | 24 | 1.4 | 29 | 11.1 | 10 | 0.9 | 23 | 2.8 | 33 | 6.3 | 21 | 7.7 | 23 | 3.8 | 21 | 17.1 | 33 | 13.3 | | Uttar Pradesh | 26 | 4.4 | 21 | 1.1 | 20 | 5.4 | 15 | 2.5 | 22 | 3.7 | 30 | 2.4 | 28 | 4.8 | 24 | 5.6 | 30 | 13.7 | 33 | 12.9 | | Gujarat | 58 | 5.6 | 66 | 14.5 | 71 | 9.5 | 61 | 15.1 | 102 | 23.0 | 71 | 8.0 | 56 | 11.1 | 47 | 15.1 | 54 | 17.1 | 83 | 11.9 | | Maharashtra | 67 | 10.7 | 76 | 19.7 | 38 | 14.8 | 36 | 9.4 | 57 | 8.8 | 65 | 23.3 | 34 | 11.5 | 41 | 6.9 | 13 | 8.5 | 44 | 9.5 | | Tamil Nadu | 22 | 1.8 | 33 | 5.4 | 27 | 2.9 | 26 | 9.3 | 23 | 4.4 | 28 | 6.6 | 32 | 12.8 | 28 | 8.3 | 7 | 0.7 | 40 | 8.7 | | Karnataka | 20 | 1.6 | 39 | 6.2 | 27 | 5.4 | 21 | 6.2 | 52 | 6.8 | 64 | 9.6 | 34 | 5.7 | 33 | 17.2 | 11 | 6.1 | 24 | 6.8 | | Kerala | 3 | 0.3 | 3 | – | 4 | 0.2 | 4 | 0.1 | 6 | 2.7 | 3 | 0.1 | 6 | 0.9 | 3 | 1.0 | - | - | 5 | 4.2 | | Madhya Pradesh | 13 | 3.9 | 30 | 6.1 | 14 | 3.9 | 21 | 7.0 | 18 | 7.5 | 10 | 0.7 | 12 | 1.6 | 10 | 1.2 | 19 | 2.8 | 18 | 4.1 | | Bihar | 7 | 0.1 | 6 | 0.2 | 4 | 0.1 | 6 | 0.2 | 4 | 0.2 | 3 | 0.1 | 6 | 0.4 | 6 | 3.4 | 1 | – | 5 | 3.3 | | Telangana | - | - | - | - | - | - | 10 | 3.8 | 51 | 5.5 | 17 | 1.9 | 26 | 9.1 | 12 | 4.0 | 9 | 1.9 | 15 | 3.0 | | Goa | 2 | 0.2 | - | - | - | - | 1 | – | 3 | 0.6 | 2 | 1.9 | 3 | 1.8 | 2 | 0.1 | - | - | 3 | 2.9 | | West Bengal | 13 | 1.0 | 12 | 1.2 | 9 | 1.3 | 14 | 3.1 | 18 | 1.7 | 14 | 1.8 | 13 | 1.1 | 7 | 0.9 | 3 | 0.4 | 11 | 2.6 | | Andhra Pradesh | 35 | 5.7 | 37 | 4.0 | 24 | 8.1 | 33 | 12.3 | 47 | 8.0 | 22 | 9.9 | 29 | 11.1 | 12 | 4.0 | 7 | 15.0 | 12 | 2.3 | | Odisha | 10 | 26.8 | 10 | 11.7 | 5 | 15.9 | 6 | 3.1 | 6 | 3.1 | 5 | 3.0 | 9 | 1.4 | 6 | 1.9 | 2 | 0.1 | 9 | 2.1 | | Punjab | 12 | 10.9 | 28 | 1.5 | 6 | 0.3 | 11 | 1.7 | 29 | 2.1 | 31 | 2.2 | 15 | 1.9 | 9 | 0.8 | 4 | 0.7 | 15 | 2.1 | | Haryana | 18 | 1.2 | 15 | 1.1 | 11 | 1.9 | 16 | 3.6 | 13 | 1.6 | 21 | 0.5 | 18 | 1.7 | 20 | 3.4 | 15 | 7.8 | 14 | 2.0 | | Himachal Pradesh | 5 | 0.3 | 3 | 1.8 | 3 | 0.1 | 8 | 1.4 | 1 | – | 8 | 2.3 | 7 | 0.3 | 6 | 0.1 | 4 | 0.2 | 7 | 1.2 | | Jharkhand | 8 | 1.2 | 4 | 0.3 | 2 | 0.7 | 5 | 0.3 | 1 | – | 3 | 0.3 | 2 | 0.5 | 4 | 9.4 | 1 | 0.2 | 6 | 0.8 | | Delhi | 4 | 0.6 | 5 | 0.4 | 2 | 0.1 | 1 | 0.1 | 5 | 0.3 | 6 | 1.2 | 8 | 1.3 | 3 | 0.6 | 2 | 0.1 | 3 | 0.6 | | Chhatisgarh | 9 | 4.1 | 16 | 10.7 | 8 | 7.4 | 8 | 4.6 | 15 | 4.0 | 7 | 4.8 | 6 | 0.9 | 6 | 0.2 | 3 | 1.2 | 4 | 0.6 | | Multi-State # | 15 | 7.7 | 21 | 6.9 | 10 | 9.5 | 13 | 13.5 | 17 | 11.8 | 16 | 7.5 | 15 | 9.8 | 8 | 11.7 | 2 | 1.4 | 7 | 4.0 | | Others* | 26 | 6.8 | 23 | 5.7 | 12 | 1.3 | 20 | 1.6 | 28 | 1.3 | 26 | 5.6 | 29 | 3.0 | 10 | 0.5 | 12 | 5.2 | 12 | 0.9 | | Total | 414 | 100 | 472 | 100 | 326 | 100 | 346 | 100 | 541 | 100 | 485 | 100 | 409 | 100 | 320 | 100 | 220 | 100 | 403 | 100 | | Total Cost of Projects (in ₹ crore) | 1,89,483 | 1,27,328 | 87,253 | 91,781 | 1,79,249 | 1,68,239 | 1,59,189 | 1,75,830 | 75,558 | 1,43,314 | #: Comprise projects over several states.
*: Comprise remaining states/union territories.
Note: i. Per cent share is the share in total cost of project. Percentages may not total 100 due to rounding.
ii. -: Nil/Negligible. |
|