The outlook for the global economy remains clouded with downside risks. Global financial conditions have been tightening and deteriorating market liquidity is amplifying financial price movements. Markets are now pricing in moderate increases in policy rates and risk-on appetite has returned. In India, supply responses in the economy are gaining strength. With headline inflation begining to show signs of easing, the domestic macroeconomic outlook can best be characterised as resilient but sensitive to formidable global headwinds. Urban demand appears robust, rural demand is muted but more recently picking up traction. Introduction Medium-term forecasts present a deteriorating global economic outlook, with associated fears that a polycrisis on a global scale may be looming. So many engines of global growth are stalling all at once! The International Monetary Fund (IMF) predicts that a third of the global economy is going into contraction this year or next. Yet, data arrivals of the most recent vintage on the far side of the Atlantic and in India suggest a grudging let-up in inflationary pressures. Consumer price index (CPI) inflation has somewhat eased across BRICS economies and in several other emerging market economies (EMEs) as well, benefiting from lower commodity prices, especially food. GDP releases have also surprised on the upside, with a slender upturn in economic activity defeating the market’s pronouncement of a so called technical recession – markets rushed in where the angels (read as economists) fear to tread. A relief rally swept across the world on November 11 following the release of US consumer prices for October, lifting many boats in its swell. Illustratively, between October 27 and November 11, the Indian rupee appreciated by 2.2 per cent against the US dollar; by 1.2 per cent against the pound sterling and; by 0.5 per cent against the Euro. In the recent period, the US dollar’s rally to successive highs has sent currencies across the world into a downward spiral; but a closer look reveals that EME currencies are posting only half the losses seen in advanced economy (AE) currencies. Volatility in G7 currencies has surged above that of EM currencies for the first time since March 2020. This reflects resilience and the fact that early, aggressive rate hikes have delivered real rates or close to them, offering higher carry – Latin America has led the way. The BIS Triennial Survey of Over-the-counter (OTC) Foreign Exchange Turnover reveals that (i) trading in OTC FX markets reached US$ 7.5 trillion a day (April 2022), up 14 per cent from three years earlier; (ii) the US dollar was one side of 88 per cent of all trades; (iii) the renminbi’s share rose to 7 per cent, becoming the fifth most traded currency; (iv) the share of the Indian rupee (INR) dipped to 1.6 per cent from 1.7 per cent three years earlier. In exchange traded derivatives, however, the INR’s share at 12.9 per cent is the fourth largest, following the USD (98.8 per cent), the Euro (18.9 per cent) and the Brazilian real (31.1 per cent). In the November 11, relief rally, equity markets worldwide clawed back recent losses – the MSCI world equity index rose by 6.3 per cent during the same period, with the EME sub-index up 8.9 per cent. While global financial conditions have been tightening and deteriorating market liquidity is amplifying financial price movements, markets are now pricing in more moderate increases in policy rates and risk-on appetite has returned. If these data have any lead information content, the hard landing that is widely feared may turn out to be less painful. The point is to seize the opportunity provided by this turn in the ebbs and flows of global finance. As Shakespeare put it in his play Julius Caesar “There is a tide in the affairs of men. Which, taken at the flood, leads on to fortune”. There is a turn in the thinking of central banks – some of them have slowed rate increases, and indicated that the end of rate raising is in sight. Some of them are delivering ‘75s’ but assuaging them with dovish pivots. Lags in the transmission of monetary policy create the risk that they may ease off too soon as they see the outlook becoming darker, as set out earlier. Notwithstanding these developments, the world is facing a daunting future. In its latest Global Financial Stability Report (GFSR), the IMF has highlighted two major risks to global financial stability: disorderly tightening of financial conditions; and debt distress among emerging and frontier economies. Other risks are the climate financing gap and open-ended investment funds. Noting with concerns the steep reserve losses, currency depreciations and capital outflows that threaten financial stability across emerging and developing countries, the GFSR pragmatically recommends “some combination of targeted foreign exchange interventions, capital flow measures and/or other actions to help smooth exchange rate adjustments to financial stability risks.” If pockets of financial vulnerabilities exist, selected macroprudential tools should be used. Mitigating liquidity stress is paramount in these highly unsettled times. Turning to the Indian economy, recent developments have thrown up both risks and opportunities. The macroeconomic outlook can best be characterized as resilient but sensitive to formidable global headwinds. GDP data for Q2:2022-23 will be available by the end of this month; based on high frequency indicators, our nowcasting and full information models peg real GDP growth in Q2 between 6.1 and 6.3 per cent. If this is realised, India is on course for a growth rate of about 7 per cent in 2022-23. In Q3, supply responses in the economy are gaining strength. The cumulative procurement of rice during this kharif marketing season has already crested last year’s collection. Although wheat procurement has declined quite sharply, the good news is that rabi sowing is up year-on-year backed up by good north-east monsoon rainfall and reservoir water storage levels. Industrial production (IIP) shed the contraction in August and turned in positive momentum in September on a seasonally adjusted basis after a gap of two months. This is corroborated by the manufacturing purchasing managers’ index (PMI) for October. In the services sector, the PMI for October accelerated from a six-month low in September. The construction sector remains in expansion, and contact-intensive services, in particular, hospitality, travel and recreation, are experiencing explosive growth. Aggregate demand, on the other hand, is showing an uneven profile. While urban demand appears robust as the section on domestic developments profiles, rural demand which was muted, is gaining some strength recently. In the financial sector, system liquidity is normalising in consonance with the stance of monetary policy but it is still in surplus mode, with the Reserve Bank absorbing about ₹1.5 lakh crore on a daily basis on average. The effective absorption rate1 rose by 1.75 percentage points between end-April and mid-November in response to monetary policy actions. In the first 11 days of November, net inflows of portfolio investment have more than doubled over the level for the full month of October inflow. On the other hand, the yield on the 10-year G-sec benchmark has traded on a soft note in October and November in relation to its peak in mid-June. Commercial bank credit growth has been surging, led by services, personal loans, agriculture and industry, in that order. Reflecting the growing preference for bank credit for working capital requirements, issuances of CPs and corporate bonds have declined. The banking system is well-capitalised, with capital ratios for the system well above 16 per cent of total risk-weighted assets. The provision coverage ratio is above 70 per cent, even unadjusted for write-offs. Gross non-performing assets (GNPAs) have consistently declined, with net NPAs were sliding down towards 1 per cent of total assets. Liquidity cover is robust and profitability is shored up. The levels of inflation are, however, impacting corporate performance. Corporate earnings results covering more than 90 per cent of all listed non-financial companies point to loss of momentum in earnings in the second quarter of 2022-23. Expenditure growth, driven by input cost pressures, outpaced revenue growth, exerting pressure on operating profits and sending them into contraction. With other income declining in this quarter, net profits contracted on a y-o-y basis. Set against this backdrop, the remainder of the article is structured into four sections. Section II captures the rapidly evolving developments in the global economy. An assessment of domestic macroeconomic conditions is presented in Section III. Section IV reviews financial conditions in India, while the last Section concludes the article. II. Global Setting Geopolitical hostilities without any end in sight, combined with aggressive and synchronised monetary tightening across economies to bring inflation down to tolerable levels, are clearly weighing on global growth. However, as few countries have started exhibiting signs of softening inflation, some central banks have either begun to pause tightening cycle or have hinted at lowering the pace of rate hikes going forward. Global stock markets remain edgy with an upward bias and sovereign bond yields continue to harden. The US dollar remains strong, but increasingly, two-way expectations on the magnitude and timing of rate hikes are impacting global economic prospects with attendant spillovers that cascade onto the shores of emerging and developing economies. Against this backdrop, our model based nowcast of global GDP indicates stagnant growth momentum during Q3:2022 (Chart 1: a & b). 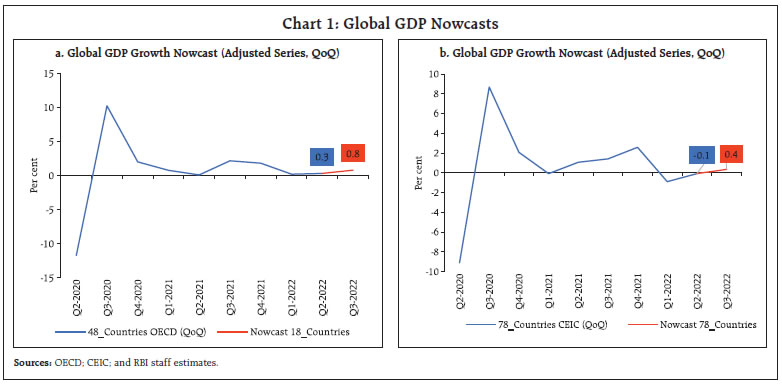
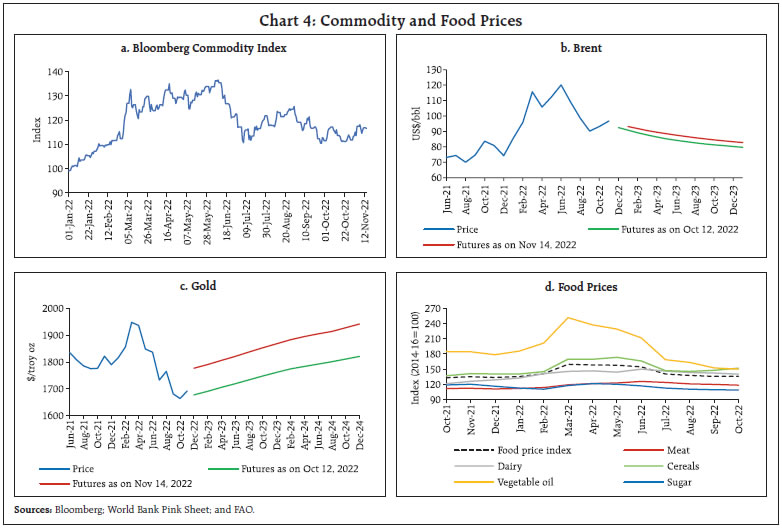
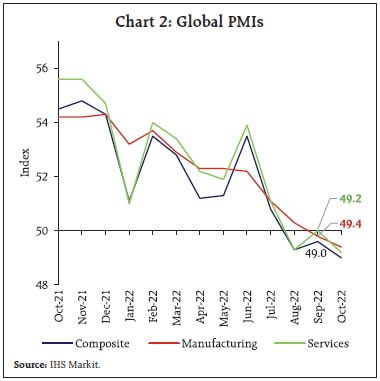 Among high frequency indicators, the global composite purchasing managers’ index (PMI) signalled a downturn for the third consecutive month in October 2022, the lowest since June 2020, with both manufacturing output and services business activity declining (Chart 2). The global manufacturing PMI remained in contraction zone for the second successive month, as output in the intermediate goods sector fell. World merchandise trade volume rose by 5.3 per cent year-on-year (y-o-y) in August 2022, up from 5.1 per cent in July on positive momentum offsetting an unfavourable base effect (Chart 3a). Waning demand for vessels caused the Baltic Dry Index, a measure of shipping charges for dry bulk commodities, to slide down by 16.9 per cent by end October, after rising for a short period in the early part of the month (Chart 3b). This treading down has extended into early November. PMI sub-indices indicate lower levels of new export business and receding volumes of international trade flows for the eighth successive month. Global commodity prices remained volatile in October and early November as slowing global growth dampened demand in spite of the war in Ukraine providing unrelenting upsides (Chart 4a). Crude oil prices traded at an average of US$ 93 per barrel in October and US$ 97 in the first half of November (up to November 14, 2022) on the back of slowing global demand and the strengthening US dollar (Chart 4b). In its latest Short-term Energy Outlook for November 2022, the US Energy Information Administration (EIA) forecast the average Brent crude oil spot price at US$ 93 per barrel in the fourth quarter of 2022 and US$ 95 per barrel in 2023. The outlook is highly uncertain – potential supply disruptions and slower-than-expected crude oil production could lead to higher oil prices, while the possibility of slower-than-forecast economic growth may contribute to lower prices. Gold prices remained volatile in October, edging up marginally in the early part of the month but gradually losing pace and declining due to rising US 10-year G-sec yields (Chart 4c). However, gold prices gained momentum in early November on account of soft US inflation number. The FAO food price index registered its seventh consecutive monthly decline in October, marked by a fall in all its sub-indices except cereals which have been on the rise for two months in a row (Chart 4d). 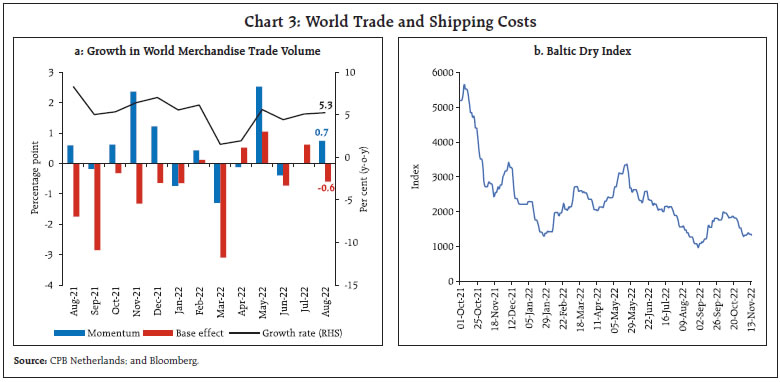
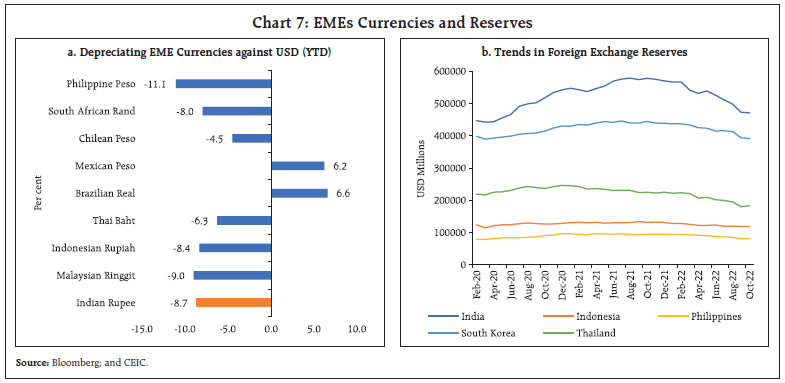
 Consumer price inflation reigns high across economies due to sustained cost push pressures from elevated food and energy prices and lingering pandemic-induced supply chain bottlenecks, although there are signs of inflation easing in a few economies, especially amongst Emerging Market Economies (EMEs). US CPI inflation softened to 7.7 per cent (y-o-y) in October 2022 from 8.2 per cent in September, while personal consumption expenditure (PCE) based inflation held steady at 6.2 per cent (y-o-y) in September 2022. In the Euro Area, on the other hand, inflation soared to a new peak of 10.6 per cent in October 2022, up from 9.9 per cent in September on high energy, food, alcohol and tobacco prices. In the UK, CPI inflation shot up to 11.1 per cent in October, rising from 10.1 per cent in September (Chart 5a). Among the BRICS economies, inflation in Brazil eased to 6.5 per cent in October from 7.2 per cent in September, in Russia it eased to 12.6 per cent in October from 13.7 per cent in September, while in China inflation fell to 2.1 per cent in October 2022 vis-à-vis 2.8 per cent in September 2022 (Chart 5b).  Global equity markets, which were shedding gains in early October, rebounded in the later part of the month on expectations of more moderate US Fed actions going forward. The MSCI world equity index ended the month 6 per cent higher than in September, led by the AE sub-index (Chart 6a). Equity markets shed a part of the gains in early November but clawed them back in more recent days after the lower-than-expected US CPI inflation print. In the bond market, 10-year G-sec yields hardened in October across major AEs reflecting central banks’ persisting hawkish monetary policy stance. The 10-year US treasury yield shot up by 22 basis points in October while the 2-year G-sec yield rose by 20 bps, with the yield curve remaining inverted since July 5, 2022 (Chart 6b). The US dollar (USD) reversed its rally in early November on cooler US inflation number. Concomitantly, the MSCI currency index for EMEs, which had remained volatile in October exacerbated by capital outflows, showed an uptick in early November (Chart 6c & 6d). Many Asian EMEs have witnessed sharp depreciations of their currencies (Chart 7a), translating into larger import bills and debt servicing costs. Also, emerging Asian central banks have seen a fall in their foreign-exchange reserves (Chart 7b). Central banks of most AEs and EMEs continued with their aggressive monetary tightening to bring down inflation, although magnitude of rate hikes seems to have slowed. On November 2, 2022 the US Federal Open Markets Committee (FOMC) went for a fourth consecutive 75 bps rate hike and communicated that ongoing increases will be appropriate to return inflation to 2 per cent over time (Chart 8a). The European Central Bank (ECB) and Bank of Canada also frontloaded their monetary policy with a 75 bps and 50 bps rate hike in October. The UK and Australia raised their policy rates by 75 bps and 25 bps, respectively, in November. Norway increased its policy rate by 25 bps in November. Japan, however, continued to diverge by maintaining an accommodative stance. 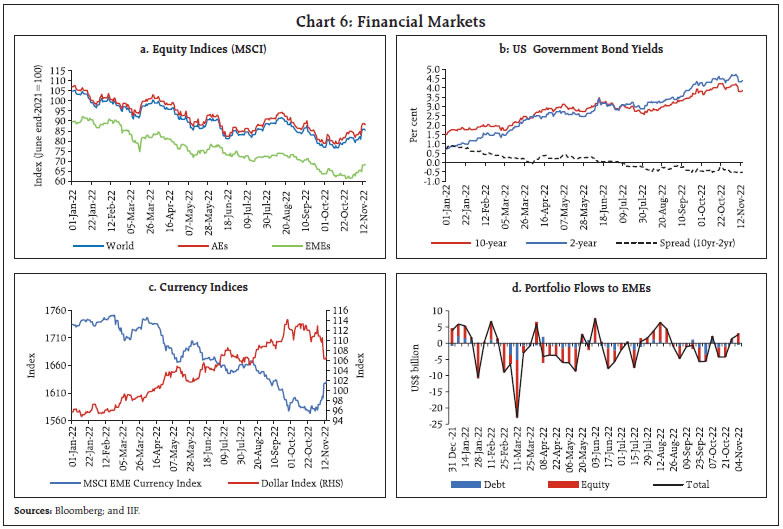
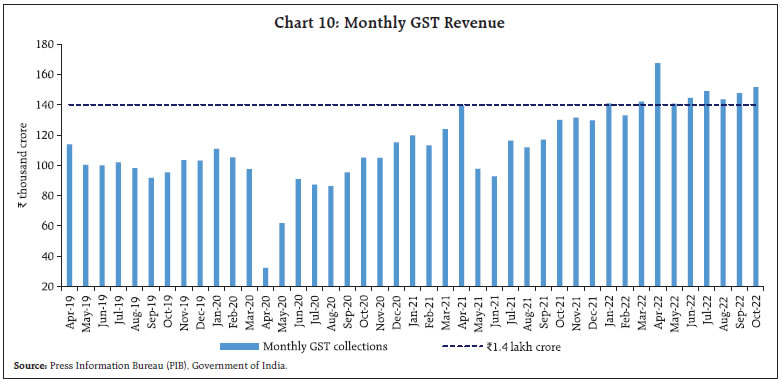
 Most EME central banks have also continued with policy tightening, although the pace of tightening has slowed for a few countries while few others have even announced a pause in their tightening cycles (Chart 8b). Colombia and Indonesia increased their policy rates by 100 bps and 50 bps, respectively, in October while Malaysia increased its policy rate by 25 bps in November. Brazil went for a pause in its October meeting and maintained its rate at 13.75 per cent. In contrast to other EMEs, Turkey cut its rate by 150 bps in October and China remained accommodative. III. Domestic Developments Lead indicators of economic activity point to sustained resilience of the Indian economy in an uncertain and increasingly hostile global environment. Our economic activity index that employs a dynamic factor model (DFM) with 27 high frequency indicators nowcasts GDP growth for Q2: 2022-23 at 6.1 per cent (Chart 9). Among the major lead indicators, GST collections (Centre plus states) in October 2022 stood at ₹1.52 lakh crore, the second highest since the inception of the regime, buoyed by the festival season (Chart 10). E-way bills generation was sustained above the 75 million mark, albeit moderating from a series high recorded in September (Chart 11a). Toll collections strengthened both in volume and value terms (Chart 11b). 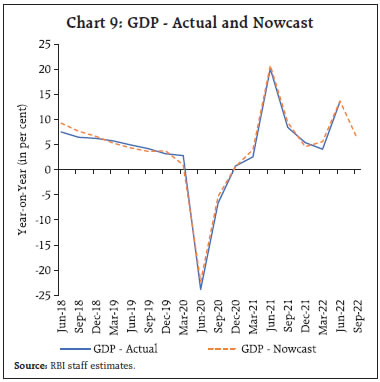
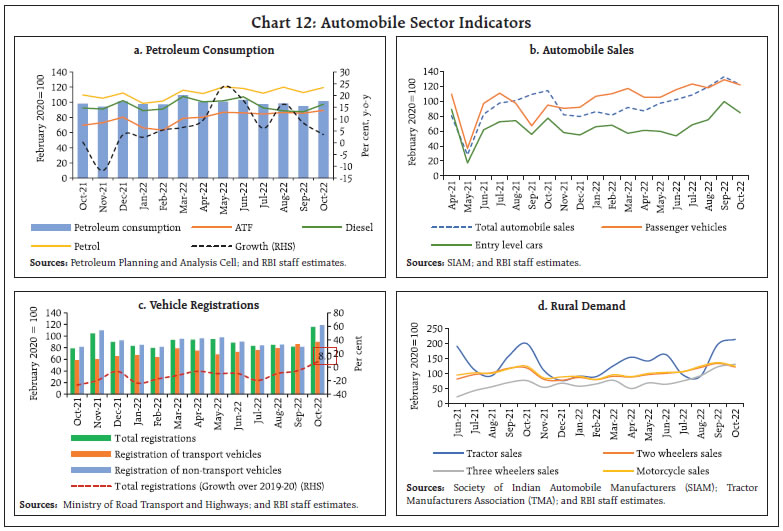
 Fuel consumption increased in October, with a surge in festival season led travel, pick-up in agricultural activity and a generalised rise in demand (Chart 12a). Sales of automobiles remained robust in October, propelled by demand for sports utility vehicles (SUVs) and mid-segment cars, even as it moderated sequentially as the festival season concluded. Sales in the entry level vehicle segment reversed to below pre-pandemic levels (Chart 12b). Retail sales increased in October, as reflected in decadal high registrations, particularly in the passenger vehicles segment (Chart 12c). Aided by festival season demand, rural demand sustained above pre-pandemic levels for the second consecutive month. The farm sector remained positive, with domestic sales of tractors recording growth even as sales of two wheelers and motorcycles remained muted due to price hikes dampening demand (Chart 12d). Sales of three wheelers increased by 30 per cent over pre-pandemic levels and by 70.4 per cent y-o-y. The electric vehicles segment recorded robust performance, with electric two-wheeler sales increasing by about 30 per cent over the previous month and sales of electric passenger vehicles increasing by 178 per cent over October 2021. 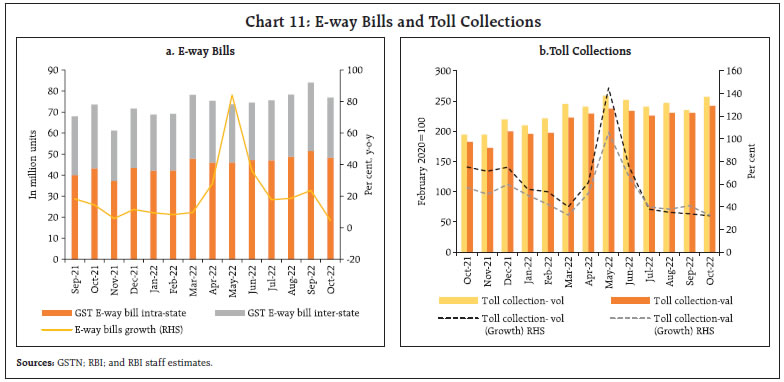
 Sales of fast-moving consumer goods (FMCG) products declined y-o-y by 0.5 per cent in October. Over the previous month, it increased modestly by 0.5 per cent. Rural sales increased m-o-m by 0.8 per cent while urban sales declined 0.1 per cent against September levels. The drag in sales was recorded post Diwali, whereas till Diwali i.e., October 1 to October 24, 2022, sales increased by 5.6 per cent, while they declined 15.1 per cent post festival. As per the household survey of the Centre for Monitoring Indian Economy (CMIE), the all-India unemployment rate increased to 7.8 per cent in October 2022 from 6.4 per cent in the previous month, driven by a spike in the rural unemployment rate. Similarly, the all-India labour force participation and employment rates came down marginally in October, even though they improved in urban areas (Chart 13). In terms of the organised sector employment outlook, the purchasing managers’ index (PMI) employment sub-index for manufacturing accelerated to a 33-month high as higher sales and production requirements during the festival season encouraged firms to expand their payrolls. The services sector employment PMI remained in expansion for the fifth consecutive month, with the rate of job increases turning out to be the second quickest in over three years, aided by ongoing increase in new business and output requirements (Chart 14). In the rural sector, the demand for work under the Mahatma Gandhi National Rural Employment Act (MGNREGA) declined in October by 7.5 per cent due to the commencement of Rabi sowing operations. This reflects greater absorption of labour into productive economic activities, thereby moderating the work demand under the MGNREGA (Chart 15). India’s merchandise exports fell to a 20-month low at US$ 29.78 billion in October 2022. The m-o-m contraction of 19.4 per cent was the sharpest since April 2020 reflecting the knock-on effects of worsening global economic outlook (Chart 16a). Imports contracted by 11.4 per cent sequentially (m-o-m) to US$ 56.69 billion, the lowest monthly level in the current financial year. The increase of imports by 5.7 per cent on a y-o-y basis was also the lowest since January 2021 (Chart 16b).
Commodity-wise, electronic goods, oil seeds and meals contributed to export growth positively. Major export items such as engineering goods and petroleum products, however, turned out to be drags. Non-oil exports at US$ 25.03 billion declined for the fourth consecutive month in October (Chart 17a). Regarding imports, petroleum and its products, fertilizers and iron and steel contributed positively whereas gold, electronic goods, pearls, precious and semi-precious stones pulled imports down (Chart 17b).
At US$ 4.8 billion in October 2022, petroleum exports, which had been a major driver of export growth in recent months, decreased by 11.3 per cent (y-o-y) and dropped sharply to about half of their level in September 2022 (Chart 18).
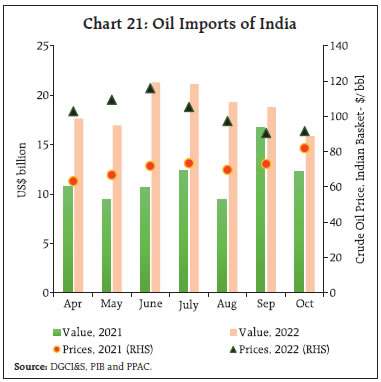
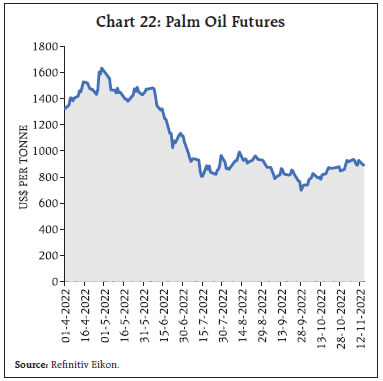
Declining for the fifth straight month in October 2022, engineering exports at US$ 7.40 billion fell by 32.8 per cent from an all-time high of US$ 11.02 billion in March 2022, and by 21.3 per cent on a y-o-y basis. The high import content in engineering exports has resulted in higher prices of finished goods due to surging US dollar.2 The contribution of iron and steel to total engineering exports has fallen by 14 per cent in September 2022 (Chart 19a). Destination-wise, China was the leading contributor to fall in engineering goods exports (Chart 19b). In terms of export outlook, India remains an outlier in the index for new export orders in October 2022, which has remained in contraction mode for most major economies (Chart 20). India’s petroleum imports declined by 15.7 per cent m-o-m to reach US$ 15.9 billion in October 2022 (Chart 21). As per the World Oil Outlook (OPEC), India is set to be the largest contributor to incremental global oil demand in the long term. Vegetable oil imports at US$ 1.58 billion fell by 3.4 per cent y-o-y in October 2022. According to the Solvent Extractor’s Association of India (SEA), import of edible oils during oil year 2021-22 (November-21 to October-22) rose by around 25.6 per cent to reach US$ 19.6 billion. International palm oil prices edged up in October (Chart 22). The government has revised upwards the import tariff on crude palm oil by 11.0 per cent to US$ 952 per tonne and on RBD palm oil by 6.3 per cent to US$ 962 per tonne3. Global palm oil prices are expected to strengthen further as excess rains in Malaysia have curbed output on one hand, and falling stockpiles in Indonesia have triggered fears of export restrictions which were suspended in June4. 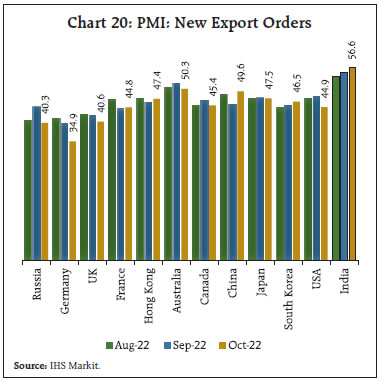
 Electronic goods, which account for 11 per cent of total imports stood at US$ 6.2 billion in October 2022. They fell by 13 per cent m-o-m and 9.2 per cent y-o-y. Cooling consumer demand for electronics such as smartphones and personal computers (PCs) have impacted global semiconductor sales, which declined by 3 per cent on a y-o-y basis in September 2022, first contraction since January 20205. After an initial shortage of chips in 2021, the global slowdown, coupled with rising inventories, have clouded the near-term outlook for the chip industry. Semiconductor manufacturing is highly concentrated in East Asia with China, Taiwan and South Korea accounting for 58 per cent share in semiconductor manufacturing capacity in 2020. The danger of extreme concentration in the industry is highlighted by a staggering 92 per cent control by only one company – TSMC in Taiwan – for most advanced chips6. Recent US restrictions blocking sale of high-end semiconductor technology to China added further uncertainty to the prospects of the chip industry. The merchandise trade deficit fell marginally from a month ago to US$ 26.9 billion in October 2022 (Chart 23). During H1:2022-23, the gross fiscal deficit stood at 37.3 per cent of budget estimates (BE), marginally higher than in the previous year. The thrust on capital spending continued, with a growth in capital outlay of 52.2 per cent (y-o-y). Revenue expenditure recorded a muted growth of 6.0 per cent, leading to a marked improvement in the quality of spending (Chart 24). On the receipts side, gross tax revenue witnessed double digit growth during H1: 2022-23, with direct and indirect taxes registering y-o-y growth rates of 23.2 per cent and 11.9 per cent, respectively (Chart 25). Contraction in excise and custom duty revenues on the back of cuts in excise duty on petrol and diesel in May 2022, implementation of free trade agreements with some countries, and reduction in customs duty on commodities such as cotton and vegetable oil, acted as drags. Non-tax revenues have also picked up in Q2:2022-23 (after witnessing a contraction in Q1), primarily owing to an increase in non-tax collections from economic services7. Aggregate Supply The south-west monsoon withdrew from the country on October 23. North-easterly winds in the lower tropospheric levels over the Bay of Bengal and South Peninsular India ushered in the North East Monsoon (NEM), which commenced over southern India on October 29, 2022. As per the Indian Meteorological Department (IMD), the all-India cumulative rainfall during NEM stood above the long period average by 36 per cent as of November 14, with 32 states/UTs out of 36 recording normal or above normal cumulative rainfall (Chart 26).
The third advance estimate (3rd AE) of horticulture production for the year 2021-2022 indicates a record production level of 342.3 million tonnes from an area of 28.08 million hectares. The area and production of total horticulture crops have grown 2.2 per cent and 2.3 per cent, respectively, in comparison with the final estimates for 2020-21. All major sub-groups recorded growth in production over a year ago (Chart 27). 
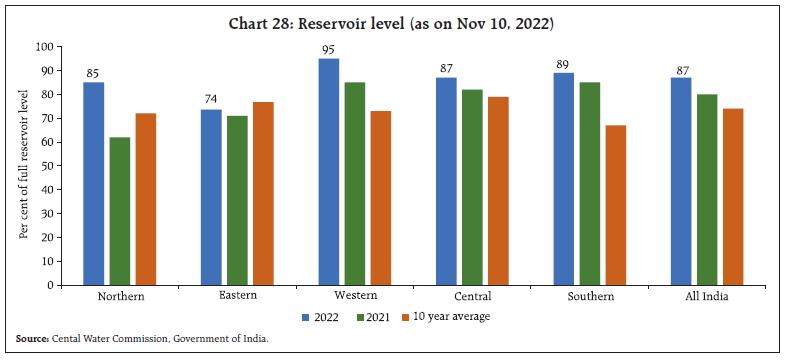 The reservoirs’ storage levels are comfortable at 87 per cent of the full capacity as on November 10, 2022, as against last year’s level of 80 per cent and the decadal average of 74 per cent (Chart 28). Rabi sowing area at 178.2 lakh hectares as on November 11, 2022, is running 5.6 per cent higher than the previous year’s level, aided by wheat, rice and oilseeds (Chart 29). The Government of India announced the Minimum Support Prices (MSPs) for the upcoming Rabi Marketing Season (RMS 2023-24) with a y-o-y growth in the range of 2.0 to 9.1 per cent (Chart 30). The MSPs are at levels of at least 1.5 times the all-India weighted average cost of production, in line with the announcement made in the Union Budget 2018-19. The announcement of higher MSPs for various rabi crops has also facilitated the smooth progress of Rabi 2022-23 crop sowing. 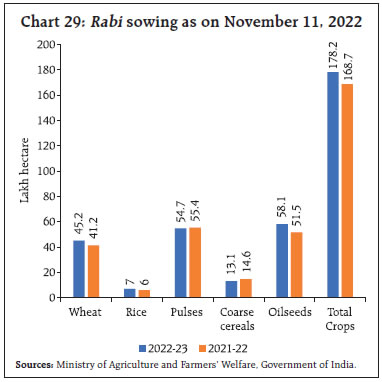 In the industrial sector, the headline manufacturing purchasing managers’ index (PMI) at 55.3 expanded at a stronger pace in October 2022 than last month. It was driven up by an increase in employment and stock purchases. Business confidence as captured by the future output sub-index outpaced its long-run average, expanding at 63 in October, albeit moderating from a seven year high of 65.4 recorded last month (Chart 31a). The services PMI also indicated upbeat sentiment, with the business expectations Index surpassing its long run average and increasing to its highest mark since January 2015. This improvement was due to domestic demand and sustained increase in new business output (Chart 31b). 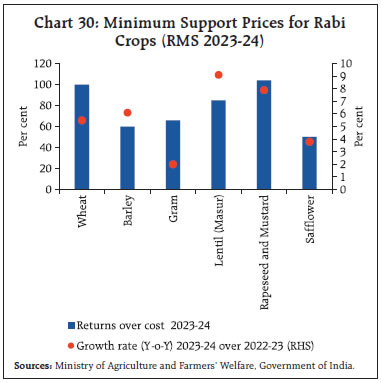
 In the services sector, transport indicators reflect a mixed picture, with railway freight traffic earnings recording deceleration in growth at 1.4 per cent (y-o-y) in October 2022 as compared with 8.4 per cent in the previous year (Chart 32a), even as it increased by 2.8 per cent m-o-m. Cargo traffic at major ports recorded a marginal increase in October owing to an improvement in cargo of fertilizers and coal (Chart 32b). In the construction sector, cement production and steel consumption maintained growth momentum; steel consumption recorded double digit growth over pre-pandemic levels for the second consecutive month in October 2022 (Chart 33). Cement production picked up in September as easing monsoon aided construction activity. Over September 2019, it continued to record double digit expansion. Passenger footfalls picked up in October over the previous month for both domestic and international passengers. On the other hand, air cargo recorded a m-o-m contraction in both domestic and international sectors. In November (up to November 8, 2022), activity in the passenger segment increased on a m-o-m basis, with the pick up in festival demand in the domestic passenger segment. The cargo segment contracted for both domestic and international freight (Table 1).
Inflation The provisional data released by the National Statistical Office (NSO) on November 14, 2022, showed that inflation, measured by y-o-y changes in the all-India consumer price index (CPI), moderated to 6.8 per cent in October from 7.4 per cent in September. This was primarily driven by softening in food inflation (Chart 34a and 34b). A month-on-month increase in the index (momentum) by 80 bps was more than offset by a favourable base effect (month-on-month change in prices a year ago) of around 140 bps, resulting in a deceleration in headline inflation by around 60 bps between September and October. Positive price momentum was witnessed in all three major groups viz., food, fuel and core (excluding food and fuel). The m-o-m increase in prices was of the order of 96 bps for the food and beverages group, 56 bps for the fuel group and 68 bps for the core CPI category. Among major sub-groups, vegetables prices increased 4.1 per cent m-o-m (Chart 35). The sharp softening in CPI food inflation to 7.0 per cent in October from 8.4 per cent in September was on account of a favourable base effect of 226 bps, which was partially offset by a surge in price momentum by 96 bps. In terms of sub-groups, inflation softened in edible oils, fruits, vegetables, pulses and sugar (Chart 36). On the other hand, inflation edged up in cereals, meat and fish, milk and spices. Inflation in prepared meals and non-alcoholic beverages remained steady in October. Eggs registered lower deflation.
Inflation in the fuel and light category moderated to 9.9 per cent in October from 10.4 per cent in September, largely on account of favourable base effects. LPG and kerosene (PDS) inflation softened for the third consecutive month while electricity prices continued to remain in deflation. The fuel group, with a weight of 6.8 per cent in the CPI basket, contributed 10.0 per cent of headline inflation in October. Core inflation remained steady at 6.0 per cent in October. While sub-groups such as pan, tobacco and intoxicants, recreation and amusement, and transport and communication witnessed moderation in inflation, health, education and personal care and effects registered an increase. Inflation in clothing and footwear, housing and household goods and services remained steady (Chart 36). In terms of regional distribution, rural inflation at 7.0 per cent was higher than urban inflation (6.5 per cent) in October 2022. Among the states, Mizoram, Telangana and Tripura experienced inflation in excess of 8 per cent whereas Goa, Manipur and Delhi recorded inflation below 4 per cent (Chart 37). High frequency food price data for the month of November so far (November 1-14) from the Department of Consumer Affairs (DCA) shows that the increase in wheat and atta prices was offset by softening rice prices. Pulses and edible oils prices registered broad-based increases. Among key vegetables, prices of onions hardened and potato prices continued to increase, but tomato prices declined (Chart 38).
Retail selling prices of petrol and diesel in the four major metros remained steady in November so far. While kerosene prices increased in November, LPG prices were kept unchanged (Table 2). Input cost pressures increased in October 2022 across manufacturing and services as reflected in the PMIs. Selling prices also edged up across manufacturing and services, with the services sector registering price increases higher than the long-run average. | Table 2: Petroleum Products Prices | | Item | Unit | Domestic Prices | Month-over-month (per cent) | | Nov-21 | Oct-22 | Nov-22^ | Oct-22 | Nov-22^ | | Petrol | ₹/litre | 105.57 | 102.92 | 102.92 | 0.0 | 0.0 | | Diesel | ₹/litre | 91.69 | 92.72 | 92.72 | 0.0 | 0.0 | | Kerosene (subsidised) | ₹/litre | 39.51 | 57.55 | 59.38 | -4.3 | 3.2 | | LPG (non-subsidised) | ₹/cylinder | 910.13 | 1063.25 | 1063.25 | 0.0 | 0.0 | ^: For the period November 1-14.
Note: Other than kerosene, prices represent the average Indian Oil Corporation Limited (IOCL) prices in four major metros (Delhi, Kolkata, Mumbai and Chennai). For kerosene, prices denote the average of the subsidised prices in Kolkata, Mumbai and Chennai.
Sources: IOCL; Petroleum Planning and Analysis Cell (PPAC); and RBI staff estimates. | IV. Financial Conditions Higher festival season currency demand, goods and services tax (GST) and other tax related outflows, forex market operations, and robust credit demand further moderated surplus liquidity conditions. Subsequent government spending in the beginning of November eased liquidity strain in the banking system. Accordingly, the average daily absorptions under the liquidity adjustment facility (LAF) declined to ₹1.3 lakh crore during the second half of October through November 14, 2022 from ₹1.6 lakh crore during mid-September to October 13 (Chart 39). Of the daily average surplus liquidity during this period, ₹1.0 lakh crore was absorbed through the overnight standing deposit facility (SDF), while the remaining was mopped up through variable rate reverse repo (VRRR) auctions. On a net basis, liquidity slipped briefly into deficit during the second half of October which led to certain banks taking recourse to the marginal standing facility (MSF), which averaged ₹0.18 lakh crore during the period under review. Additionally, two fortnightly variable rate reverse repo (VRRR) auctions conducted during this period elicited subdued response with offers of ₹5,648 crore and ₹32,483 against the notified amount of ₹1.0 lakh crore and ₹1.5 lakh crore, respectively. As currency returns to the banking system alongside renewed FPI inflows, pressure on liqudity is expected to ease. Furthermore, deposit growth has shown signs of an uptick in recent period, thus bridging the gap with credit growth. Additionally, excess statutory liquidity ratio (SLR) holdings also provide cushion to banks in meeting potential liquidity requirements. 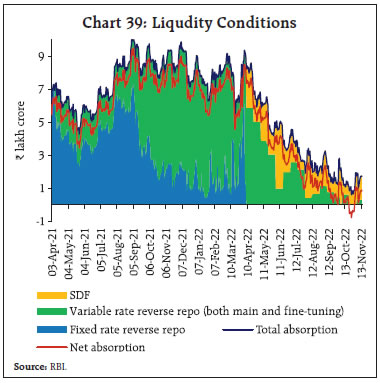 The depletion of liquidity at a faster pace pushed the weighted average call rate (WACR) towards the upper band of the corridor in late October with pass-through to other money market rates. However, it eased somewhat thereafter as government spending in the beginning of the month augmented liquidity. After briefly breaching the MSF rate, the WACR eased thereafter to average 6.03 per cent during the period under review (Chart 40a). In tandem, rates in the collateralised segment also firmed up, with triparty and market repo rates trading, on an average, 4 bps and 2 bps, respectively, above the policy repo rate. Across the term money segment, rate on 3-month treasury bill (T-bill), 3-month certificates of deposit (CDs) and 3-month commercial paper (CPs) traded on average 24 bps, 79 bps and 112 bps, respectively, above the MSF rate (Chart 40b). In the primary market, fund mobilisation through CD issuances has been robust this year at ₹3.5 lakh crore during the year so far (up to October 21), higher than ₹0.62 lakh crore for the corresponding period a year ago, reflecting banks’ demand for funds to meet the buoyant credit offtake. On the other hand, CP issuances have declined to ₹8.0 lakh crore during the year so far (up to October 31) from ₹11.2 lakh crore for the corresponding period a year ago, as the appetite for bank credit improved. In the fixed income market, bond yields largely tracked the movement in US treasury yields. During the second half of October, the 10-year G-sec yield came under pressure as the yield on the benchmark 10-year US treasury topped 4 per cent mark, rising to 4.24 per cent, its highest level since 2008. Subsequently, the yield on the 10-year US treasury eased, more so after the release of lower than expected CPI inflation reading, with a concomitant impact on domestic bond yields. The Indian benchmark yield on the 10-year G-sec softened from a high of 7.51 per cent at the close on October 21 to 7.29 per cent on November 14, 2022 (Chart 41a). Across the curve, G-sec yields generally softened (Chart 41b). 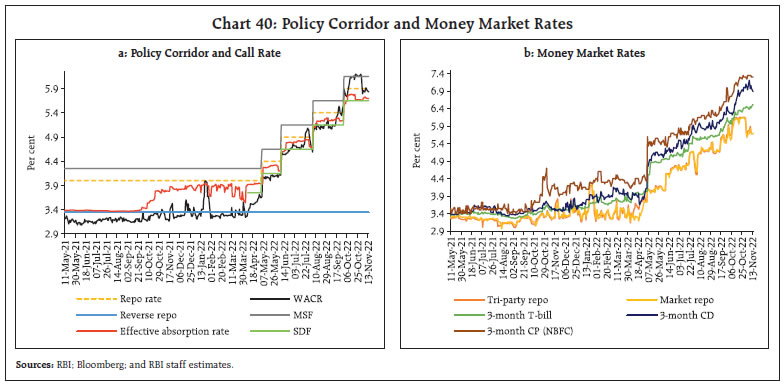 Corporate bond yields hardened and risk spreads rose across the ratings and tenor spectrum (Table 3). The increase has been particularly sharp for short tenor paper (AAA 1-year), reflecting the pass-through from higher money market rates amidst tightened liquidity conditions. Increased supply of corporate bonds as borrowers shifted to rupee denominated debt in an environment of tightening external financial conditions has also likely contributed to the rise in credit risk premiums. Fund raising through corporate bond issuances jumped to ₹83,690 crore during September 2022 (the highest so far in the current financial year) and dropped to ₹34,699 crore in October 2022 amidst higher interest rates. 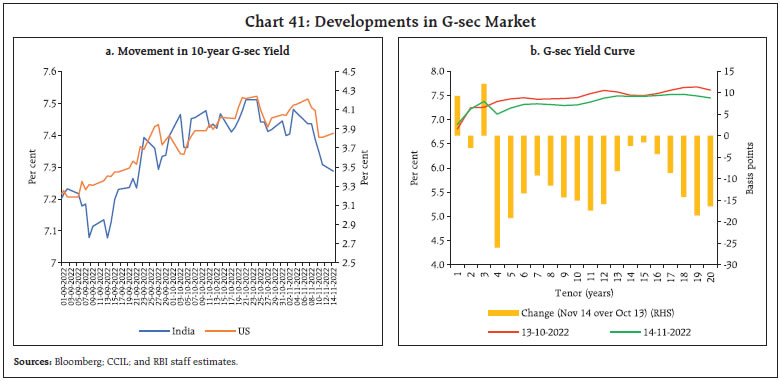 Reserve money (RM) excluding the first-round impact of change in cash reserve ratio (CRR) rose by 8.5 per cent on a y-o-y basis as on November 11, 2022 (7.1 per cent a year ago) (Chart 42). Currency in circulation (CiC) – the largest component of RM – recorded a growth of 7.7 per cent (7.8 per cent a year ago). Money supply (M3) grew by 7.8 per cent as on November 4, 2022 (11.0 per cent a year ago), primarily driven by its largest component – aggregate deposits with banks – which grew by 7.8 per cent (11.3 per cent a year ago). Scheduled commercial banks’ (SCBs’) credit grew by 17.0 per cent as on November 4, 2022 (7.1 per cent a year ago). | Table 3: Financial Markets - Rates and Spread | | Instrument | Interest Rates (per cent) | Spread (bps) (Over Corresponding Risk-free Rate) | | Sept 15-Oct 13, 2022 | Oct 14-Nov 11, 2022 | Variation (in bps) | Sept 15-Oct 13, 2022 | Oct 14-Nov 11, 2022 | Variation (in bps) | | 1 | 2 | 3 | (4 = 3-2) | 5 | 6 | (7 = 6-5) | | Corporate Bonds | | | | | | | | (i) AAA (1-year) | 7.01 | 7.77 | 76 | 14 | 83 | 69 | | (ii) AAA (3-year) | 7.75 | 7.87 | 12 | 47 | 46 | -1 | | (iii) AAA (5-year) | 7.7 | 7.94 | 24 | 23 | 42 | 19 | | (iv) AA (3-year) | 8.5 | 8.60 | 10 | 122 | 120 | -2 | | (v) BBB- (3-year) | 12.15 | 12.25 | 10 | 487 | 485 | -2 | Note: Yields and spreads are computed as monthly averages.
Sources: FIMMDA; and Bloomberg. |
 By end-October 2022, 29 out of 32 domestic banks have increased their external benchmark-based lending rates (EBLRs) by 190 bps in tandem with the increase in the policy repo rate since May 2022. SCBs have also increased their 1-year median marginal cost of funds-based lending rate (MCLR) by 85 bps during the period May to October 2022. In the current tightening period, i.e., May to September 2022, the WALR on fresh rupee loans of SCBs increased by 108 bps in response to the 140 bps increase in the policy repo rate.8 The increase in share of EBLR-linked loans (46.9 per cent as at end-June 2022), coupled with shorter reset periods (within 3 months in case of EBLR linked loans as compared with 1 year in case of the majority of MCLR linked loans) has significantly improved the pace of transmission to WALR on outstanding loans, which had remained muted in the earlier internal benchmark regimes (base rate and MCLR regime). The pass-through to WALR on outstanding rupee loans stood at 51 bps during May to September 2022. Banks have also raised their deposit rates in recent months. The median term deposit rates (i.e., average card rates on retail deposits) on fresh deposits increased by 48 bps during May to October 2022 (Table 4). Banks have increased their bulk deposit rates higher than retail deposit rates. | Table 4: Transmission from the Repo Rate to Banks’ Deposit and Lending Rates | | (Variation in basis points) | | Period | Repo Rate (bps) | Term Deposit Rates | Lending Rates | | Median TDR - Fresh Deposits | WADTDR- Outstanding Deposits | EBLR | 1-Year MCLR (Median) | WALR - Fresh Rupee Loans | WALR- Outstanding Rupee Loans | | Retail Deposits | Retail and Bulk Deposits | | (1) | (2) | (3) | (4) | (5) | (6) | (7) | (8) | | Easing Phase Feb 2019 to Mar 2022 | -250 | -208 | -188 | - | -155 | -232 | -150 | | Tightening Period May to Oct 2022* | +190 | 48 | 35 | 190 | 85 | 108 | 51 | | Memo | | | | | | | | | Sept to Oct 2022 | +50 | 4 | 9 | 50 | 25 | 26 | 10 | Note: 1. Latest data on WALRs and WADTDRs pertain to September 2022.
2. 29 domestic banks have increased their EBLRs by 190 bps as at end-October.
3. Includes repo rate increase of 50 bps on September 30, 2022.
4. Acronyms: WALR: Weighted Average Lending Rate. WADTDR: Weighted Average Domestic Term Deposit Rate; MCLR: Marginal Cost of Funds-based Lending Rate; EBLR: External Benchmark based Lending Rate.
Source: RBI staff estimates. | Across bank groups, transmission to lending and deposit rates of private sector banks (PVBs) has exceeded that of public sector banks (PSBs) in the current tightening period. The WALR on fresh rupee loans of PVBs increased by 116 bps, while that of PSBs increased by 104 bps (Chart 43). Credit growth for PVBs has been higher than for PSBs in the current tightening period. In view of the increase in credit demand, private banks have increased their lending and deposit rates to maintain higher net interest margins (NIMs). 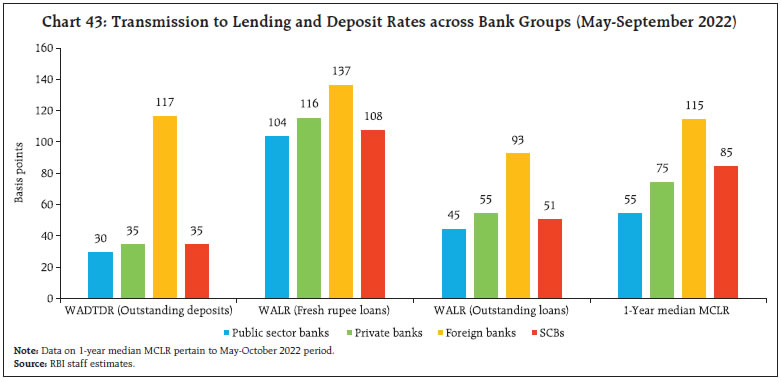 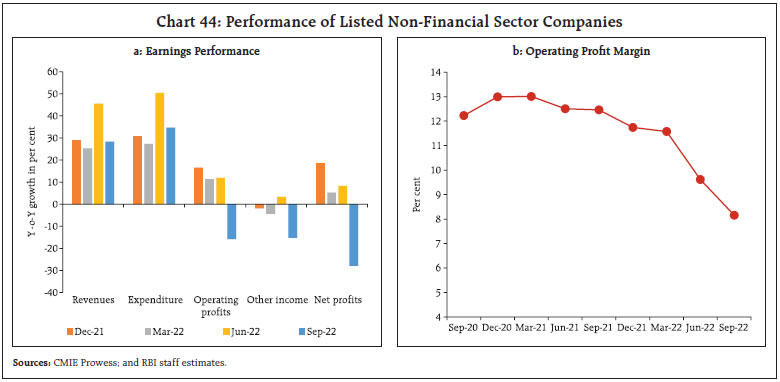 Corporate earnings exhibited signs of loss of momentum during Q2:2022-23. Revenue growth of 1,944 non-financial companies, constituting around 92 per cent of the market capitalisation of all listed non-financial companies, remained strong (Chart 44a). Expenditure growth driven by input cost pressures, however, outpaced revenue growth, exerting pressure on operating profit margins (Chart 44b). Consequently, the growth rate of operating profits for the sample of companies slipped into negative zone. Other income, which includes income from treasury management of companies, recorded a decline in the quarter. Pulled by the fall in operating profits, aggregate net profits of non-financial companies contracted on a y-o-y basis during the quarter. Early quarterly results indicate that the manufacturing sector (642 companies) recorded sales growth (y-o-y) of 22.7 per cent, which was partly aided by a price surge (Chart 45). Growth (y-o-y) in real sales, a proxy for volume growth, decelerated to 7.7 per cent in Q2 as compared with 19.3 per cent in the previous quarter. The moderation was especially high for petroleum companies. Operating profit margin moderated for these companies during the quarter. After remaining volatile in the first half of October 2022, domestic equity markets recorded a strong bounce back as global risk sentiments improved, and foreign portfolio investors (FPIs) turned net buyers during the month (Chart 46). Furthermore, strong earnings reports from financial sector corporates boosted the market sentiment. Overall, the BSE Sensex increased by 5.8 per cent in October 2022. Amongst sectoral indices, BSE Bankex registered the sharpest gain of 7.3 per cent during October 2022.
The Indian equity market continued its momentum in November 2022, buoyed by strong PMI and GST collections data and persistent FPI buying. Domestic equity markets rallied further amid a strong rebound in global equity markets following the release of lower-than-expected CPI inflation data in the US. The BSE Sensex increased by 1.4 per cent during the month to close at 61,624 on November 14, 2022. Gross inward foreign direct investment (FDI) at US$ 39.1 billion during April-September 2022 moderated from its level a year ago (Chart 47). Net FDI at US$ 20.2 billion during April-September 2022, however, remained almost at the same level as corresponding period a year ago, reflecting mainly a decrease in outward FDI from India. Manufacturing, retail and wholesale trade, computer services, communication services, and financial services received the major share of FDI equity inflows during April-September 2022. FPIs returned to the Indian market in October 2022, amidst market expectations that the US Federal Reserve would slow down the pace of rate hikes and the positive sentiment towards initial public offerings (Chart 48). Net purchases by FPIs in the equity market to the tune of US$ 1.0 billion prompted net inflows of US$ 0.6 billion in the month. FPIs were net purchasers in equity markets in major emerging market economies such as Brazil, Indonesia, and Thailand. In November 2022 (up to 11th), net purchases by FPIs were to the tune of US$ 2.3 billion. 
 Net external commercial borrowing (ECB) flows turned marginally negative during H1:2022-23, whereas gross ECB disbursements amounted to US$ 10.0 billion (US$ 13.5 billion during H1:2021-22) (Chart 49). Of the total ECBs registered during H1:2022-23, major agreements were for on-lending/sub-lending (32.0 per cent), new project (16.4 per cent) and refinancing of earlier ECBs (14.9 per cent) (Chart 50). The weighted average maturity of ECBs registered during H1:2022-23 elongated to 5.6 years (4.9 years in H1:2021-22), that should expose borrowers to lower roll-over risk in times of tightening financial conditions. Over 80 per cent of the agreement amount of ECBs remained effectively hedged in September 2022 in terms of explicit hedging, rupee denominated loans and loans from foreign parents (Chart 51), and the remaining ECBs included loans with natural hedges (i.e., borrowers’ earnings are in foreign currency), limiting the exposure of foreign commercial borrowings to exchange rate risk.
Benchmark global rates have been rising, with the London interbank offer rate (LIBOR) and the secured overnight financing rate (SOFR) increasing significantly by 369 bps and 291 bps, respectively, during January-September 2022. In comparison, the rise in overall cost of ECB loans has been relatively moderate as the weighted average interest rate spread of ECBs (over benchmark interest rate) was limited to 177 bps during April-September 2022 (Chart 52). India’s foreign exchange reserves, which were at US$ 530.0 billion as on November 4, 2022, recorded a decline of US$ 77.3 billion in 2022-23 so far, mainly on account of valuation loss due to the appreciation of US dollar against major currencies (Chart 53). This level of reserves covers 8.6 months of imports projected for 2022-23.
On July 6, 2022, the Reserve Bank released a circular on ‘Liberalisation of Forex Flows’ to enhance fresh inflows to the non-resident deposit accounts9. Subsequent to the policy measures10, net flows in the non-resident deposit accounts have picked up at an aggregate level during Q2:2022-23 (Chart 54). Component-wise, NRE deposits recorded a modest accretion in Q2:2022-23, barring an outflow in August 202211. Moreover, after 16 straight months of outflows since March 2021, FCNR(B) deposits witnessed inflows during Q2:2022-23, albeit with a modest outflow in September 2022. The UAE, the US and the UK continued to constitute the major source countries of NRI deposits during September 2022, with their combined share at about 49 per cent. Further, the US Dollar (USD) continued to be the key currency of FCNR(B) deposits, with its share at around 75 per cent, followed by the Japanese Yen (JPY) and Pound Sterling (GBP) together at around 20 per cent. In terms of the maturity pattern, more than one-third of the FCNR(B) deposits were above 3 years on an original maturity basis, followed by the deposits above 1 year and up to 2 years (30 per cent). In contrast, in the case of the NRE accounts, deposits up to 1 year constituted the largest share (47 per cent) based on original maturity. An assessment of the prevailing market dynamics reveals that the moderation in fresh inflows might be on account of (i) higher interest rates offered by overseas competitor banks and (ii) re-booking from saving deposits to time deposits to avail higher interest rates. Going forward, the outlook for NRI deposit flows would be conditioned by a host of factors which include the magnitude of expected slowdown in advanced economies as well as the pace and timing of further interest rate actions. In the foreign exchange market, the Indian rupee (INR) depreciated by 2.6 per cent against the US dollar (m-o-m) in October 2022 in tandem with most EMEs, mainly due to the unrelenting strong dollar (Chart 55). In real effective terms, the INR depreciated by 1.0 per cent (m-o-m) in October 2022, mainly due to the depreciation of the INR in nominal effective terms (Chart 56). Payment Systems Riding on the back of the festival season in October 2022, major payment indicators in the wholesale and retail segments continued to register good growth (y-o-y) in volume and value terms, notwithstanding some moderation owing to the COVID-19 induced high base effect a year ago (Table 5). There was an acceleration in the growth of credit and debit card transactions, signaling robust household consumption appetite. A recent report suggests that e-commerce penetration is expected to nearly double, and the workforce in the technology services sector may more than double by 2031.12 After achieving significant milestones in digital payments, India is gearing up for the next step towards a less-cash economy. There has been a moderation in growth of currency in circulation, which has been confined to mostly below 10 per cent since August 2021. The value of cash withdrawals through the National Financial Switch (NFS) connected automated teller machines (ATMs) and Aadhaar enabled Payment System (AePS) also recorded a lower growth (5.1 per cent) in October 2022 than a year ago (7.2 per cent). The Reserve Bank recently released a concept note on India’s proposed Central Bank Digital Currency (CBDC) – the digital Rupee (e₹). The first pilot in the Digital Rupee – wholesale segment (e₹-W) commenced on November 1, 2022 with the use case- ‘settlement of secondary market transactions in government securities’.13 The use of e₹-W is expected to make the inter-bank market more efficient. Moving towards a regime of agile and harmonious FinTech regulation, the Inter-Regulatory Technical Group on FinTech has prepared a Standard Operating Procedure (SoP) for Inter-operable Regulatory Sandbox (IoRS). The IoRS will facilitate testing of innovative products/services falling in the regulatory ambit of multiple financial sector regulators viz., RBI, Securities and Exchange Board of India (SEBI), Insurance Regulatory and Development Authority (IRDAI), International Financial Services Centres Authority (IFSCA) and Pension Fund Regulatory and Development Authority (PFRDA). In November 2022, the Reserve Bank in collaboration with its regulated entities initiated a nation-wide customised consumer financial awareness programme with deeper outreach covering all segments of the population, especially those in rural and semi-urban areas. V. Conclusion As the pandemic looks like turning endemic and as the recovery gathers strength and traction, India is arriving on the world stage. On December 1, 2022 India will assume the mantle of the G20 Presidency for 2023. On November 8, 2022 the logo, theme and website of India’s G-20 Presidency was unveiled (Exhibit 1). Its caption वसुधैव कुटुम्बकम् – one earth, one family, one future – reflects the notion of a universal family, a symbol of hope in tough times. In India’s view, the striving for our progress envisions global progress in a unified world. Among other developments, India is reshoring and seeking control over strategic intermediates. The private sector is getting involved in an investment surge to create electronics factories and semiconductor fabs in India. This could bring in its train the rebasing of strategic manufacturing; the rise of a new energy system; and a comprehensive industrial policy, spanning everything from steel mills to software to electric vehicles (EVs), electronics, battery gigafactories, clean power and chips. India is also offering an alternative model of battling climate change. It is in the early stages of a green boom led by the private sector. In the past decade, India has seen a 50-fold increase in installed solar power. Renewables accounted for 8.5 per cent of its primary energy consumption, and 4 per cent of global renewable primary energy consumption. Tripling of non-fossil-fuel capacity by 2030 is envisaged. Behind the boom are a number of forces. Sun-drenched India has some of the cheapest solar power in the world, and the life-cycle cost of new plants is lower than for coal ones. Big local conglomerates are deploying capital at scale. Private firms have plans to invest $200 billion in the coming years in everything from generation facilities to green hydrogen plants (by comparison, global investment in wind and solar last year was about $370 billion, and India’s was roughly $15 billion). It may take over $500 billion of investment by 2030 in clean energy, transmission lines, grid-scale batteries and related kit to achieve the target of 500 giga watts by 2030.  On this note, we present to our readership the 25th edition of this article, The State of the Economy. We started in the shadow of the pandemic to infuse hope amidst the encircling gloom, to keep the nation informed of the many positives that marked our trials and tribulations imposed by the pandemic. We have traversed some distance, encountering on our path geopolitical hostilities, a multi-decadal inflation surge and a synchronised tightening of monetary policy not seen in years in terms of aggressiveness. Today, as the winds shift, the worst seems to be losing pace as we forge ahead.
|