by Michael Debabrata Patra, Asish Thomas George, G V Nadhanael, Joice John^ This paper attempts to provide a detailed analysis of the inflation trajectory in India post February 2022. We explore disaggregated data, sources of price pressures month to month, the distribution of inflation and its moments, and other statistical measures. Macro determinants of inflation are analysed through the lens of a Quarterly Projection Model (QPM). The results show that the initial inflationary surge was caused by successive supply shocks but as their impact wanes, the swing of price pressures from goods to contact-intensive services is generalising inflation and making it persistent. I. Introduction In March 2020 when COVID-19 was declared a pandemic, India experienced a once in a century cataclysm. The shock was amplified by the world’s strictest lockdown and arguably the biggest migration in human history as migrant workers fled cities in fear of what was then regarded as an urban disease. Directly as a consequence of this massive dislocation in the mobility of goods and services, inflation, which had been maintained in alignment with the target of 4 per cent during September 2016 through March 2020, broke out of the tolerable band and averaged 6.1 per cent in 2020-21.1 Monetary and fiscal policies went into ultra-accommodative pandemic-mitigation mode and strong supply side measures were unleashed to secure the availability of key inflation-sensitive food staples. As a result, inflation was pulled back into the tolerance band, averaging 5.5 per cent in 2021-22. With the worst of the pandemic’s two devastating waves having been weathered and unfavourable base effects being up to January 2022, the Monetary Policy Committee (MPC) in its meeting in February 2022 projected average inflation at 4.5 per cent during 2022-23 on ebbing COVID-19 infections, easing supply chain pressures, normal monsoons and global commodity prices moving in a range-bound manner. Little did it know that in a span of two weeks the world would be upended. The course of inflation the world over and in India was altered drastically (Das, 2022). The precipitation of geopolitical tensions into an outbreak of war in Ukraine completely overturned macroeconomic conditions. International prices of energy, industrial metals and food shot up to unprecedented highs and supply chain disruptions became acute, leading to escalation of cost pressures. inflation shot up across advanced and emerging economies to levels not seen in four decades. The shock waves spilled over and inflation in India slipped its pre-pandemic moorings, levitating to a peak of 7.8 per cent in April 2022 before easing to an average of 6.8 per cent during May-November 2022. This has triggered accountability procedures mandated by legislation whenever inflation breaches the upper/ lower tolerance bands around the target for three consecutive quarters (Chart 1).2 By current projections, inflation is forecast to average 6.7 per cent in 2022-23 and 5.2 per cent in the first half of 2023-24.3 What explains this unusual gravity defying, history defying inflation episode? This paper attempts to provide a detailed analysis of the inflation trajectory in India post February 2022. We explore disaggregated data, sources of price pressures month to month, the distribution of inflation and its moments, and statistical measures of diffusion and dispersion against the backdrop of the global and domestic macroeconomic setting. Our quest is for the fundamental factors that are shaping the inflation trajectory. 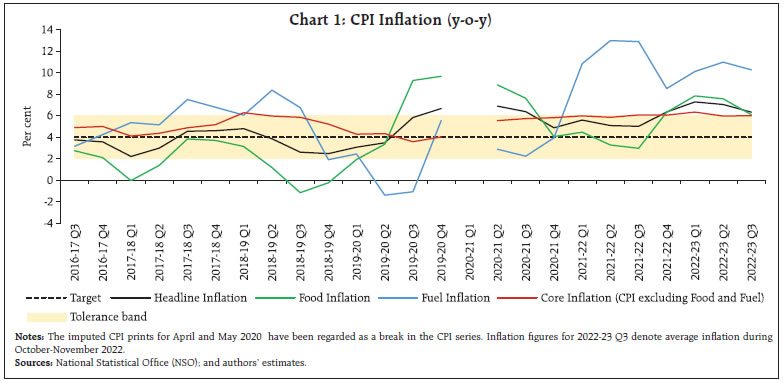 Our deep dive reveals that the initial inflationary shock was delivered by successive supply shocks, but as their impact waned, a revenge rebound in spending and especially a swing from goods to contact-intensive services, is generalising price pressures and making them persistent. Moreover, with food and fuel prices constituting 55 per cent of the consumer price index (CPI), households’ expectations of future inflation, which are influenced by recent movements in food and fuel prices, could also lead through cost of living considerations to higher wages and higher goods and service prices (Patra, 2022). The rest of the paper is organised into 5 sections. The next section disentangles the drivers and identify the proximate causes of the inflation surge. An examination of statistical properties of the distribution of inflation, including cyclical and acyclical components, is conducted in section III. Assimilating the inferences gathered from these analyses, Section IV explores the macro determinants of inflation. Section V concludes the paper. II. Some Stylised Facts First, the role of the basic blocks – momentum and base effects – in the formation of year on year (y-o-y) CPI inflation4 is examined. If the pick-up in inflation is driven by momentum, i.e., month-on-month (m-o-m) changes in the current period, it points to price pressures building up at the margin. On the other hand, if inflation is driven up by base effects (m-o-m changes in prices a year ago), the role of inflation’s history comes into play (Table 1). With the outbreak of the war in Ukraine, strong momentum was unleashed, which completely offset favourable base effects and drove inflation up to a peak in April 2022. Momentum eased in May, allowing the play of favourable base effects to bring down headline inflation from its April peak. Momentum eased further in June and stabilised in the ensuing months; however, favourable base effects waned from June and virtually disappeared in September. Accordingly, headline inflation averaged 7 per cent during May-September, moving in a range of (-)30 bps to (+) 40 bps around the average. In October, favourable base effects were so strong that they nullified a positive momentum and brought about a fall in headline inflation by 60 bps to 6.8 per cent, the largest since May 2022. In November, favourable base effects, along with a decline in momentum, pushed headline CPI inflation to 5.9 per cent - below the upper tolerance band for the first time in 2022. | Table 1: CPI inflation: Base Effect and Momentum | | (percentage points) | | No | Category | Dec-21 | Jan-22 | Feb-22 | Mar-22 | Apr-22 | May-22 | Jun-22 | Jul-22 | Aug-22 | Sep-22 | Oct-22 | Nov-22 | | 1 | CPI Headline Inflation (per cent) | 5.7 | 6.0 | 6.1 | 7.0 | 7.8 | 7.0 | 7.0 | 6.7 | 7.0 | 7.4 | 6.8 | 5.9 | | | 1a Change in Headline Inflation (1b+1c) | | 0.4 | 0.1 | 0.9 | 0.8 | -0.7 | 0.0 | -0.3 | 0.3 | 0.4 | -0.6 | -0.9 | | | 1b Momentum | | -0.3 | 0.2 | 1.0 | 1.4 | 0.9 | 0.5 | 0.5 | 0.5 | 0.6 | 0.8 | -0.1 | | | 1c Base Effect | | 0.6 | -0.2 | -0.1 | -0.6 | -1.6 | -0.6 | -0.7 | -0.2 | -0.2 | -1.4 | -0.7 | | 2 | CPI Food Inflation (per cent) | 4.5 | 5.6 | 5.9 | 7.5 | 8.1 | 7.8 | 7.6 | 6.7 | 7.6 | 8.4 | 7.1 | 5.1 | | | 2a Change in Food Inflation (2b+2c) | | 1.1 | 0.3 | 1.5 | 0.6 | -0.3 | -0.3 | -0.9 | 0.9 | 0.8 | -1.3 | -2.0 | | | 2b Momentum | | -1.1 | -0.1 | 1.3 | 1.4 | 1.5 | 0.9 | 0.1 | 0.7 | 0.9 | 1.0 | -0.7 | | | 2c Base Effect | | 2.1 | 0.4 | 0.1 | -0.8 | -1.7 | -1.2 | -0.9 | 0.1 | -0.1 | -2.3 | -1.2 | | 3 | CPI Fuel Inflation (per cent) | 11.0 | 9.3 | 8.7 | 7.5 | 10.7 | 9.5 | 10.1 | 11.8 | 10.8 | 10.4 | 9.9 | 10.6 | | | 3a Change in Fuel Inflation (3b+3c) | | -1.6 | -0.6 | -1.2 | 3.1 | -1.1 | 0.6 | 1.6 | -1.0 | -0.4 | -0.5 | 0.7 | | | 3b Momentum | | 0.1 | 0.9 | 0.9 | 3.0 | 1.4 | 0.8 | 2.0 | -0.4 | 0.4 | 0.6 | 0.4 | | | 3c Base Effect | | -1.6 | -1.5 | -2.0 | -0.1 | -2.4 | -0.3 | -0.6 | -0.4 | -0.7 | -1.0 | 0.2 | | 4 | CPI ex Food Fuel Inflation (per cent) | 6.1 | 6.0 | 5.8 | 6.4 | 7.1 | 5.9 | 6.0 | 6.0 | 5.9 | 6.0 | 6.0 | 6.0 | | | 4a Change in ex Food Fuel Inflation (4b+4c) | | -0.1 | -0.1 | 0.5 | 0.7 | -1.2 | 0.1 | 0.0 | -0.1 | 0.1 | 0.0 | 0.0 | | | 4b Momentum | | 0.4 | 0.5 | 0.6 | 1.2 | 0.4 | 0.1 | 0.6 | 0.4 | 0.3 | 0.6 | 0.4 | | | 4c Base Effect | | -0.5 | -0.6 | -0.1 | -0.5 | -1.5 | 0.0 | -0.7 | -0.5 | -0.2 | -0.6 | -0.4 | Note: Some numbers may not add up due to rounding.
Sources: NSO; and authors’ estimates. | Another important characteristic of this unique inflation experience is that momentum remained persistently positive for all the three major groups, viz., food, fuel and core (excluding food and fuel) during February-October 2022. By August, food became the dominant driver of headline price movements. In contrast, the momentum of fuel price changes ebbed and base effects remained favourable. The momentum of core price changes remained positive and volatile, overwhelming generally favourable base effects. In October, the core component registered a sharp pick-up in momentum, the largest since April 2022. These shifts are unusual in the history of inflation in India. In November, for the first time since January 2022, headline inflation fell below 6 per cent due to a sharp drop in vegetables prices, even as momentum in the fuel and core categories remained positive. Next, we look at the build-up of price pressures over successive months of the period under study in order to ascertain whether the evolving price momentum is persistent or transitory and what are the contributory factors. Although the accumulation of price pressures has been sustained across all the major groups, the pressure points turned out to be food and core. In fact, CPI core, where prices tend to be sticky, contributed substantially to the price build-up since March (Chart 2). The initial contributors to the food price build-up were cereals, edible oils, meat and fish. By May, milk and products joined these drivers, along with spices and prepared meals. Upside pressures were amplified by the waning of the effect of the usual seasonal moderation in vegetables prices. By August, there was a shift in drivers. Global edible oil prices registered a plunge, but the sustained price build-up in cereals, vegetables, milk and spices offset it. In November, a sharp drop in vegetables prices pulled the cumulative food price momentum downwards, even though almost all other major sub-groups registered further price increases. 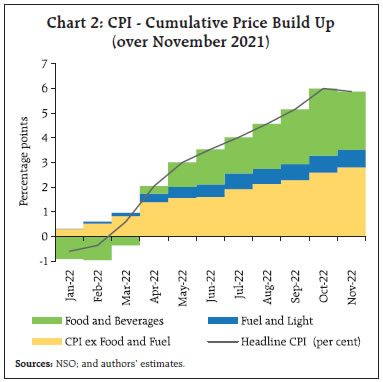 The loss of supply of sunflower oil from the Black Sea region triggered the initial increase in domestic edible oil prices. For other edible oils including palm oil, price pressures stemmed from export bans by principal producers in April-May5 (Chart 4). Cereals price pressures intensified with disruptions of wheat supplies from the Black sea region, which account for close to a third of global supplies. In India, its spillovers were felt through the channel of wheat exports. Protein prices picked up on the back of increases in feed cost prices, primarily due to harvest failures in Latin America but also accentuated by the loss of output due to the Ukraine conflict. Prepared meals prices also rose on account of increases in prices of key inputs like edible oils and transport costs.
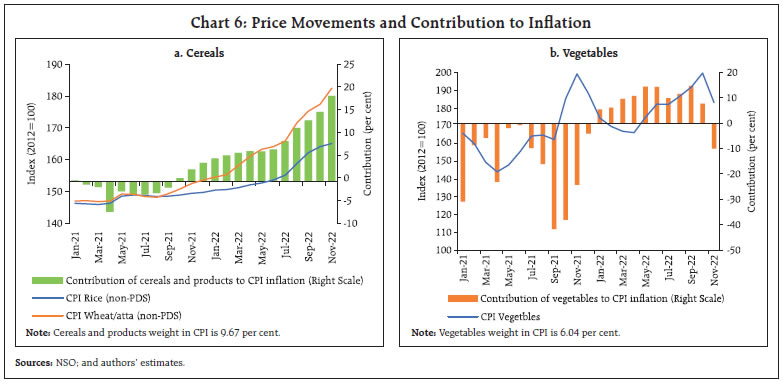
While a substantial part of inflation’s ascent in India was driven by external factors, supply disruptions in agriculture brought about by adverse weather conditions also contributed to the build-up of price pressures over successive months. First, the unprecedented heat wave conditions in March-May affected the production of wheat and vegetables. Second, even as the monsoon during the south-west season turned out to be normal at the all-India level, its spatial distribution was uneven. Rain-fed paddy grown in the Gangetic plains of Uttar Pradesh, West Bengal, Odisha and Bihar got affected adversely (Chart 5a). Third, the beginning of the paddy harvesting season saw intermittently intense rain spells, including in the retreating phase of the southwest monsoon in September-October (Chart 5b). This also drove spikes in prices of key vegetables like tomatoes. While the build-up in price pressures for cereals has been secular, vegetables prices have exhibited considerable volatility, which also got reflected in contributions to inflation (Chart 6a and b). In the case of fuel, the price build-up occurred predominantly through a sharp rise in kerosene prices along with a pick-up in LPG prices. From August, kerosene prices started to edge down in response to falling international prices (Chart 7). 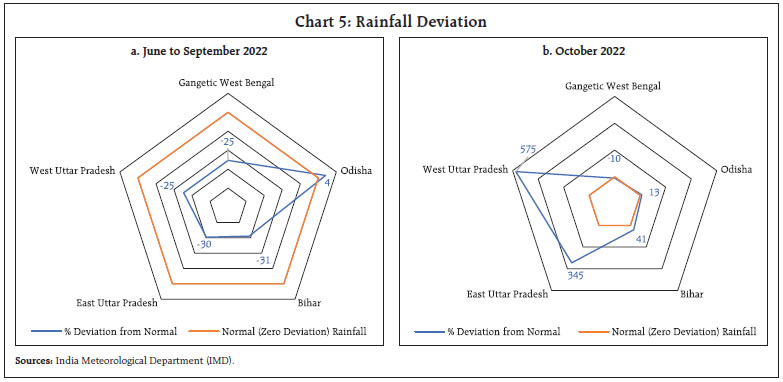
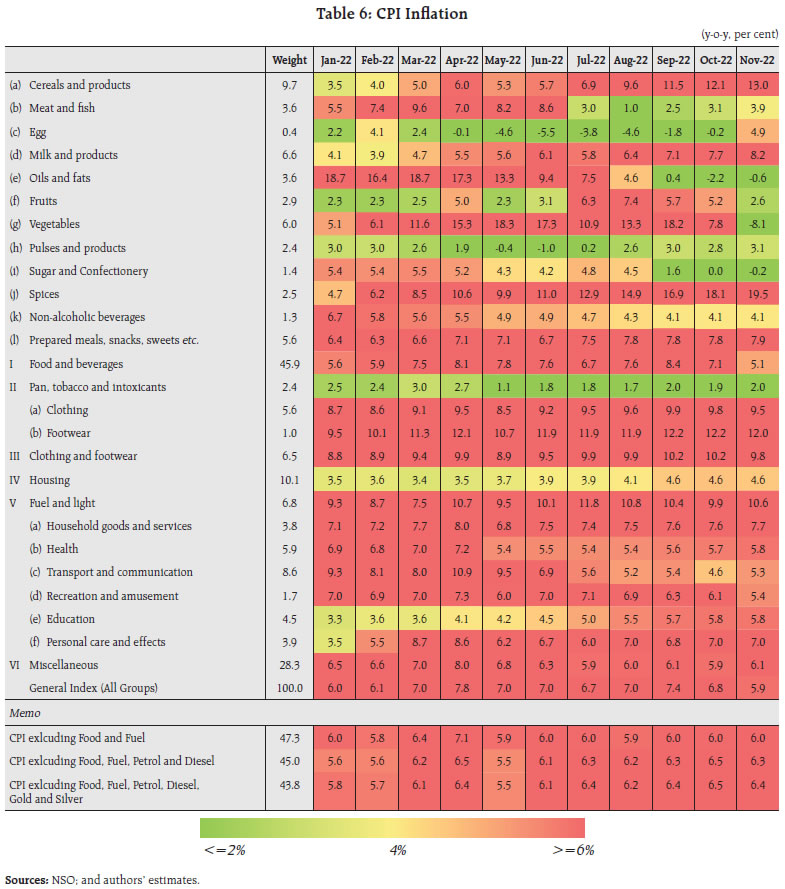
 The price build-up in the core category has been persistent across sub-constituents. In the initial months, the largest contributors were clothing, transportation and communication, and personal care and effects (Chart 8). Under transportation, the main driver was the increase in pump prices during March-April following the spike in crude oil prices since the start of the conflict. Between March 22 and April 6, 2022, petrol and diesel retail selling prices were increased by around ₹10 per litre in 14 revisions. By June, the impact of transportation waned as pump prices fell on a reduction in excise duties.6 Nevertheless, the second-round impact on transportation costs and fares sustained the price momentum in this category. Progressively, price pressures started to get broad-based covering clothing, household goods and services, personal care and effects, health, education and housing, i.e., 73 per cent of core CPI. 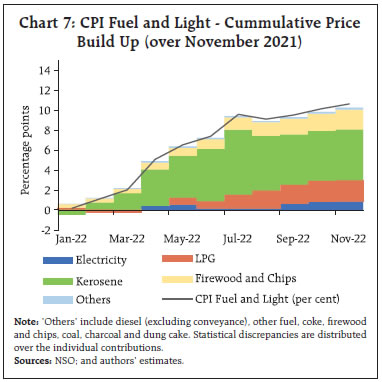 Thereafter, cost-push pressures faced by firms turned out to be the key driver of inflation and its stickiness. The war in Ukraine fueled a spike in global industrial input prices (including energy costs) over and above the cost pressures from disruptions in supply chains, and the surge in international commodity prices post lockdown (Chart 9 and Table 4). As firms started to pass cost pressures on to consumers, especially in respect of manufactured goods, it led to a pick-up in prices of fast moving consumer goods (FMCGs) and other consumer durables. Since early 2022, therefore, goods have been driving the inflation process. Services inflation lagged behind, especially on account of low house rent inflation and low pricing power of services sector firms (Table 5)7. As an explosive rebound in demand for services took hold subsequently, pricing power improved and translated into faster pass-through of high costs to services and the generalistion of inflation. As a result, most of the CPI sub-groups recorded inflation rates above 6 per cent during this period (Table 6). In fact, the cumulative weight of CPI items which recorded inflation in excess of 6 per cent went up successively barring a transitory moderation during May-July 2022 (Chart 10). A quiver plot of inflation captures the speed and direction of inflation pick-up/disinflation over time in the slope and direction of the inflation vector line.8 In the quiver plots of inflation movements, current month’s inflation is plotted on the y-axis and the previous month’s inflation is shown on the x-axis. The graph area of the quiver plot is divided into four quadrants segregated by whether or not the current/previous period inflation is in excess of 6 per cent. If inflationary pressures are transitory, inflation vector lines move rapidly from one quadrant to another. On the other hand, inflation persistence is indicated when the inflation vector lines remain largely in one quadrant over time. The movement of the inflation vector line into quadrant 1 (top left) indicates a build-up in inflationary pressures over the previous month (current inflation is higher than 6 per cent), while a movement into quadrant 2 (top right) denotes high inflation persistence (inflation more than 6 per cent in current and previous months). A movement into quadrant 3 (bottom right) denotes a progressive softening of inflation (current inflation lower than 6 per cent). Readings in quadrant 4 (bottom left) indicate lowering inflation pressures (inflation in current and previous months being lower than 6 per cent). | Table 4: Input Costs | | WPI | Weight | Jan-22 | Feb-22 | Mar-22 | Apr-22 | May-22 | Jun-22 | Jul-22 | Aug-22 | Sep-22 | Oct-22 | Nov-22 | | y-o-y (per cent) | | WPI Industrial Raw Materials | 17.5 | 25.9 | 25.2 | 25.7 | 27.9 | 34.6 | 32.7 | 28.2 | 22.7 | 19.6 | 16.4 | 12.5 | | WPI Farm Inputs | 9.5 | 24.6 | 22.6 | 22.7 | 26.9 | 38.2 | 41.7 | 39.7 | 33.5 | 32.0 | 25.6 | 22.4 | | m-o-m (per cent) | | WPI Industrial Raw Materials | 17.5 | 1.9 | 2.1 | 2.7 | 2.1 | 5.4 | 0.3 | -1.2 | -1.7 | -1.3 | -1.3 | 2.0 | | WPI Farm Inputs | 9.5 | 1.9 | 1.0 | 0.9 | 3.0 | 9.1 | 2.8 | 0.9 | -2.3 | 1.0 | -1.2 | 3.5 | | Sources: Office of the Economic Advisor (OEA), Government of India; and authors’ estimates. |
| Table 5: Goods and Services inflation | | (y-o-y, per cent) | | | Weight | Jan-22 | Feb-22 | Mar-22 | Apr-22 | May-22 | Jun-22 | Jul-22 | Aug-22 | Sep-22 | Oct-22 | Nov-22 | | Goods | 76.6 | 6.6 | 6.8 | 7.8 | 8.9 | 8.0 | 7.9 | 7.4 | 7.8 | 8.3 | 7.3 | 6.2 | | Core (CPI ex Food Fuel) Goods | 24.3 | 7.2 | 7.2 | 7.9 | 8.9 | 7.2 | 6.6 | 6.3 | 6.4 | 6.6 | 6.2 | 6.5 | | Services | 23.4 | 4.3 | 3.7 | 4.3 | 4.2 | 3.8 | 4.2 | 4.4 | 4.3 | 4.7 | 5.1 | 4.9 | | Education | 3.5 | 3.1 | 3.5 | 3.4 | 4.1 | 3.8 | 4.9 | 5.3 | 5.8 | 6.0 | 6.0 | 6.0 | | Housing | 10.1 | 3.6 | 3.6 | 3.4 | 3.5 | 3.5 | 3.9 | 3.9 | 4.1 | 4.6 | 4.6 | 4.6 | | Transport | 2.5 | 5.5 | 5.3 | 5.8 | 6.8 | 6.6 | 7.4 | 7.4 | 7.0 | 7.4 | 8.1 | 7.2 | | Medical | 1.8 | 5.6 | 5.5 | 5.8 | 6.1 | 4.9 | 4.8 | 5.0 | 5.0 | 5.1 | 5.1 | 5.2 | | Other Services | 5.5 | 5.3 | 2.5 | 5.3 | 3.8 | 2.7 | 2.7 | 3.0 | 2.3 | 2.6 | 3.8 | 3.7 | Note: ‘Other Services’ include grinding charges, household services, mobile and internet charges, recreation services and personal care services.
Sources: NSO; and authors’ estimates. |
 The quiver plots show that for headline inflation as well as its constituents, vector lines mostly stayed in quadrant 2 during February to October 2022, indicating high inflation persistence. In November 2022, the inflation vector line entered quadrant 3, mainly on account of a sharp decline in food inflation (Chart 11). Within food, vegetables inflation entered deep into quadrant 3 by November. For cereals, milk, spice and prepared meals, the vector lines moved into quadrant 2 over successive months (Annex A1). Continuing price pressures in sub-groups such as clothing, household goods and services, personal care and effects, education and housing imparted persistence to core inflation (Annex A2). III. Statistical Properties of the Recent inflation Experience What do the laws of motion say about this unprecedented inflation surge? The moments of inflation’s distribution are its mean or the first moment; standard deviation (SD) or the dispersion of the inflation rates around the mean, i.e., the second moment; skewness or the third moment, which measures the distance of the tails from the mean and looks at the impact of outlying high inflation rates influencing the mean; and kurtosis or the fourth moment, which indicates the extent to which the distribution has fat or thin tails relative to a normal distribution, or the role of extreme inflation events in sub-groups in explaining headline inflation variance (the second moment). 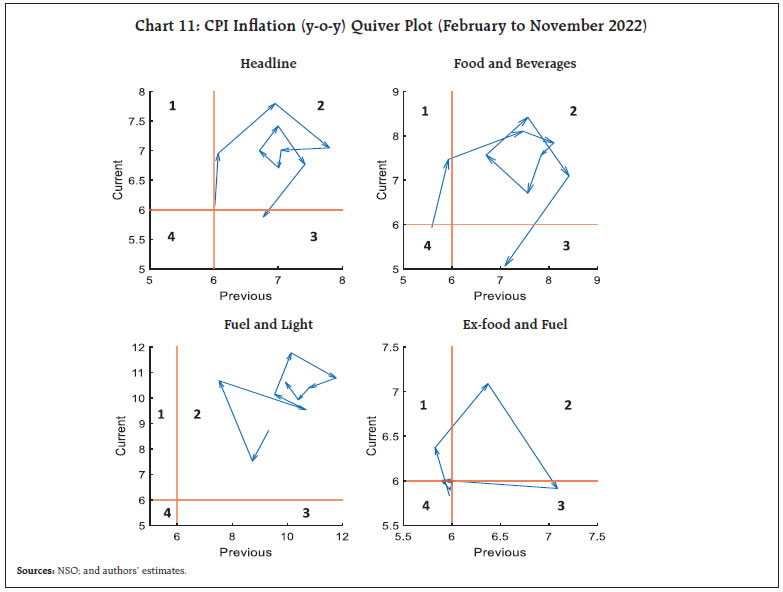
| Table 7: Moments of CPI inflation | | Category | Jan-22 | Feb-22 | Mar-22 | Apr-22 | May-22 | Jun-22 | Jul-22 | Aug-22 | Sep-22 | Oct-22 | Nov-22 | | CPI Headline Inflation (y-o-y) | 6.0 | 6.1 | 7.0 | 7.8 | 7.0 | 7.0 | 6.7 | 7.0 | 7.4 | 6.8 | 5.9 | | Standard Deviation | 3.3 | 2.8 | 3.4 | 3.7 | 4.0 | 3.7 | 2.9 | 3.3 | 4.3 | 3.7 | 5.3 | | Skewness | 1.9 | 1.6 | 1.4 | 0.7 | 1.0 | 0.9 | 0.1 | 0.3 | 0.9 | 0.3 | -0.5 | | Kurtosis | 7.7 | 6.9 | 6.1 | 3.1 | 4.8 | 5.3 | 3.3 | 3.1 | 3.7 | 4.2 | 4.6 | | Sources: NSO; and authors’ estimates. | These moments together point to a change in the inflation process since the onset of the war in Ukraine. High inflation before the war coexisted with a high positive skew, signaling the disproportionate role of outlying inflation rates on headline inflation. With the onset of the war, the distribution of inflation was characterised by high mean rates, sequentially lower positive skew and relatively lower kurtosis, indicating that a sizeable number of sub-groups experienced high inflation rates and influenced the headline inflation rate. In November, the inflation distribution exhibited negative skew, high standard deviation, increase in kurtosis and lower mean inflation rate (Table 7 and Chart 12). This indicates that although the direct effects of the shocks on headline inflation have started to wane, the second round effects induced by them are imparting persistence to headline inflation. A formal examination of generalisation of price pressures in CPI is attempted through diffusion measures. Diffusion indices measure the extent to which prices of items in the CPI basket increased in a cross sectional manner over time, adjusted for seasonal effects.9 CPI diffusion indices point to unrelenting price increases in a majority of items in the CPI basket during January-June 2022. The moderation in diffusion indices in July could not be sustained as price increases resumed across the CPI basket from August. Even with a softer headline inflation in November, diffusion indices edged up, indicating broadening of price increases (Chart 13a). 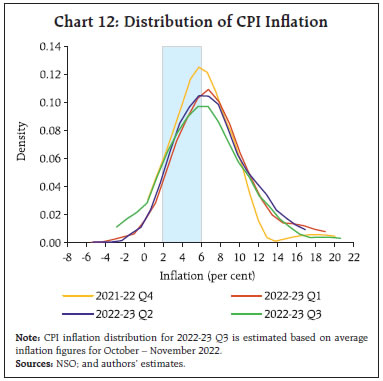
 The most striking aspect is the near universal increase in prices across categories at rates exceeding 4 per cent and 6 per cent. The spike in inflation to 7.8 per cent in April coincided with a large majority of core items registering price increases in excess of the seasonal adjusted annualised rate (SAAR) of 6 per cent. In November 2022, there was a pull-back in the disproportionately large number of items that registered price increases in excess of 4 per cent and 6 per cent (Chart 13b). A measure of relative price variability is used to identify whether inflation stems from concentrated price pressures in a few commodities, or it is a more generalised phenomenon. Following the tradition, our measure of relative price variability (RPV) is defined as: The initial spike in inflation was driven by supply shocks, but it got generalized thereafter as evident from the fall in RPV in recent months. In November, a rise in RPV along with a fall in inflation reflected the outsized impact of a few components (Chart 14). Cyclically sensitive inflation (CySI) measurement is intended to identify that part of CPI impacted by movements in economic cycles (Stock and Watson, 2020). This approach is designed to maximize the correlation between CySI and a measure of aggregate cyclical variation such as the output gap (Patra et al., 2021). CySI is a weighted average of the 23 sub-groups in CPI. A measure of acyclical inflation (aCySI) can be obtained by calculating the residual of headline inflation from the CySI. The estimation of CySI is as follows: The correlation of each of the 23 sub-group indices with the output gap measure is determined by estimating a Philips Curve (PC) like equation: The parameters and time-varying volatility are estimated by using the Bayesian Markov Chain Monte Carlo (MCMC) method on quarterly data from Q1:2011 to Q1:2022. The convergence diagnostics are found to be satisfactory. Education, housing, prepared meals, fuel and light, cereals, milk, household goods and clothing have notable weights in CySI. These goods and services have prices that are mostly determined in domestic markets and are less affected by weather changes at least over the past decade. On the other hand, sub-groups like transport and communication, oils and fats, and personal care and effects imbibe a large international influence. They get zero or negligible weights in the CySI. Most of the other food groups like vegetables and fruits, which are affected by supply and influenced by climatic changes, also enter CySI with negligible weights. During the pandemic period (since Q1 of 2020 up to Q2 2021), CySI has remained persistently lower than aCySI, indicating that the supply disruptions were determining headline inflation, not demand factors. The aCySI-CySI gap closed in the second half of 2021, but widened after February 2022 (Chart 15a). Supply shocks driving the acyclical component of inflation were the principal contributors to the ascent of inflation (Chart 15b). On a note of caution, the contribution of CySI to headline inflation seem to be rising in recent months, narrowing the gap between aCySI and CySI till it turned negative since October 2022. The generalisation of inflationary pressures that is being flashed indicates the increasing role of demand pull, warranting monetary policy action to combat second-round effects. IV. Bringing It All Together The examination of the latent drivers of inflation’s ascent point to the conclusion that inflation surging above the upper tolerance band of the target was kick-started by a series of supply shocks, induced first by COVID-19 and then followed up by the war in Ukraine and weather-related uncertainties. How some of these shocks led to generalisation and persistence in inflation thereafter deserves focus. All those are assimilated into a macro model to identify the inter-temporal determinants of inflation, using the Reserve Bank of India’s (RBI’s) Quarterly Projection Model (QPM). The QPM belongs to the genre of consensus macroeconomic New Keynesian open economy structural models (Benes et al., 2016 & RBI, 2021). Drawing on this tradition, it consists of 1) an aggregate demand equation; 2) an expectations augmented Philips curve; 3) a monetary policy rule; and 4) an external block for the determination of exchange rates. A defining feature is the focus on nominal rigidities in price/wage settings and in mark-ups, providing monetary policy the exploitable trade-off to affect goal variables like output and inflation. Trend variables like potential output are assumed to be supply-driven and are, therefore, exogenous to the model. inflation is a result of deviations of aggregate demand from its underlying trend. In India, the prominence of food and fuel in the consumption basket amplifies the dominance of supply-side shocks and spillovers to the formation of overall inflation. Therefore, such country-specific characteristics are incorporated into the QPM, enabling gains in empirical regularity. It embeds many India-specific features like the behaviour of different inflation components and their interlinkages, sluggishness in monetary policy transmission, the predominance of the bank lending channel, central bank credibility, monetary-fiscal linkages, fuel pricing, capital flow management and exchange rate dynamics. The historical decomposition (HD) of headline inflation in the QPM helps to understand the key macro contributors to inflation’s ascent during the period of study (Chart 16). In Q4 of 2021-22, inflation averaged 6.3 per cent. COVID-19 induced supply disruptions and their impact on core inflation accounted for more than half of the rise in inflation above the target. Food price shocks contributed around 22 per cent and exchange rate pass-through contributed 16 per cent. The war in Ukraine and the weather-related disturbances accentuated supply side shocks in Q1 of 2022-23, pushing inflation up to 7.3 per cent. Fuel price (including petrol and diesel) shocks contributed 39 per cent to the deviation of headline inflation from the target. The shocks emanating from weather-related events and the Ukraine war led to food price shocks, which contributed 33 per cent. Exchange rate pass-through continued to contribute 16 per cent. In Q2 of 2022-23, inflation declined, but averaged 7 per cent. Food shocks tapered off primarily due to supply interventions such as reduction in import duties for edible oils; restriction on exports, especially wheat; and other supply side measures covering key vegetables and pulses. Fuel price shocks continued to contribute 33 per cent of inflation’s deviation from its target. With synchronised monetary policy tightening across the world, the contribution of exchange rate passthrough increased to 29 per cent. The second-round effects of commodity prices on core inflation contributed almost a third of inflation’s deviation from its target. Conclusion The foregoing analysis highlights the pre-dominant role of supply-side shocks in pushing up headline inflation above the upper tolerance band. What started as a shock to food and fuel prices got increasingly generalised over ensuing months. This was reflected in highly elevated and sticky core inflation. Unprecedented input cost pressures got translated to output prices, particularly goods prices, in spite of muted demand conditions and pricing power. As the direct effects of the conflict waned and international commodity prices softened, the strengthening domestic recovery and rising demand enabled pass-through of pent-up input costs, especially in services, adding persistence to elevated inflationary pressures. References: Benes, J., K. Clinton, A. George, P. Gupta, J. John, O. Kamenik, D. Laxton, P. Mitra, G. Nadhanael, R. Portillo, H. Wang, and F. Zhang (2016), “Quarterly Projection Model for India: Key Elements and Properties”, RBI Working Paper Series No. 8. Das, Shaktikanta (2022), “Globalisation of inflation and Conduct of Monetary Policy”, Governor’s speech delivered at the Kautilya Economic Conclave, organised by Institute of Economic Growth in New Delhi, July 9, 2022. Fischer, Stanley, Robert E. Hall, and John B. Taylor (1981), “Relative shocks, relative price variability, and inflation.” Brookings Papers on Economic Activity 381-441. Patra, Michael Debabrata (2022), “Geopolitical Spillovers and the Indian Economy”, Keynote address at the PhD Chamber of Commerce and Industry, New Delhi, June 24. Patra, Michael Debabrata & Behera, Harendra & John, Joice (2021), “Is the Phillips Curve in India Dead, Inert and Stirring to Life or Alive and Well?”, RBI Bulletin, November. Patra, Michael Debabrata & Khundrakpam, Jeevan Kumar & George, Asish Thomas (2014), “Post-Global Crisis inflation Dynamics in India: What has changed?” India Policy Forum, National Council of Applied Economic Research, vol. 10(1), pages 117-203. RBI (2021), “Quarterly Projection Model 2.0”, Box I.1, Chapter 1 - Macroeconomic Outlook, Monetary Policy Report, Reserve Bank of India, April. RBI (2022), “Prices and Cost”, Chapter 2, Monetary Policy Report, Reserve Bank of India, September. Stock, James H., and Mark W. Watson (2020), “Slack and cyclically sensitive inflation.” Journal of Money, Credit and Banking 393-428.
Annex
|