by Dhirendra Gajbhiye^, Rashika Arora^,
Arham Nahar#, Rigzen Yangdol^,
Ishu Thakur^ India’s ingeniously developed tech stack helped in building a resilient digital economy and attracted considerable global attention. However, lack of credible estimates on digital economy’s size and employment generation hampers evidence-based policy making. This article tries to fill that void by estimating India’s digital economy using input-output statistics. Major findings of the paper reveal that (i) India’s core digital economy increased from 5.4 per cent of GVA in 2014 to 8.5 per cent in 2019, with digitally dependent economy hovering around 22 per cent in 2019; (ii) India’s digital economy grew 2.4 times faster than the Indian economy, with strong forward linkages to non-digital sectors; (iii) digital output multiplier has increased over time, highlighting the role of investments to drive growth and (iv) 62.4 million (11.6 per cent) workers are employed in digitally dependent economy. Introduction The world is at the cusp of the digital revolution as digital technologies are steadfastly transforming lives and livelihoods. Digitalisation has facilitated a faster recovery of economic activity from the pandemic and will remain crucial for countries to build resilience in the future. G20 Digital Economy Development and Cooperation Initiative (2016), acknowledged digitalisation as a driver of global inclusive economic growth, enhancing productivity of existing industries. Moreover, pro-active policy support for faster adoption of frontier technologies1 is gaining momentum to fast pace the growth process. The term Digital Economy, first coined in the 1990s has expanded in consonance with the rapidly changing nature of technology to include a wider connotation of digital technologies, products and services across a wide spectrum of sectors. Its multidimensional nature has brought serious definitional challenges among academicians, compilers and policymakers. However, a consensus is gradually emerging but the lack of official statistics limits credibility. A narrow view restricts the digital economy to online platforms and the activities enabled by them, whereas a broad view encompasses all activities that use digitised data as a part of the digital economy (IMF, 2018). Joint collaborative research by Huawei and Oxford Economics pegged the size of the global digital economy to be around USD 11 trillion i.e., 15.5 per cent of global gross domestic product (GDP), which is expected to reach USD 23 trillion (24.3 per cent of global GDP) by 2025. As the impact of digital goods and services on a country’s economic growth seems to be growing, particularly after the pandemic shock, it is important to develop a robust framework, especially for a country like India, where the digital economy is steadily penetrating all sectors of the economy. The explosive growth of technological enablers in India over the last decade, including telecom and smartphone penetration, fast and low-cost internet services, technology-facilitated access to credit, and efficient and inclusive payment systems, make it pivotal to understand the evolution of digitalisation relative to the overall economy and its impact on economic activity and employment. Credible estimates of India’s digital economy would be crucial for evidence-based policymaking. Identification of backward and forward linkages of digital sector with non-digital sector, and estimating the multiplier effect of digital sector vis-à-vis non digital sector will aid proactive policymaking in the quest for leapfrogging convergence. A better understanding of digitalisation’s effect on the economy will assist analysis of evolution of technological progress, future growth, international trade, inflation dynamics, and transmission of shocks. Further, leveraging digital technologies becomes crucial to achieve the vision of becoming a developed economy by 2047. Against this background, the motivation of the article is threefold, (i) to measure the size of India’s digital economy using Input-Output tables; (ii) provide multipliers estimates for digital and non-digital economy; and (iii) provide estimates on the employment generation by the digital economy. The article is organised into five sections. Section II presents a review of relevant literature on various measurement aspects related to the digital economy. Section III covers the research methodology. Empirical findings are discussed in section IV and section V concludes the article with some policy suggestions. II. Literature Review OECD (2020) developed a comprehensive approach to estimate the share of the digital economy using exposure to Information and Communication Technology (ICT) sector based on relevant International Standard Industrial Classification (ISIC). The Bureau of Economic Analysis (BEA) used input-output tables (IOTs) to estimate the digital economy’s contribution to USA’s GDP (1997). Kumar and Ghosh (2019) estimated the size of India’s digital economy based on the ICT sector using National Industrial Classification to be around 6.7 per cent of India’s economy during 2011-12 to 2017-18. Dynan & Sheiner (2018), while defining GDP as a close measure of welfare, concede its failure to capture welfare as well as the digital economy. The core problem identified was the inability to capture goods available at zero or negligible marginal cost in the national accounts, with huge overall productivity and welfare gains associated with their consumption. Brynjolfsson et al. (2019) developed a new metric ‘GDP-B’ to quantify the value of goods and services provided free of cost by estimating values of willingness to accept for giving up access to goods or services concluding that annual GDP growth rates were higher by 0.05 to 0.11 percentage points per year from 2004. Supply-use tables have been utilised to estimate the digital economy by Ahmad and Ribarsky (2018), Barefoot et al. (2018). Mitchell (2018) proposed a standard framework using digital supply-use tables (SUTs) to estimate a comprehensive digital satellite account. Moulton et al. (2022) present estimates of digital industries for five economies using SUTs to conclude that the gross value added of digital industries ranges from 4.4 to 10.2 per cent of total GVA. In a more recent attempt to define and measure the digital economy, Asian Development Bank (ADB) proposed a comprehensive framework principally sourced from the national SUTs and IOTs (ADB, 2021). The estimated share of digital economy for 16 economies was found in the range of 2 to 9 per cent of the total GDP for the period 2004 to 2019. Using multi-regional IOTs, the global digital economy is estimated at 8.8 per cent of global GDP. ADB’s approach is considered appropriate for this study as it is practical and statistically informative with the use of secondary data sources. III. Data and Methodology III.1 Definition of Digital Economy OECD describes Digital Economy as an “association of tiers incorporating complementary and mutually dependent elements and perspectives of digitisation in the economy”. It proposes five tiers underpinning the various proposed definitions of the digital economy (Table 1). ADB (2021) defined digital economy as the contribution of economic transactions that involve both digital products and digital industries to Gross Domestic Product (or Gross Value Added, GVA). Digital products are the goods and services that primarily generate, process, and/or store digitised data. Digital industries are producers that primarily produce such products. The framework identifies core digital products which are classified under the following five product groups: (a) hardware, (b) software publishing, (c) web publishing, (d) telecommunications services, and (e) specialised and support services. Digital products and industries are identified from international industry and product classification systems – the International Standard Industrial Classification System (ISIC Rev. 4) and the Central Product Classification System (CPC 2.1), which are used to construct official economic statistics (Annexure 1: Tables A1.2 and A1.3). Components and accessories that support digital goods and services and may be important inputs into production, referred to as “digitally enabling products” are not considered to be core digital products but are captured through backward linkages in the core digital economy. Similarly, products that utilise digital products as inputs, “Digitally enabled products” are not considered to be a part of the core digital economy. | Table 1: Tiers of Digital Economy | | 1 | Core Measure | Economic activity from ICT goods and digital services producers | | 2 | Narrow Measure | Core measure + economic activity from firms reliant on digital inputs | | 3 | Broad Measure | Narrow measure + economic activity from firms significantly enhanced by the utilisation of digital inputs | | 4 | Digital Society | Broad measure + digitalised interactions and activities, e.g. use of digital platforms | | 5 | Digitally ordered and/or delivered | Ordering and delivering methods of digital economy | | Source: Report for the G20 Digital Task Force (OECD). | III.2 Measurement of Digital Economy This article uses the approach followed by ADB using national IOTs to measure the size of the digital economy. The method is grounded in input-output analysis using Leontief coefficients, and linkages to capture sector dependencies (Chart 1). Derivation of the digital GVA is discussed in Annexure 1. GVA (at basic prices) attributable to the digital economy is calculated using the following equation:
| Table 2: Two Industry Economy | | Industry | I | II | Final Demand | Gross Output | | I | z11 | z12 | f1 | x1 | | II | z22 | z22 | f2 | x2 | | GVA | gva1 | gva2 | | | | Gross Output | x1 | x2 | | | Based on the level of industry disaggregation presented in the IOT (refer Annexure 1), industry and product classification needs to be evaluated to disaggregate the data. For example, suppose there is a 2 x 2 IOT (Table 2). Industry I is supposed to be a partially digital sector (with both digital and non-digital subsectors). This industry needs to be disaggregated into two sub-industries. Following ADB (2021), a disaggregation ratio is calculated using a ratio of digital activity (estimated) to the activity of the aggregate industry. The disaggregation ratio is calculated as the proportion of estimated digital activity from the aggregate industry activity. This ratio is calculated by estimating the revenue shares of the sub-industries. The revenue shares are multiplied to values in both columns and rows corresponding to the aggregate industry in the IOT. In the example, let α be the share of digital industry Ia to Industry I’s total revenue, and β be the share of non-digital Industry Ib to Industry I’s total revenue, α + β = 1, a disaggregated 3 X 3 IOT is obtained (Table 3). | Table 3: Two Industry Economy with partially digital sectors | | Industry | Ia | Ib | II | Final Demand | Gross Output | | Ia | ααz11 | αβz11 | αz12 | αf1 | αx1 | | Ib | βαz11 | ββz11 | βz12 | βf1 | βx1 | | II | αz21 | βz21 | z22 | f2 | x2 | | GVA | αgva1 | βgva1 | gva2 | | | | Gross Output | αx1 | βx1 | x2 | | | III.3 Employment in the Digital Economy Employment in the core digital sector and employment in the broader spectrum of digitally enabled sectors comprise employment in the digital economy (ADB 2016, UNCTAD 2019b; OECD 2016). III.4 Data The study uses India’s National Input Output Table (NIOT) for the years 2014 and 2019 taken from the Asian Development Bank. The NIOT is a 35 X 35 sector IOT (Annexure 1 and Table A1.1). Partially digital sectors are identified following the definition of the digital products and industries introduced earlier. Revenue shares are derived using Net sales of companies on ProwessIQ published by the Centre for Monitoring Indian Economy (CMIE) and total output of manufacturing units in the Annual Survey of Industries (ASI) published by the Ministry of Statistics and Programme Implementation (MoSPI). For the computation of employment in the digital economy, PREDICT database 2022 for India is also used. Digital sector employment is defined as employment in the ICT sectors (Mas, et al., 2018). Further, core digital sector employment is defined as employment in ICT sectors, while employment in digitally enabled sectors comprises media content and retail sales. Further, shares of distribution of the workforce in the Periodic Labour Force Survey (PLFS) 2019-20 (MOSPI) were used to estimate employment in the digital economy as defined in the ADB framework (ADB, 2021). IV. Empirical Findings Following ADB’s (2021) framework, the following NIOT sectors were identified as digital sectors (Chart 2). The sectors are split into two sub-sectors to segregate the digital subsectors. This would give us a 38-sector NIOT for India for the years 2014 and 2019. IV.1 Digital Economy Estimates The equation above summarises the methodology of the framework and is applied to the Indian economy’s IO tables to obtain digital economy estimates for India. GVA(digital) as a percentage of total GVA has been estimated for the years 2014 and 2019 at both current and constant prices. In terms of current prices, the size of the digital economy as a percentage of GVA has increased from 5.40 per cent in 2014 to 8.49 per cent in 2019 (Chart 3). In absolute terms, the size of the digital economy has grown from US$ 107.7 billion in 2014 to US$ 222.5 billion in 2019 (Table 4). In absolute US dollar terms, India’s digital economy exhibited a growth rate (compounded annually, CAGR) of 15.62 per cent between 2014 and 2019, while India’s economy (GVA) grew annually at a compound rate of 6.59 per cent (as per ADB’s IO tables). This shows that India’s digital economy grew 2.4 times faster than the Indian economy itself. The CAGR of digital GVA as a percentage of GVA is a normalised measure of annual growth. India posted a growth rate of 9.47 per cent. This again suggests that the digital economy GVA for India grew at a rate faster than the economy-wide GVA between 2014 and 2019 (Chart 4). IV.1.1 Digital Economy as a Supplier and User of Goods and Services To understand the role of the digital economy as a supplier and a user of goods and services, an analysis of linkages (forward and backward) is undertaken. Chart 5 disaggregates the three terms that constitute the core digital economy for 2014 and 2019. | Table 4: Size of the Digital Economy | | Year | Size (US$ bn) | Share (%) | | 2014 | 107.7 | 5.40 | | 2019 | 222.5 | 8.49 | | Source: Authors’ calculations based on Input-Output framework. |
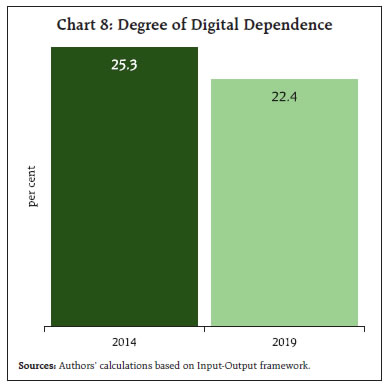
As the chart shows, a major proportion of the digital GVA for India is attributed to forward linkages, implying that the digital economy majorly acts as a supplier of value-added to the non-digital sectors. The digital sector contributes around 28 per cent of its own value added (the double-counted term). IV.1.2 Digital Subsectors Following the definitions, the digital economy is comprised of three subsectors – (i) computer, electronics, and optical products; (ii) telecommunications; (iii) computer and ICT services (Chart 6). The computer and ICT services sector constitutes a substantial share of India’s digital economy, followed by the telecommunications subsector (Chart 6a). The hardware industry of computer, electronics, and optical products contributes to only 0.1 per cent of India’s GVA. Both computer and ICT services and Telecommunications have a major proportion of the sectors’ GVA attributed to forward linkages, as they take supply-side roles in the economy. On the other hand, the hardware sector has a greater fraction of its GVA contributed by backward linkages, acting as a utiliser of value-added from non-digital sectors (Chart 6b). This explains why the digital economy of India takes a supply-side role, where the forward linkages of the digital economy are greater than the backward linkages. IV.1.3 Digitally Enabled Sectors The industries with the highest forward linkages from the aggregate core digital economy in 2019 are construction, renting of machinery and equipment, food beverages and tobacco, textiles and textile products, and electrical and optical equipment (Chart 7). IV.1.4 Digitally Disrupted Sectors Prominent digital innovations that challenge the existence of dominant firms and have systemic effects in industries and markets are referred to as digital disruption (Skog et al., 2018). The Advisory Expert Group on National Accounts (2019)2 identifies 10 sectors that are getting digitally disrupted. Digital disruption alters a sector’s landscape, changing how businesses operate traditionally. The disruptions force industries to adapt or risk becoming irrelevant, acting as a major cause of fundamental creative destruction (Table 5). To obtain an estimate of the digitally dependent economy, ADB’s (2021) framework is applied to the identified digital sectors and digitally disrupted sectors (assumed to be 100 per cent digitally disrupted). Around 22.4 per cent of the Indian economy was digitally dependent in 2019 (around US$ 0.6 trillion) (Chart 8). IV.1.5 Digital Multiplier Analysis In this section, the role of the core digital sector is examined from the demand-side perspective. Multipliers help in comprehending the impact of a unit change in the final demand (exogenous demand shock) for digital sector output on the gross output or value-added of an economy. | Table 5: Digitally Disrupted Sectors | | Code | Description | | 49 | Land transport services and transport services via pipelines | | 55 | Accommodation services | | 56 | Food and Beverage serving services | | 58 | Publishing services | | 59 | Motion picture, video, and television programme production services, sound recording and music publishing | | K | Financial and insurance services | | 73 | Advertising and market research services | | 79 | Travel agency, tour operator, and other reservation services | | P | Education services | | 92 | Gambling and betting services | | Sources: The Advisory Expert Group on National Accounts (2019), ADB (2021). |
 A simple output multiplier shows the direct and indirect impact of a unit change in final demand on the economy’s total output. We compare the output multiplier for digital and non-digital sectors, to compare the effect of an increase in final demand for these sectors. The manufacturing of computers, electronics, and optical products was found to have a lower output multiplier for 2019 as compared to 2014, indicating an increase in dependence on imported inputs (external economy). The output multiplier value of 1.96 means that a US$ 1 increase in demand for computer products leads to around double the value increase in gross output of the sector. The telecommunications and ICT services sectors saw an increase in domestic output multipliers. An increase of US$ 1 in demand for telecom services leads to a US$ 1.77 increase in gross output. Computer and ICT services generated an output multiplier of 1.37 per US$ 1 increase in demand (Chart 9). The value-added multiplier captures the value created in an economy, which is the net of gross output and intermediate consumption, caused by a unit change in final demand. Lower value-added multipliers for the digital sectors in 2019 show higher vertical integration of the domestic sector to foreign sectors (ADB, 2021) (Chart 10). IV.1.6 Digital and Non-Digital Output Multipliers Next, we compare the digital output multiplier against the non-digital output multiplier for both periods to explore the digital sector’s importance in output growth. It is observed that the output multiplier (for constant price IOT) for the digital sector has increased over the period under consideration from 1.35 to 1.52, as opposed to that of non-digital sector. This indicates that a US$1 increase in final demand for digital sectors would lead to an increase of US$1.5 increase in the output of this sector in 2019 (Chart 11).
IV.1.7 Digital Economy Estimates at Constant Prices Input-output analyses are generally conducted using tables based on current prices, as the application of the model is static (lack of time dimension). Thus, there is less concern about price changes as compared to other considerations like an aggregation of sectors or products, representativeness, the scope of analysis, etc. Further, constructing constant-price tables becomes unfeasible because of the requirement for data on price indices, rebalancing, etc. As against the previous analysis conducted using India’s IOT in current prices, this section explores the ‘real’ change in levels and trends, i.e., volume changes, to remove the price effects from IOTs. From a dynamic perspective, the size of India’s digital GVA as a percentage of economy-wide GVA has increased from 5.08 per cent in 2014 to 8.58 per cent in 2019, with a compound annual growth rate of 17.47 per cent, in contrast with 15.62 per cent CAGR in value terms. This difference can be attributed to a fall in prices and productivity growth within digital sectors (Charts 12 and 13). IV.2 Employment in the Digital Economy Attempts to estimate employment in the IT sector are often used as a proxy for employment in the digital sector. As per Invest India, the information technology/business process management (IT-BPM) sector is estimated to contribute to 4.8 million full-time employees in FY2022, increasing by 7.5 per cent from 4.4 million in FY2021. Including indirect jobs created by the sector, total employment was estimated at 8 million (TeamLease, 2021). Naukri JobSpeak Index which tracks monthly job listings in the organised corporate sector3 recorded a five-fold increase in job postings in the IT Software Services from the baseline index of July 2008. As per NASSCOM, the total technology industry workforce is projected to cross 5 million in FY 2022, with 1 in 3 workers being digitally skilled. Digital platforms have facilitated the creation of a ‘gig economy’ that provides the benefits of novel and flexible employment but comes with an overriding concern of uncertain terms of employment. NITI Aayog (2022) estimated 6.8 million gig workers4 in 2019-20, up from 2.5 million in 2011-12, and projected 7.7 million gig workers in 2020-21, constituting about 1.3 per cent of the total workers. The digital economy could generate around 60-65 million employment opportunities by 2025, with substantial redeployment (MEITY, 2019). 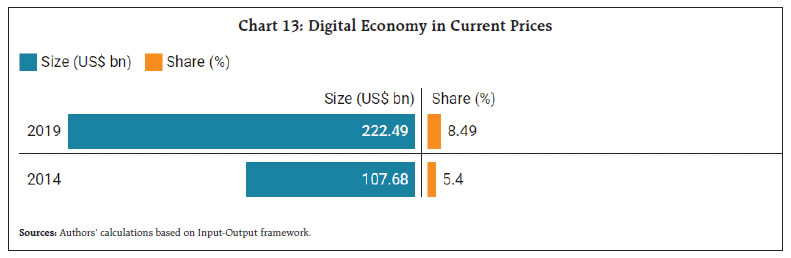 Using PREDICT Database: The core digital sector identified by the European Commission’s Prospective Insights on R&D and ICT (PREDICT) 2022 database (Table 6) was estimated to employ about 7.5 million people in India, in 2019. Including the digitally enabled media content MC sector, the total employed increased to 7.8 million. The ICT sector employment has nearly doubled in the last decade, increasing from 4.0 million in 2009 (2009–2019 CAGR of 5.75%). A ten-year comparison reveals employment to have increased by 78.7 per cent in the core digital sector and by 16.3 per cent in the digitally enabled MC sector (Chart 14). Table 6: List of NACE Rev. 2 ICT sub-sectors.
Operational Definition | | NACE Rev.2 | Description | | 261-264, 582,61,62,631,951 | ICT total (operational) | | 261-264 | ICT Manufacturing industries (operational) | | 261 | Manufacture of electronic components and boards | | 262 | Manufacture of computers and peripheral equipment | | 263 | Manufacture of communication equipment | | 264 | Manufacture of consumer electronics | | 582, 61, 62, 631, 951 | ICT Service industries | | 61 | Telecommunications | | 582, 62, 631, 951 | Computer and related activities | | Source: (Mas, et al., 2018). | Based on the ADB framework, PLFS share distribution of the workforce was used to capture employment in the digital economy (ADB, 2021). The five main product groupings identified provide a lower bound of estimation of employment in the digital sector. The core digital sector accounted for 0.92 per cent of total employed workers in 2019-20 (Annexure 2). Using the current population of India5 as on May 26, 2022, and the worker population ratio in 2019-20 as per PLFS (at 38.2 per cent), the total employed in the core digital economy (0.92 per cent) was estimated at 4.9 million people. Within the six digital sectors6, the highest share of employment was recorded in divisions of Computer Programming, Consultancy and Related Activities (59.8 per cent), followed by Telecommunication (15.2 per cent) (Chart 15). 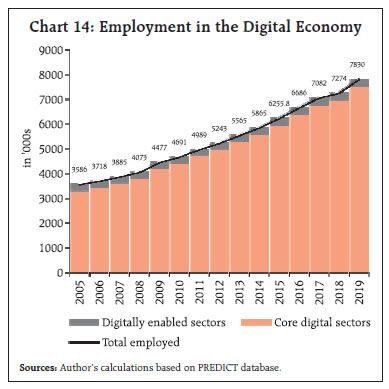
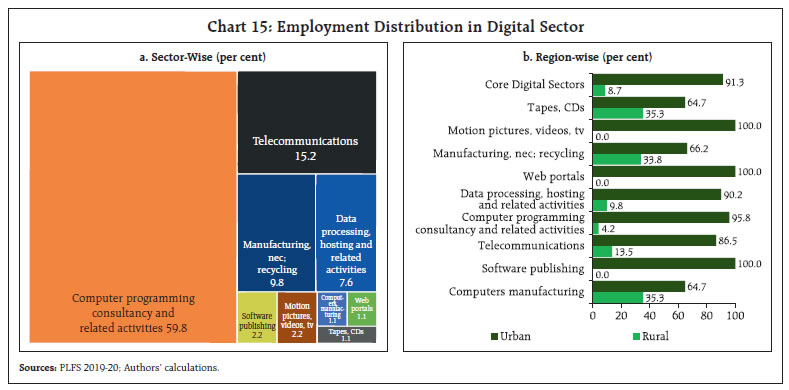 Regional analysis reveals core digital sector employment to be concentrated in urban areas, which accounts for 91.3 per cent of total employment. Production in activities of manufacture of computers, production of tapes and CDs and other manufacturing n.e.c7, have a significant rural presence, while web portals and motion pictures activities have nil employment in the rural sector (Chart 15a). By gender, male workers make up about 73.4 per cent of total employed in the core digital sector. Sub-sectoral activity in manufacturing n.e.c. and software publishing have a higher gender parity in work participation (Chart 15b). The Advisory Expert Group on National Accounts (2019) classification of 10 increasingly digitally disrupted sectors, account for 10.7 per cent of the total workforce employed in the economy, implying one-tenth of the workforce is in digitally disrupted sectors, with land transport services, transport services via pipelines and education services having the highest distribution of workforce (Chart 16). Including the employed in core digital sectors, about 11.6 per cent of the total workforce is involved in the overall digital economy. Using current population estimates, these workers are estimated at 62.4 million. V. Conclusion This article attempts to measure the size of India’s digital economy and how it interacts with other non-digital sectors of the economy utilising the available national input-output statistics, based on the already existing categorisation of economic activities. Following ADB’s (2021) framework, the core digital economy is estimated to be 5.40 per cent (US$ 0.11 trillion) of Indian economy’s overall GVA in 2014 (US$ 1.99 trillion), which increased by more than 15 per cent annually in absolute terms to contribute to 8.5 per cent (US$ 0.22 trillion) of economy’s GVA in 2019 (US$ 2.62 trillion). Our estimates are broadly in line with ADB (2021) findings. The rate of growth of the core digital economy was 2.4 times faster than the annual growth rate of the whole economy. The core digital economy prominently acts as a supplier of value-added to the non-digital sectors because the forward linkages are stronger than the backward linkages. To increase the ability of the digital economy to act as a pull force by spurring innovation, generating efficiencies and improving services, policies such as Make in India, PLI scheme, which incentivise domestic production of computers, electronics etc. are crucial for India’s growth going forward. Further, digital innovation leads to systemic effects in industries and markets, termed as digital disruption. The digitally dependent economy was around 22.4 per cent of the overall economy (around 0.6 trillion) in 2019. While there has been phenomenal growth of the core digital economy (powered by the ICT sector), the size of the digitally dependent economy has not grown at a comparable pace. This may be because digital innovations impact the economy over a longer term. Further, the weighted output multiplier for the digital sector has grown between 2014 and 2019, as opposed to the non-digital sector’s output multiplier. This reflects greater investments in the digital sector will drive the total output of the economy by a larger value. Policymakers can make use of multipliers to comprehend the sectors which should be chosen for investment to enhance final demand, as the sectors that have the highest direct and indirect effects on the economy will have a greater impact on the economy. The employment estimates, based on ADB’s (2021) framework and PLFS (2019) show that 4.9 million people were employed in the core digital sector. Considering the total digitally dependent economy, around 62.4 million workers are employed in sectors that are digitally disrupted. The extent of employed workers exposed to digital disruption underscores the need for digital literacy and skilling, more so considering the high growth of employment expected in the digital sector in coming years, as internet connectivity and industry 4.0 alter production and consumption technologies. However, the study is not bereft of limitations. Access to granular data based on a 35x35 input-output table is limited. Further, it is difficult to capture the digital economy based on traditional statistics because of the numerous interactions of digital technology across various activities in the economy. These limitations have resulted in the commencement of efforts by organisations and countries to create satellite accounts within the System of National Accounts to estimate the value-addition of the digital economy. Thus, a wider discussion among national statistical agencies and academicians involved in developing measurement framework seems to be a step in the right direction. References ADB (2021), Capturing the Digital Economy - A Proposed Measurement Framework and its Applications, A special supplement to Key Indicators for Asia and the Pacific 2021, Asian Development Bank. Ahmad, N., & Ribarsky, J. (2018). Towards a framework for measuring the digital economy. In 16th Conference of the International Association of Official Statisticians (IAOS) OECD Headquarters, Paris, France. Paris: IAOS (pp. 19-21). Barefoot, K., Curtis, D., Jolliff, R., & Omohundro, R. (2018). Defining and Measuring the Digital Economy. Washington, DC: Bureau of Economic Analysis. Brynjolfsson, E., Collis, A., Diewert, W. E., Eggers, F., & Fox, K. J. (2019). GDP-B: Accounting for the value of new and free goods in the digital economy (No. w25695). National Bureau of Economic Research. Dynan, K., & Sheiner, L. (2018). GDP as a measure of economic well-being (Vol. 43, p. 53). Hutchins Center Working Paper. Huawei and Oxford Economics (2017), Digital Spillover, Measuring the true impact of the digital economy, Huawei Technologies Co.,Ltd. Kumar, S., & Ghosh, S. (2019). Measuring India’s digital economy. Journal of Income & Wealth (The), 41(1), 93-106. Mas, M., Radoselovics, J. F. D. G., Robledo, J. C., Cardona, M., Samoili, S., De Prato, G., & Cobo, M. L. (2021). The 2021 PREDICT Key Facts Report. EUR 30870 EN. Mitchell, J. A proposed framework for digital supply-use tables. In meeting of the Informal Advisory Group on Measuring GDP in a Digitalised Economy, OECD (Vol. 9). Moulton, B., Tebrake, J., & Tovar, M. (2022). Experimental Indicators of Digital Industries in Select Countries: Definitions, Methods, and Results. IMF. Retrieved October 2, 2022, from https://www.imf.org/en/Publications/WP/Issues/2022/09/29/Experimental-Indicators-of-Digital-Industries-in-Select-Countries-Definitions-Methods-and-524035 NASSCOM. (2022). Technology Sector in India 2022: Strategic Review. https://nasscom.in/knowledge-center/publications/technology-sector-india-2022-strategic-review Niti Aayog. (2022). India’s Booming Gig and Platform Economy: Perspectives and Recommendations on the Future of Work. Delhi: Niti Aayog. OECD (2020). A Roadmap Toward a Common Framework for Measuring the Digital Economy, Report for the G20 Digital Economy Task Force. https://www.oecd.org/sti/roadmap-toward-a-common-framework-for-measuring-the-digital-economy.pdf Skog, Daniel A., Henrik Wimelius, and Johan Sandberg. “Digital disruption.” Business & Information Systems Engineering 60, no. 5 (2018): 431-437. TeamLease. (2021). Digital Employment Outlook Report. UNCTAD. (2021). Technology and Innovation Report Catching Technological Waves Innovation and equity. Geneva: United Nations UNCTAD. World Bank data. (2022). Retrieved from https://data.worldbank.org/country/IN
Annexure 1 Deriving Gross Value Added in terms of Leontief Inverse Coefficients Following the standard input-output framework, gross output x: Disaggregating GVA across industries (Users and Suppliers) Disaggregation of economy-wide GVA into an n x n matrix yields as industry’s backward and forward linkages; indicating the industry’s sources and destinations of value addition. In case of digital economy, these sources refer to industries from which digital sectors get inputs (digitally enabling industries), and destinations refer to industries that utilise digital sectors’ output as inputs (digitally enabled industries). Quantification of Digital Economy in a Two-Industry Economy To measure the digital economy, the entire digital industry’s GVA must be calculated. The term v1b11y1 is value-added contribution of the digital industry to its own products. The second term, v1b12y2, accounts for the value-added contribution of the digital industry to non-digital industry for its production. Thus, digital industry’s forward linkage digitally enables Industry 2. The term v2b21y1 pertains to value added contributions from non-digital industry for digital industry’s production. The first column shows that final digital goods and services comprises contributions from both digital and non-digital industries. Thus, the non-digital industry enables digital industry production, through backward linkage. The term v2b22y2 indicates value addition originated and used by the non-digital industry without any interaction with digital industry, and hence not considered as a part of the digital economy. Thus, the GVA attributable to the digital economy is attributed to the GVA of the digital industry plus the portion of the non-digital industry’s GVA enabling the digital industry production: Quantifying the Digital Economy in an n-Industry Economy Assume three industries in the economy, where first two industries are digital. Interaction between 2 or more industries results in double counting if the method discussed above is implemented. A simple solution to aggregate similar industries and consider them as one sector suggested by the ADB framework is to use matrix aggregations, i.e., “the digital sector” (Chart 4). In the framework, “aggregator matrices” are used to aggregate Z, x, f, and gva matrices. The dimensions of the aggregator matrix are [n-(q-1)] × n, where n is the original number of industries and q is the number of industries to be aggregated into one sector. Letting Q denote the aggregator matrix, aggregated matrices are given by the equations8: 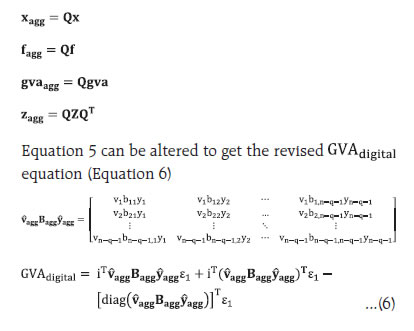
| Table A1.1: ADB National Input–Output 35-Sector Classification | | Code | Sector | | c1 | Agriculture, hunting, forestry, and fishing | | c2 | Mining and quarrying | | c3 | Food, beverages, and tobacco | | c4 | Textiles and textile products | | c5 | Leather, leather products, and footwear | | c6 | Wood and products of wood and cork | | c7 | Pulp, paper, paper products, printing, and publishing | | c8 | Coke, refined petroleum, and nuclear fuel | | c9 | Chemicals and chemical products | | c10 | Rubber and plastics | | c11 | Other nonmetallic minerals | | c12 | Basic metals and fabricated metal | | c13 | Machinery, nec | | c14 | Electrical and optical equipment | | c15 | Transport equipment | | c16 | Manufacturing, nec; recycling | | c17 | Electricity, gas, and water supply | | c18 | Construction | | c19 | Sale, maintenance, and repair of motor vehicles and motorcycles; retail sale of fuel | | c20 | Wholesale trade and commission trade, except of motor vehicles and motorcycles | | c21 | Retail trade, except of motor vehicles and motorcycles; repair of household goods | | c22 | Hotels and restaurants | | c23 | Inland transport | | c24 | Water transport | | c25 | Air transport | | c26 | Other supporting and auxiliary transport activities; activities of travel agencies | | c27 | Post and telecommunications | | c28 | Financial intermediation | | c29 | Real estate activities | | c30 | Renting of machinery and equipment; other business activities | | c31 | Public administration and defense; compulsory social security | | c32 | Education | | c33 | Health and social work | | c34 | Other community, social, and personal services | | c35 | Private households with employed persons | | Source: Asian Development Bank. |
| Table A1.2: Digital Product Groups (Central Product Classification Version 2) | | Digital activities | Code | Product | | Hardware | 452 | Computing machinery and parts and accessories thereof | | 475 | Disks, tapes, solid-state nonvolatile storage devices, and other media, not recorded | | Software publishing | 38582 | Software cartridges for video game consoles | | 478 | Packaged software | | 83143 | Software originals | | 8434 | Software downloads | | 84391 | Online games | | 84392 | Online software | | Web Publishing | 83633 | Sale of internet advertising space (except on commission) | | 843 | Online content | | Telecommunications services | 841 | Telephony and other telecommunications services | | 842 | Internet telecommunications services | | Specialised and support services | 8313 | IT consulting and support services | | 83141 | IT design and development services for applications | | 83142 | IT design and development services for networks and systems | | 8315 | Hosting and IT infrastructure provisioning services | | 8316 | IT infrastructure and network management services | | Source: Capturing the Digital Economy: A Proposed Measurement Framework and Its Applications, ADB (2021). |
| Table A1.3: Digital Industry Classification (International Standard Industrial Classification of All Economic Activities Revision 4) | | Digital activities | Code | Industry | | Hardware | 2620 | Manufacture of computers and peripheral equipment | | 2680 | Manufacture of magnetic and optical media | | Software publishing | 5820 | Software publishing | | Web Publishing | 6312 | Web portals | | Telecommunications services | 61 | Telecommunications services | | Specialised and support services | 62 | Computer programming services, consulting, and other related services | | 6311 | Data processing, hosting, and related activities | | Source: Capturing the Digital Economy: A Proposed Measurement Framework and Its Applications, ADB (2021). |
Annexure 2 | Employment in the Core Digital Economy | | ISIC code | MRIO classification | ISIC Description | Per cent of total employed | | 2620 | c14 | Manufacture of Computers and Peripheral Equipment | 0.01 | | 2680 | c14 | Manufacture of Magnetic and Optical Media | 0 | | 5820 | c7 | Software Publishing | 0.02 | | 61 | c27 | Telecommunications | 0.14 | | 62 | c30 | Computer Programming, Consultancy and Related Activities | 0.55 | | 6311 | c30 | Data Processing, Hosting and Related Activities | 0.07 | | 6312 | c30 | Web Portals | 0.01 | | 3290 | c16 | Manufacturing, n.e.c; recycling | 0.09 | | 5911 | c34 | Motion picture, video and television programme production activities | 0.02 | | 5920 | c34 | Sound recording and music publishing activities | 0.01 | | Total | 0.92 |
|