by Chaitali Bhowmick^, Sapna Goel^, Satadru Das and Gautam^ This article aims to bridge the existing information gap on unorganised sector by constructing a composite coincident index for the unorganised sector (UNCCI). Dynamic factor model, which applies kalman filter to derive the common trend from the constituent indicators has been used to construct the UNCCI. The UNCCI depict an uptick in unorganised activity since July 2022 and have remained resilient in Q2:2022-23. It showed reasonable co-movement with growth in derived unorganised sector quarterly series which qualify the UNCCIs as a credible index for monitoring unorganised sector activity on a regular basis. 1. Introduction Nearly half of the measured economic activity in India takes place in the unorganised or informal sector, measurement of which remains a major challenge. Since the 2011-12 base year series, the National Statistical Office (NSO), in accordance with the sectoral classification laid out in the System of National Accounts (2008 SNA), has introduced institutional category-wise classification which classifies the entire economy into four sectors viz., private sector, public sector, general government and households. Gross value added generated within the household sector1 engaging less than ten total workers with power or twenty or more workers without power. broadly maps to unorganised sector activity and, henceforth will be referred to as unorganised sector GVA. Estimates of unorganised GVA are released on an annual basis with a lag of almost ten months since the end of a reference year. The very nature of operations of the unorganised or informal enterprises do not require maintenance of accounts or adherence to any regulations and hence, makes it difficult to have a proper account of unorganised sector activity in a timely manner. It may be mentioned that because of the similarities in conceptualisation of informal sector (at the international level) and unorganised sector (in India), the two terms are used synonymously in India and the same would be maintained in the present article. From the perspective of the central banks, the primary objective of the monetary policy – to maintain price stability while supporting growth – requires diligent monitoring of the latest economic scenario. Since the official estimates of various economic indicators are low frequency variables and are released with certain lags, the bi-monthly monetary policy of the Reserve Bank relies heavily on a rich and expanding set of high frequency indicators (HFIs), available mostly on a monthly basis, pertaining to various segments of the economy. However, this information set mostly represents activity in the organised sector as most of the HFIs belong to the organised sector. Therefore, information pertaining to the unorganised sector a segment contributing almost half to the overall economy remains untracked due to non-availability of robust data. The National Statistical Office (NSO) – the official compiler of the national accounts data also resorts to organised sector indices to estimate the unorganised sector activity. Furthermore, vast presence of the informal economy is primarily a developing country2 phenomenon. Despite the effort from some multilateral organisations like the International Labour Organisation (ILO) and the World Bank to estimate the size of the informal economy, the research agenda regarding the measurement, estimation and other issues pertaining to the informal economy remains largely unexplored. In this backdrop, this article aims to bridge the existing information gap on unorganised sector by constructing a composite coincident index for the unorganised sector (UNCCI) starting from April 2012 and latest updated till October 2022. The constituent indicators of the UNCCI pertaining to three categories – agriculture related indicators, activity pertains to construction, trade and transport, and other miscellaneous activity. Indicators are selected based on their dynamic correlation with the benchmark indicator – unorganised sector GVA growth. In addition to the UNCCI constructed using select indicators based on dynamic correlations, an alternative UNCCI has been developed for a shorter (2017 onwards) comprising richer datasets by including latest available indicators elaborated in later sections – 4 and 5. Section 2 provides an overview of how informal economy is conceptualised internationally as well as in India followed by an outline of the stylised facts relating to unorganised sector activity. Section 3 briefly reviews the relevant literature. Sections 4 describes the constituent indicators and methodology used for the study. The trajectory of the UNCCI and their tractability with various benchmark indicators are presented in section 5. Section 6 touches upon informal economy from employment perspective. Section 7 concludes the article. 2. Conceptualisation of Informal Economy Broadly, the informal economy, constitutes one of the components of the non-observed economy – (i) the informal economy defined as partial or total by-passing of public regulations; its activities not necessarily being carried out with the deliberate intention of avoiding payment of taxes or social security contributions; (ii) the underground economy concerning intentional by-passing of public regulations (under declaration) by registered firms; and (iii) the illegal economy involving illegal production of goods or services such as drugs etc. (OECD et al., 2002). The ILO in 1993 characterised informal sector in terms of the household enterprises which are involved in production of goods and services for sale or barter for which one or more of the criteria of limited size of employment, small scale of operation, non-registration of the enterprise or its employees are met [15th International Conference of Labour Statisticians (ICLS)]. This is in affiliation with the SNA 2008 outline of informal enterprises as a subset of the household (HH) sector3. 2.1. Indian experience According to the definition espoused by the NSO in accordance with SNA 2008, HH sector includes – (i) agricultural activities undertaken on agricultural holdings, either individually or in partnership, excluding plantation crops and corporate farming; and (ii) within non-agricultural sector, all non-government unincorporated enterprises that are not classified as quasi-corporations4. It covers enterprises that are not registered under the Companies Act or beedi and cigar workers Act, 1966; and factories not registered under section 2(m)(i) and 2(m)(ii) of the Factory Act, 1948 which refers to factories with ten or more workers with aid of power, or twenty or more workers without power. The GVA from this sector broadly represents the unorganised sector GVA in India. To compute the unorganised sector GVA, the NSO follows a combination of direct (survey-based method) and indirect methods (extrapolation). In general, for the base year benchmark estimates, a mixed household-enterprise survey approach is used i.e., the quinquennial survey of Unincorporated Enterprises (excluding construction) and Employment Unemployment Survey [replaced with periodic labour force survey (PLFS) since April 2017] of the households. Based on the concordance between the two surveys, GVA estimates are derived at sub-sectoral level5. For the non-survey years, GVA growth is extrapolated by applying the growth rate of sector-specific indicators such as wholesale price index (WPI), index of industrial production (IIP), GVA from annual survey of industries (ASI), growth in goods and services tax (GST) collection etc. on the benchmark estimates of the survey year. Against this backdrop, a few limitations can be highlighted. First, the benchmark survey is presently done on quinquennial basis and at times the lag often exceed five years, making the survey outdated with passage of time. The recent initiatives by the Government which could potentially contribute towards formalisation necessitates more regular surveys for adequately capturing the true state of the unorganised activity. Second, the indicators used for extrapolation are mostly representative of the organised sector activity and therefore, fail to reflect the true state of the unorganised sector. The official sector-wise estimates of unorganised GVA components are latest available for 2020-21. Moreover, the growth in both organised and unorganised sectors has not always remained in tandem, and performance of the unorganised sector is observed to be largely driven by that of agriculture, forestry and fishing sector. Similarly, certain sectors viz., construction, transport, storage, communication and services related to broadcasting, and other services have divergent growth trends between organised and unorganised counterparts for specific periods during the last decade posing challenges to estimation methodologies at disaggregated level. In entirety, the asynchrony in growth of the two sectors raises a question on the practice of using indicators of the organised sector to proxy the unorganised sector GVA as it does not represent the actual state of the unorganised sector (Chart 1). 2.2. Stylised facts The share of the unorganised sector in overall GVA reduced from 45.5 per cent in 2011-12 to 43.5 per cent in 2020-21 - a meagre drop of 2 percentage points over a decade (Annexure 1 Table 1). While the organised segment registered an average nominal growth of 9.8 per cent, the unorganised counterpart clocked in 8.9 per cent growth in the last decade. As has been widely conjectured, the lop-sided impact of the pandemic on the informal sector during 2020-21 is corroborated by the contraction of 3.9 per cent in the unorganised sector GVA vis-à-vis the marginal expansion of 0.2 per cent in organised sector GVA in 2020-21 [Chart 1a.(ii)]. At the sectoral level, the unorganised activity is largely concentrated in four sectors – agriculture, forestry and fishing; construction; trade, repair, hotels and restaurants; and real estate, ownership of dwellings and professional services. Compared to their decadal average, the informal segment in all sector except agriculture, mining and quarrying, electricity and construction suffered loss of share in 2020-21. The pandemic-induced asymmetric impact is visible in both manufacturing and services. Within manufacturing, while organised sector nominal GVA grew by 2.6 per cent, the unorganised component contracted by 16.6 per cent in 2020-21. Similarly, within services, though both organised and unorganised constituents of hotels and restaurants; other services; transport; trade and repair; and construction registered a contraction, the contraction was more entrenched in the latter (Chart 2).
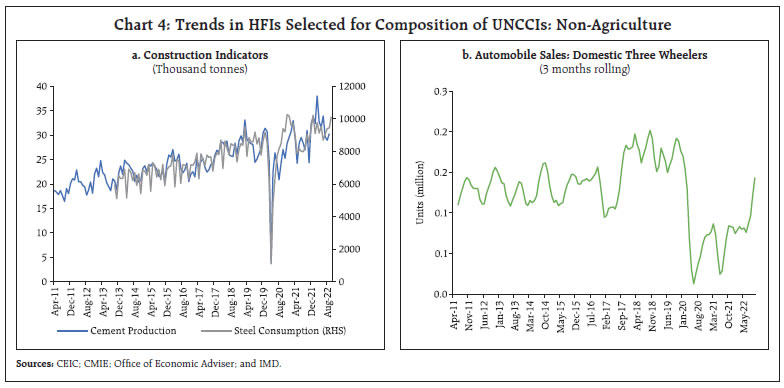
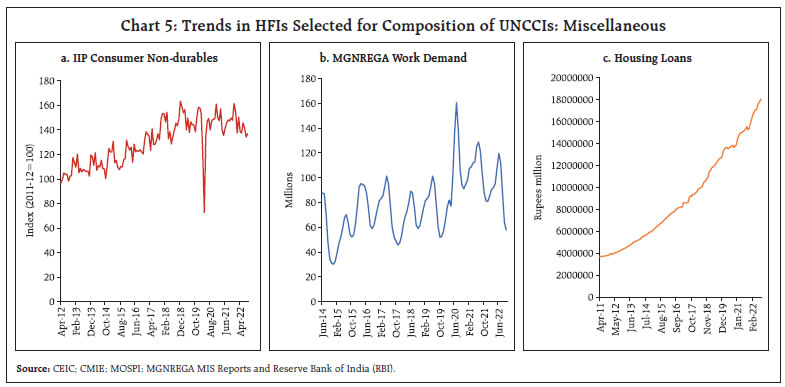
3. Literature review There are three main methods to estimate output of the informal economy, viz., direct approach, indirect estimation and model-based methods. In the direct method, primary data collection on informal output is carried out by way of sample surveys, censuses or questionnaires. The lack of adequate resources to conduct these surveys on a frequent basis necessitates looking at alternative estimation techniques which are being developed over the years. The indirect estimation exploits the economic relationship between variables under specific assumptions and studies the differences between postulated hypothesis between variables and their actual realisation. Some popular indirect approaches include electricity consumption and GDP of the economy; currency demand approach, Bayesian method averaging, however, each has been criticised for its limiting assumptions or for restrictive focus on only one aspect of the informal economy. The theoretical model-based methods set out a computation formula or a model to measure the output or size of the informal economy as an unobserved latent variable. The multiple indicator multiple cause (MIMIC) and dynamic general equilibrium (DGE) methods are primarily used for such estimation; however, these too have their own limitations such as usage of ad hoc econometric models that are subjective, sensitive to sample coverage and not reliant on micro behaviour of households, firms or other agents of the economy. In Indian context, the National Statistical Commission estimated the size of the informal economy to be 52 per cent of the total for 2017-18 (Murthy, 2019). The World Bank (2021), using model-based approaches, estimated India’s informal output to be in the range of 16 to 19 per cent of GDP for 2018-19. A few recent studies have probed the idiosyncratic impact of the pandemic on the informal economy in India. Estupiñan and Sharma (2020) found that in India, formal workers’ wages were cut by 3.6 per cent, while informal workers experienced a much sharper fall in wages by 22.6 per cent for the forty-day period of Lockdown 1.0 and Lockdown 2.0. The State Bank of India (2021) assessed the size of the informal economy to be not more than 15 to 20 per cent in 2020-21 assuming that the shrinkage in economy post-pandemic was mostly informal. Kesar et al. (2021) from a large-scale survey of informal workers found that during the lockdown self-employed workers in urban areas on average suffered most in terms of reduction in food intake relative to those in the agriculture sector. However, the caveats in existing measurement practices have left a gap in quantifying the size of the informal economy or the activity in the unorganised sector. This study, therefore, deviates from the existing literature by making a one-of-its-kind attempt towards an indicator-based approach for estimating and tracking the unorganised sector activity, thereby, adding another strand to the literature. The exercise uses the dynamic factor model (DFM) estimation which has been discussed in detail in section 4.4 of the article. 4. Empirical Analysis 4.1 Data Description A total of fifteen HFIs (Annex 1 Table 2) were identified for construction of the UNCCI. The variables, though not completely overlapping with the contours of unorganised sector, somewhat mimics the activity in these units. Since the unorganised sector contributes more than 90 per cent to the agriculture and allied activities’ GVA, sector’s proximate indicators – sales of tractor sales, rainfall deviation, light diesel oil consumption used in low RPM engines and equipment, irrigation pumps etc. have been considered for representation of this sector (Chart 3). Indicators pertaining to construction, trade and transport related activity include steel consumption and cement production – primary raw materials within construction, and domestic three-wheeler sales which are mostly used by small traders and transporters (Chart 4). Indicators for miscellaneous activities include work demanded under Mahatma Gandhi National Rural Employment Guarantee Act (MGNREGA) indicating the labour demand conditions of unskilled workers in rural areas; IIP for consumer non-durables consisting of food items and fast-moving consumer goods, the demand for which relates closely to farm and non-farm activity, currency with the public – a proxy for cash-based nature of activity within unorganised enterprises, and housing loans disbursed by the scheduled commercial banks representing activity in the construction sector (Chart 5). The trends in the identified HFIs exhibited non-stationarity. Of the total, UNCCIs have been constructed based on the availability of data, the selection criteria of which has been elaborated in the following sub-section. 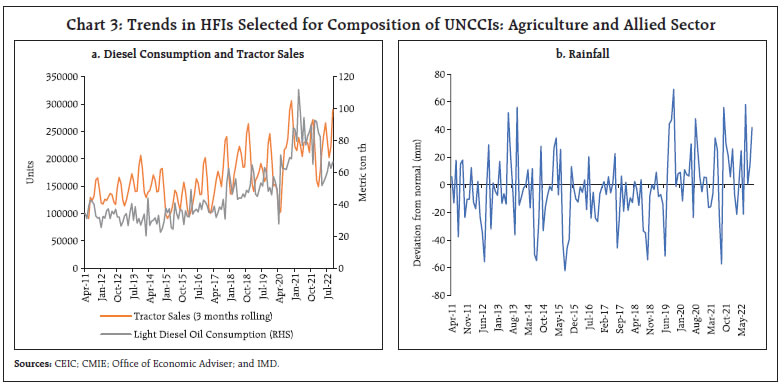
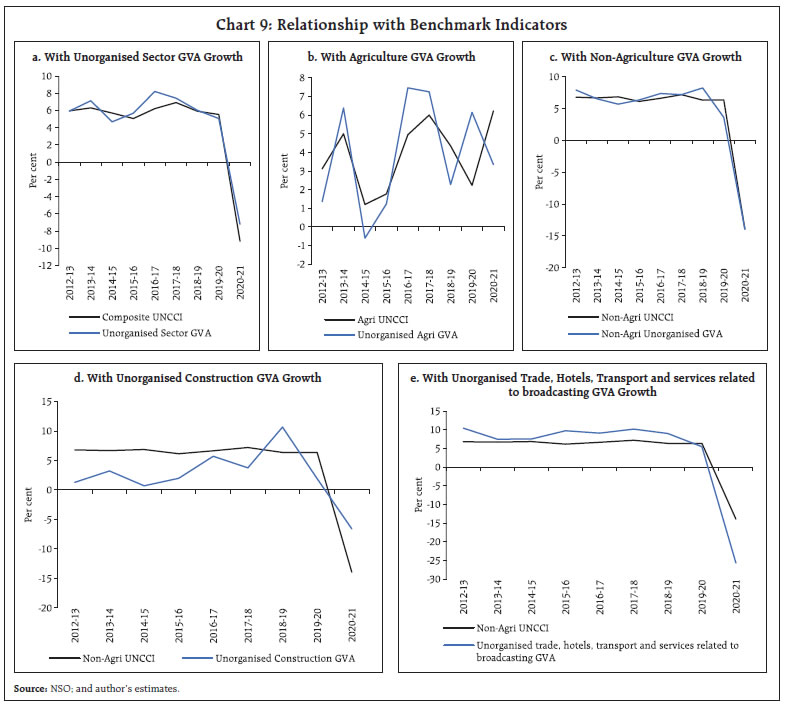
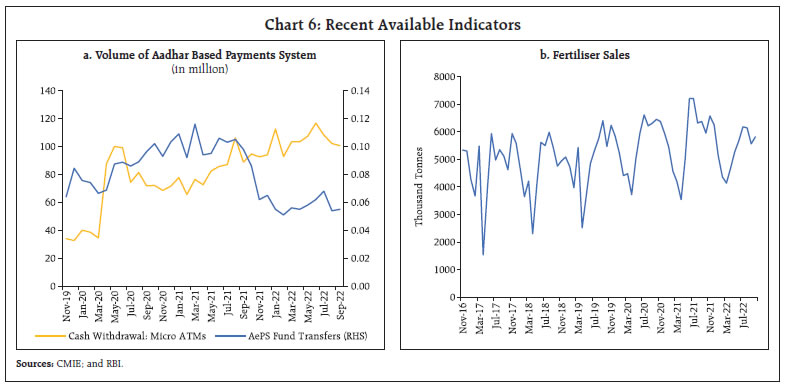 In addition, a few recently available HFIs relevant for unorganised sector activity have also been explored. These include Aadhaar enabled payment system (AePS) which is a financial transactions system facilitating secure transactions at micro-ATMs through business correspondent of any bank using Aadhaar-based technology, thereby, furthering the goals of financial inclusion, particularly in the unbanked and underbanked regions. Data on Aadhar enabled retail credit transfer and cash withdrawal at micro-ATMs have been published by RBI since November 2019 (Chart 6). Fertiliser sales is another agriculture sector indicator available 2017 onwards. The number of data points for these indicators are too low to establish any statistically significant correlation, and, therefore, do not qualify for statistical tests on account of limited data points. However, anecdotal evidence suggests that these services cater predominantly the people engaged in unorganised activity. Therefore, an alternative 9-indicator UNCCI for a shorter duration (April 2017 onwards) has also been attempted incorporating these indicators. 4.2 Indicator Selection The next step involves indicator selection based on both statistical tests as well as the judgment. Contemporaneous correlation and one period lag between y-o-y growth in indicators and unorganised sector GVA growth have been chosen as the selection criteria for the indicators. Indicators which exhibited sufficiently strong and statistically significant correlation with either the same period or one period ahead GVA growth or both are selected as the final set of indicators for constructing the UNCCIs. Since the cyclical pattern and seasonal variation in agriculture and non-agriculture activity differs substantially, correlation exercise has been performed separately for unorganised sector agriculture GVA growth y-o-y growth in all monthly indicators identified for agriculture. Rest of the indicators are clubbed together into non-agriculture category and correlations have been performed with unorganised sector non-agriculture GVA. Most of the indicators show significantly high contemporaneous correlation while a few indicators also exhibit lead indicator property (Chart 7). Among the indicators, steel consumption, rainfall deviation, tractor sales, three-wheeler sales, IIP consumer non-durables exhibit stronger correlations. 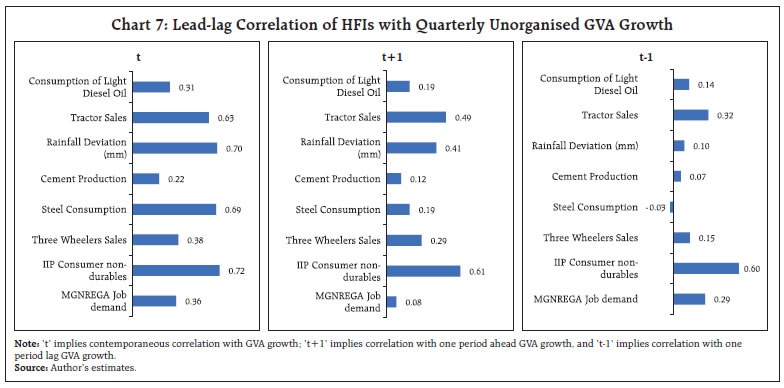 4.3 Benchmark Indicators As mentioned earlier in this article, the official estimates of the unorganised sector GVA are available on an annual basis which imply non-availability of target variables at quarterly frequency against which the UNCCI may be tracked. Although it is possible to track the co-movement of the constituent indicators with the benchmark indicator graphically based on the annual series, establishing a formal relationship through statistically significant correlations require more data points. Therefore, the quarterly GVA series are derived from the annual series for examining the co-movement of the constituent indicators with the benchmark as selection criteria and ex-post tracking of the UNCCI. Beside total GVA of the unorganised sector, GVA growth in unorganised agriculture and allied activity, construction, and trade, hotel, transport, communication, and services related to broadcasting have been considered as benchmarks owing to their large unorganised segment (Annex I Table 1). Furthermore, an alternative target variable based on a distinct dataset is also generated for robustness purpose which is presented later in section 6. 4.3.1 Derivation of Quarterly Unorganised Sector GVA The quarterly series of unorganised sector GVA has been derived from the official series of annual GVA for the unorganised sector. To generate the series, the quarterly shares, calculated from the overall nominal GVA, have been applied on the annual estimates of the unorganised sector at current prices. The derived series has then been deflated using the all-India GVA deflators at the sectoral level to arrive at the constant price estimates for the unorganised sector. 4.3.2 Compilation of Employment Shares from Survey Data A robustness exercise has been performed using quarterly employment growth in the informal sector which is compiled from the unit level data of the PLFS, available from Q2:2017-18 to Q1:2021-22. In PLFS, the employment in the informal sector is measured as the sum of all workers employed in informal enterprises as principal status. As per their report, an informal enterprise is defined as those enterprises which are proprietary in terms of ownership or are partnership between family members or neighbors. On the other hand, the formal sector consists of limited partnerships, limited corporations, the public sector, and charitable institutions. It must be mentioned that PLFS only defines formal-informal enterprises for the non-agricultural sector. Therefore, in this study, all workers from the agricultural sector are added to the informal sector except for corporate or government farming. 4.4 Construction of the Index Based on the correlation results, indicators have been shortlisted. The chosen HFIs for agriculture have been combined into a composite index for unorganised agricultural sector. Similarly, indicators showing high correlation with non-agricultural GVA are used for constructing a composite index for unorganised non-agriculture sector. Finally, the composite index has been created by applying weighted share of unorganised agriculture and allied activity and that of non-agriculture GVA. In case of agriculture, a total of four indicators have been shortlisted for their robust correlation with agriculture GVA (Table 1). For non-agriculture, six indicators have been selected based on the same criteria (Table 1). In addition, a 9-indicator UNCCI has been developed encompassing some latest available indicators representing unorganised sector activity viz., AePS fund transfer, cash withdrawal at micro-ATMs, and fertiliser sales. DFM is a leading framework for construction of economic index from multiple variables where the latent vectors are the sum of the dynamic effect of the common factors and the idiosyncratic disturbance component (Geweke, 1977); (Sargent and Sims, 1977); (Stock and Watson, 2016). The UNCCIs have been developed using DFM in the state-space framework which uses Kalman filter to derive the common trend from the constituent indicators. The model produces a smaller number of unobserved or latent factors from a large set of variables. In our exercise, we have considered a single factor which encapsulate the co-movements in the set of indicators. | Table 1: HFIs used in construction of UNCCIs | | S. No. | Indicators | Composite UNCCI | 9-indicator UNCCI | | Agri | Non-Agri | | 1 | Diesel consumption: Light Diesel Oil | √ | | √ | | 2 | Rainfall Deviation | √ | | | | 3 | Tractor Sales | √ | | √ | | 4 | IIP Consumer Non-durables | √ | √ | | | 5 | Automobile Domestic Sales: Three-wheeler | | √ | √ | | 6 | Steel Consumption | | √ | √ | | 7 | Cement Production | | √ | √ | | 8 | Housing Loans | | √ | | | 9 | MGNREGA: Work Demand Persons | | √ | √ | | 10 | Fertiliser Sales | | | √ | | 11 | Retail Credit Transfer: AePS Fund Transfer | | | √ | | 12 | Cash withdrawal at micro-ATMs | | | √ | | Notes: (i) MGNREGA job demand is inverted to account for the fallback characteristic of this sector; (ii) Currency with public has been dropped from the final set due to poor correlation with unorganised GVA growth. | Finally, the single factor which is in standardised from is scaled to a comparable scale of quarterly unorganised sector GVA growth using scaling parameters generated from the ordinary least square (OLS) regression with unorganised GVA growth as the dependent variable and the single dynamic factor as the explanatory variable (equation 1). 5. Trajectory of the UNCCI The UNCCI (both sectoral and composite) represent the overall trajectory in the unorganised sector activity reflecting pertinent impact of relevant economic or non-economic but related events which occurred during the period under consideration – April 2012 to October 2022 (Chart 8). The 4-indicator agriculture UNCCI captures the dip during the two successive years of drought 2014-15 and 2015-16. The index rebounded sharply in the following two years reflecting robust agricultural growth in next two consecutive years. The non-agricultural UNCCI corroborates the slowdown in construction and transportation activity during the middle years of 2015-16 and 2016-17. Moreover, the non-agricultural UNCCI along with combined composite UNCCI clearly demonstrate the cataclysmic impact of COVID on the non-agricultural unorganised sector. The index had a steady recovery in the latter half of 2020. Interestingly, the trend in UNCCIs during the COVID period appears consistent with the narrative that during the first wave, the adverse impact of the pandemic was relatively contained in rural areas, having higher share of unorganised sector, than the urban areas. In contrast, the impact was protracted during and in the aftermath of the second wave as the virus trickled down to the rural regions. There has been an uptick in unorganised activity since July 2022 and the composite UNCCI has remained resilient in Q2:2022-23. 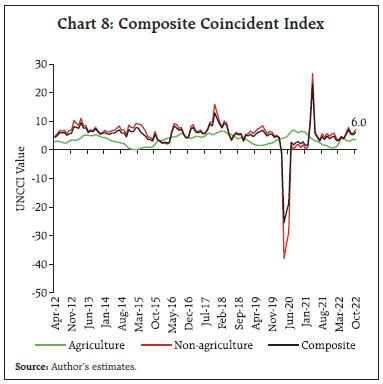 5.1. Relationship with Benchmark Indicators Both the sectoral and overall UNCCIs exhibit reasonable co-movement with the benchmark indicators considered in this study (Chart 9). Quarterly unorganised GVA growth exhibit 88 per cent correlation with overall UNCCI (Table 2). Correlation turns out to be stronger in case of non-agriculture UNCCI when compared with agriculture. Correlations between non-agriculture UNCCI and sectoral GVA of construction and trade, hotel, transport, and communication GVA growth are above 80 per cent indicating robust tracking by the index (Table 2). | Table 2: Robustness Checks with Benchmark Indicators | | UNCCI | Benchmark Indicator | Correlation Coefficient | Sign Accuracy
(per cent) | Theil's U | | Composite UNCCI | Unorganised Sector GVA | 0.88*** | 94.4 | 0.36 | | Agri UNCCI | Unorganised Agri GVA | 0.58*** | 86.1 | 0.49 | | All-India Agri GVA | 0.57*** | 88.9 | 0.5 | | Non-Agri UNCCI | Non-Agri Unorganised GVA | 0.89*** | 94.4 | 0.37 | | Non-Agri all-India GVA | 0.88*** | 97.2 | 0.41 | | Unorganised Construction GVA | 0.82*** | 83.3 | 0.63 | | All-India Construction GVA | 0.86*** | 86.1 | 0.59 | | Unorganised trade, hotels, transport and services related to broadcasting GVA | 0.86*** | 91.7 | 0.55 | | All-India trade, hotels, transport and services related to broadcasting GVA | 0.89*** | 91.7 | 0.48 | Note: ***p < 0.01.
Source: Author’s estimates. |
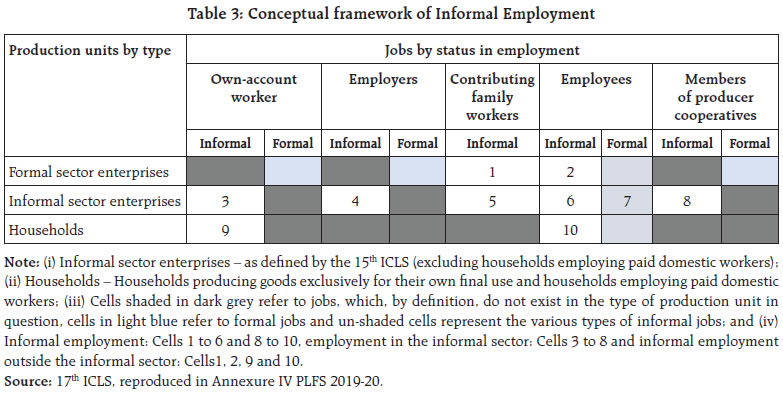
 One common test of reliability is the sign accuracy6 in the growth rate of constructed series against the actual series. All the UNCCIs clears the sign accuracy test quite well with more than 80 per cent, respectively, for all the benchmark indicators. Theil’s U statistic7, another statistical metric, is well below 1 for all indicators and is lowest for the overall UNCCI ensuring better prediction by the UNCCIs compared with naïve forecast. 5.2 Alternative 9-Indicator UNCCI The 9-indicator UNCCI for a short duration encompassing recent data displays consistent tracking vis-à-vis., the overall UNCCI (Chart 10). The recent trajectory of the two indices is broadly similar – exhibiting a descent since the onset of the Russia-Ukraine war in early 2022 reflecting headwinds from skyrocketing of energy prices and synchronised monetary policy tightening across the globe. The correlation between the two UNCCIs for the overlapping period turns out significantly high at 0.89. As more data points are required for establishing suitability of the statistical robustness of the indicators, the composite UNCCI may be used for tracking unorganised sector activity in near future, while both indicators would be updated on a regular basis. 6. Unorganised Sector from Employment Perspective In effect, informality can be viewed from two standpoints – (i) the informal sector (production or enterprise-oriented perspective); and (ii) the informal employment (labour perspective). So far, the former view has been discussed widely in the article. However, supplementing the 15th ICLS guidelines, the ILO in 2003 endorsed a statistical framework of informal employment (Annex 1 Table 3), defining it as a form of employment with no employment or social security benefits viz., paid leave, pension entitlements, written contract etc. provided by the employer, thereby, encompassing all forms of informal jobs carried out in both formal as well as the informal enterprises (17th ICLS). An informal worker in India comprises – (i) home-based worker, self-employed worker, or a wage worker in the unorganised sector (as defined under the Unorganised Workers’ Social Security Act, 2008); and (ii) worker in the organised sector not covered by any of the Acts such as the Employee’s Compensation Act, 1923, the Industrial Disputes Act, 1947, the Employees’ State Insurance Act, 1948 etc. In present digital age, however, the traditional relation between employer and employee is changing which makes the distinction between formal and informal workers more complex. As per the Economic Survey 2021-22, of the additional workers who joined the workforce in 2019-20, roughly 98 per cent were in the unorganised sector and 90 per cent were engaged in informal employment. As on 2019-20, 89 per cent of the workforce was in the informal sector while 82.2 per cent worked in unorganised sector (Chart 11). Nevertheless, as 98 per cent of unorganised workers also fall under informal sector category, both the terms may be used interchangeably irrespective of the conceptual difference. Formal sector employment registered deeper contraction as compared with informal sector employment during the COVID period. This could be due to large share of informal employment in the agriculture sector which was exempted from lockdowns and other restrictive measures. 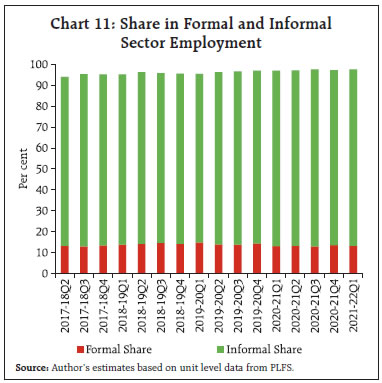
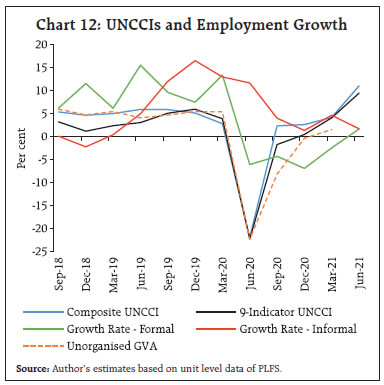 In relation to the current exercise, robustness check of UNCCIs is carried out from the employment perspective by generating growth series from PLFS data (as elaborated in section 4.2.2). Informal employment growth displayed a downward trend since the second half of 2019-20. However, informal sector employment did not exhibit strong coherence with unorganised GVA growth (Chart 12), a key reason being the small sample size and disguised unemployment. In contrast to large scale output loss on account of COVID-19, informal sector employment showed resilience during the first wave of COVID-19. 7. Conclusion The article attempt to address the problem of lack of timely information on unorganised sector activity which could serve as a crucial input for monetary policy. In view of this, an attempt has been made by developing a coincident index at a monthly frequency. Dynamic factor model, which applies kalman filter to derive the common trend from the constituent indicators has been used to construct the UNCCI. The UNCCI has been available from April 2012 onwards and updated till October 2022. The UNCCIs depict an uptick in unorganised activity since July 2022 and have remained resilient in Q2:2022-23. The overall as well as the sectoral (agriculture and non-agriculture) UNCCIs showed reasonable co-movement with growth in derived unorganised sector quarterly series which qualify the UNCCIs as a credible instrument for monitoring unorganised sector activity on a regular basis. The 9-indicator UNCCI enriched with newly available data exhibits robust tractability. Furthermore, the Government of India has initiated regular surveys such as PLFS, All-India Quarterly Establishment based Employment survey (AQEES) etc., and is in the process of introducing new surveys such as All-India Survey of Migrant Workers, All-India Survey on Domestic Workers, All- India Survey on Employment generated in Transport Sector, All-India Survey of Employment Generated by Professionals. All such endeavours would provide quarterly estimates on employment and related variables in both organised and unorganised segments, going forward. However, there are a few caveats in the study which need to be mentioned explicitly. Due to the non-availability of long time series of the selected HFIs, time period of the study turned out to be shorter relative to number of observations required for standard time series analysis. DFM, by virtue of its dimension reduction feature, provides some cushion against the loss of degrees of freedom. Second, the benchmark indicators used in this exercise are derived indicators, based on assumptions, some of which may appear to be strong and restrictive. Furthermore, quarterly shares of overall GVA have been used to generate the quarterly distribution of unorganised sector GVA, which is another approximation. The selected indicators are those likely to have larger overlapping with unorganised sector activity and have sufficient number of observations. Hence, there is no one-to-one mapping of the selected indicators with unorganised sector activity and the first stage of indicator selection involves fair amount of judgment of the authors. Despite the limitations, the UNCCI displays reasonable coherence to serve as a suitable index for monitoring unorganised sector activity in a timely manner. References Estupinan, Xavier and Sharma, Mohit (2020). “Job and Wage Losses in Informal Sector due to the Covid-19 Lockdown Measures in India”. Geweke, J (1977). “The dynamic factor analysis of economic time series”. Latent variables in socio-economic models. GOI, Ministry of Statistics and Programme Implementation (2015). “Changes in Methodology and Data Sources in the New Series of National Accounts”. GOI, Ministry of Finance (2022). “Economic Survey 2021-22”. ILO (1993). “Fifteenth International Conference of Labour Statisticians, Geneva, 19-28 January 1993: Report I, General Report, First Item on the Agenda”. ILO (2003). “Seventeenth International Conference of Labour Statisticians, Geneva, 24 November - 3 December 2003, General Report: Report I”. ILO (2020). “Global Wage Report 2020-21: Wages and minimum wages in the time of Covid-19”. Kesar, S., Abraham, R., Lahoti, R., Nath, P., & Basole, A. (2021). “Pandemic, informality, and vulnerability: Impact of COVID-19 on livelihoods in India”. Canadian Journal of Development Studies, 42(1-2), 145-164. Mohanty Jaya, Hansda K Sanjay, Jain Rajeev (2003): “Turnover Index of Financial Services – A Monthly Construct for India”, Money & Finance, ICRA Bulletin, April-Sept, pp 47-61. Murthy, Ramana Venkata (2019). “Measuring Informal Economy in India: Indian Experience”. IMF Seventh Statistical Forum, November 14, 2019. NCEUS (2007). “Report on Conditions of Work and Promotion of Livelihoods in the Unorganised Sector”. Sargent, T. J., & Sims, C. A. (1977). “Business cycle modelling without pretending to have too much a priori economic theory”. New methods in business cycle research, 1, 145-168. SBI Ecowrap (2021). “Share of Informal Economy May Have Shrunk to No More Than 20% From 52% In FY18”. Schneider, Friedrich G. and Buehn, Andreas and Montenegro, Claudio E. and Montenegro, Claudio E. (2010). “Shadow Economies All Over the World: New Estimates for 162 Countries from 1999 to 2007”. World Bank Policy Research Working Paper No. 5356. Stock, J. H., & Watson, M. W. (2016). “Dynamic factor models, factor-augmented vector autoregressions, and structural vector autoregressions in macroeconomics”. Handbook of macroeconomics, Vol. 2, pp. 415-525, Elsevier. United Nations, European Commission, International Monetary Fund, Organisation for Economic Co-operation and Development, & World Bank (2009). “System of national accounts 2008”. New York: United Nations.
Annexure-1 Table 1: Sector-wise Share of Unorganised Sector GVA
(at current prices) | | Economic Activity | 2011-12 | 2012-13 | 2013-14 | 2014-15 | 2015-16 | 2016-17 | 2017-18 | 2018-19 | 2019-20 | 2020-21 | | 1. Agriculture, forestry and fishing | 94.8 | 94.6 | 94.8 | 94.5 | 95.0 | 95.2 | 95.5 | 95.5 | 95.8 | 95.7 | | 2. Mining and quarrying | 22.6 | 22.8 | 20.9 | 21.4 | 20.9 | 23.7 | 26.7 | 27.0 | 27.5 | 28.2 | | 3. Manufacturing | 12.7 | 13.4 | 13.9 | 13.1 | 13.8 | 12.5 | 12.4 | 12.6 | 12.7 | 10.6 | | 4. Electricity, Gas, Water supply & Other utility services | 3.2 | 3.4 | 3.7 | 4.4 | 4.2 | 5.0 | 5.3 | 6.1 | 6.4 | 7.0 | | 5. Construction | 76.4 | 77.1 | 77.4 | 74.7 | 73.5 | 73.3 | 72.1 | 74.6 | 75.1 | 75.9 | | 6. Trade, repair, Hotels and Restaurants | 56.0 | 55.8 | 56.0 | 55.5 | 55.5 | 55.8 | 54.7 | 54.5 | 54.4 | 53.4 | | 7. Transport, Storage, Communication & Services related to broadcasting | 39.6 | 39.5 | 40.0 | 38.5 | 38.0 | 38.5 | 39.1 | 40.8 | 40.0 | 35.2 | | 8. Financial services | 0.0 | 0.0 | 0.0 | 0.0 | 0.0 | 0.0 | 0.0 | 0.0 | 0.0 | 0.0 | | 9. Real estate, Ownership of dwelling & Professional services | 57.2 | 56.3 | 54.0 | 51.7 | 49.0 | 46.7 | 48.8 | 47.3 | 45.8 | 45.1 | | 10. Public administration and Defence | 0.0 | 0.0 | 0.0 | 0.0 | 0.0 | 0.0 | 0.0 | 0.0 | 0.0 | 0.0 | | 11. Other services | 22.6 | 23.0 | 23.8 | 23.8 | 24.1 | 24.3 | 25.4 | 25.8 | 26.7 | 21.8 | | 12. Total GVA at basic prices | 45.5 | 45.5 | 45.8 | 44.7 | 43.7 | 43.7 | 44.1 | 44.0 | 44.5 | 43.5 | | Source: NSO. |
| Table 2: List of indicators used to compute composite indicator for unorganised sector | | S. No. | Indicator | Data Source | Description | | 1 | Agriculture related indicators | | 1.1 | Tractor sales | SIAM, CMIE | India being an agriculture-driven economy and unorganised sector comprising more than 90 per cent share in agriculture and allied activities GVA, the indicators are used as a proxy for activity in the sector | | 1.2 | Fertiliser sales | | | 1.3 | Rainfall deviation | Indian Meteorological Department | | 1.4 | Diesel consumption: Light Diesel Oil | Petroleum Planning & Analysis Cell | Proxy for fuel consumption of the unorganised firms using low RPM engines and equipment etc. | | 2 | Construction, trade, hotel, and transport services | | 2.1 | Steel consumption | Joint Plant Committee | Unorganised sector roughly contributes 75 per cent to the sectoral GVA which is extrapolated by proximate indicators of steel and cement | | 2.2 | Cement Production | Office of Economic Adviser | | 2.3 | Automobile Domestic Sales: Three-wheeler | SIAM | Represents usability of three-wheelers as a means of transportation by the unorganised segment | | 3 | Aadhar based Payment | | 2.1 | Retail Credit Transfer: AePS Fund Transfer | RBI | Bank-led model allowing online interoperable financial transaction at PoS (micro-ATM) through business correspondent (BC) of any bank using Aadhaar authentication. | | 2.2 | Retail Credit Transfer: ABPS | Channelising government subsidies and benefits to the intended beneficiaries using Aadhaar details | | 2.3 | Debit Transfers and Direct Transfer: BHIM Aadhar Pay | Enables merchants to receive digital payments from customers over the counter through Aadhaar authentication | | 2.4 | Cash withdrawal at micro-ATMs | Enables BCs (say a local kirana shop owner and will act as ‘micro-ATM’) to conduct instant transactions | | 4 | Miscellaneous | | 4.1 | Money Supply: Currency with the public | RBI | Reflects the cash-based activity in informal sector enterprises and/or rural areas | | 4.2 | MGNREGA: Work Demand Persons | MIS Reports | Indicates the labour demand conditions of the unskilled labourers in rural areas | | 4.3 | IIP consumer non-durables | MOSPI | Production of food and FMCG items. | | 4.4 | Housing loans | RBI | Loans disbursed by scheduled commercial banks adding to the construction GVA which has major share of unorganised sector activity. |
|