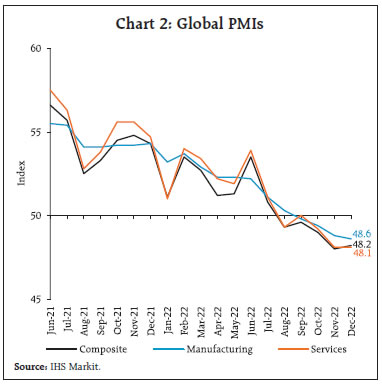
A slowdown in growth with possibilities of recession in large swathes of the global economy has become the baseline assessment even as inflation may average well above targets. Emerging markets are appearing more resilient than in the year gone by, but their biggest risks in 2023 stem from US monetary policy and the US dollar. In India, the softening of commodity prices and other costs amidst strong revenues appears to have boosted corporate performance. Macroeconomic stability is getting bolstered with inflation being brought into the tolerance band and lead indicators suggesting that the current account deficit is on course to narrow through the rest of 2022 and 2023. Introduction After a roller coaster 2022, what will 2023 turn out to be? The year has begun with predictions of a slowdown in global growth that will fight just shy of the painful contractions of 2009 and 2020 imposed by the global financial crisis and the COVID-19 pandemic1, respectively. Warnings are out about large swathes of the world likely to be in recession; some of them are already into downturns2. Other views in this strand point to still festering geopolitical risks, the commodities shock – both shortages and costs – the loss of macroeconomic stability, an imminent tipping point in financial asset valuations long buoyed by the afterglow of pandemic liquidity policies, and to surveys of economists, to justify the inevitability of a recession in 2023 – ‘a grim and potentially dangerous year’3. While inflation was the dominant economic and financial issue of 2022, recession will overthrow it and take the driver’s seat of the global discourse in 20234. Global growth may turn out to be 2 per cent or lower, while inflation in the advanced world may average above 4 per cent and 8 per cent among emerging and developing economies5. Financial markets are contesting this view on the global outlook for 2023. They take cues from the moderation in inflation - however modest; the ebbing of commodity prices and supply chain pressures; and early signs of slowing activity and trade to believe that central banks have done their most in 2022 in tightening monetary and financial conditions and that they will be forced to pause and ease off during 2023. Bond markets are shrugging off central bank guidance and eyeing lower terminal rates than implied in the latter’s hawkishness - easing yields and a surge of issuances marks the onset of the new year. Equity markets also seem to be still pricing in a soft landing as fund managers girdle up to recoup the losses of 2022. Importantly, the US dollar is retreating from 20-year highs and many emerging market currencies are reversing the losses of December 2022. Portfolio flows return to hunt growth differentials vis-à-vis advanced economy markets. The 2022 debate between ‘team transitory’ and ‘team permanent’ on inflation is going to be displaced in 2023 by ‘short and shallow’ versus ‘long (or several) and deep’ on recession. Macroeconomic projections, however sophisticated, tend to be linear and hence fragile in a world in which non-linearities hold sway. Powerful forces are being unleashed that can potentially reshape the global order. The upsurge of international hostilities in 2022 is rearranging geopolitical configurations, with profound implications for economic activity, commerce and finance. Climate may energise a people’s Movement of unprecedented scale and scope in 20236, but most of the world will have to accept the short-term imperative of fossil fuels for energy security before adopting longer-term strategies for reliance on cleaner, renewable sources that are – most importantly – secure. On the bright side, investing in renewables is becoming a win-win proposition. It is increasingly likely that it will be driven by strategic public policy, but with the clear danger of leaving behind stranded polluting energy assets over the next decade as emission targets bite. On the flip side, 2023 is likely to be a year of low capital expenditure worldwide, with businesses deterred by the uncertainties surrounding geopolitical dynamics and green transition. They will have to defend against still-elevated costs and increased expenditures on inventories and receivables to the detriment of capital spending. Another instance of forecasting being overwhelmed by outcomes is the pace of growth of world trade volume which is projected to more than halve (1.6 per cent) in 2023 from 4 per cent a year ago7. Muscular forces in the form of trade and industrial policies that are reordering the international trading environment may, however, produce large forecast error swings on either side of this projection. Massive subsidies, incentives and export restrictions are being unleashed for green energy, electric cars and semiconductors to ensure that production should be local. OPEC-type groupings are likely to emerge in respect of strategic materials. The immediate consequence could spiral into tit-for-tat protectionism worldwide. Globalisation may soon become extinct or at least endangered. Yet another force that may alter the contours of international trade as we know it today is its plumbing – seaborne traffic. Container ports are being developed to be closely held in response to the supply chain shock of the pandemic. This explains the rising popularity of inland “dry ports”, where goods are put in containers ahead of time, ready to be loaded onto ships as they arrive at the pier without needing to be stored for days at the port itself. Much of the dry-port development is occurring in Asia: the centre of gravity of international shipping is shifting eastwards. Nearly 60 per cent of Asia’s exports flow within the region. A boom in investment in warehouses for storage and hubs for distribution and fulfilment in the region is already under way. Investments by shipping giants are pointing in the same eastward direction. The outlook for world trade in 2023 looks leaner, smarter and more eastern. For emerging and developing economies, the biggest risks in 2023 are US monetary policy and the US dollar. Some of them have shown remarkable resilience during 2022 in coping with global spillovers from these sources, and in calibrating monetary policy to domestic growth-stability trade-offs in a period of high inflation levels and volatility. Across the global south, however, hunger is becoming a function of prices rather than availability. In some parts of this world, debt distress will cause many countries to continue to teeter on the edge of crisis as they negotiate debt relief with bilateral lenders before a multilateral bail-out is feasible. The difficulty of servicing external debt is compounded by the fact that interest rates are decided extra-nationally. It is estimated that the combination of weaker external demand, elevated inflation, depreciated currencies and domestic headwinds will cost these economies up to a full percentage point in per capita income growth. This can stall convergence of some of these economies with advanced economies to a point of no return. The cumulative loss of GDP between 2020 and 2024 is estimated to be as much as 30 per cent of 2019 GDP. Taken together, long lasting effects are feared, perhaps a lost decade8. The brewing debt crisis also means that one out of five EMDEs is effectively locked out of global debt markets, presaging a prolonged period of investment starvation and loss of potential output. Yet, against all these odds, emerging market equities have rallied in the beginning of 2023, with the MSCI emerging market index ahead by more than 21 per cent in the first few days of January 2023 relative to the intraday low touched on October 25, 2022. There is increasing enthusiasm among fund managers that emerging markets are launching into a secular outperformance over advanced economy assets. Nonetheless, these economies need to be mindful of external conditions to which they are more vulnerable relative to advanced counterparts. The most important downside risk to monitor is a slowing global economy, and in the absence of a central bank put, they can brace up for a tightening of the external demand constraint on their aspirations to grow out of pandemic lows. The question that confronts 2023 is: after 2022’s rough ride, will these economies rebound this year? There are early promising starts: lowered leverage; more modest equity valuations relative to advanced peers (10X versus 17X) and an economic recovery that seems to have taken hold in the last quarter of 2022 even as inflation has modestly receded and currencies are stabilising. Moreover, a capital flows redux is widely expected after the rout of 2022 as investor appetite improves, mispricing of emerging market assets due to fright in the face of global spillovers corrects, and the outlook for advanced economy markets weakens over the year ahead. Against this backdrop, we turn to recent developments in the global economy and sectoral changes in the domestic economy as 2023 gets going. This will provide the tableau for crystal gazing into what 2023 holds for the Indian economy in the concluding section. The rest of the article is organised into four sections. The immediately following section presents the latest global developments, followed by two sections on domestic economic developments along with inflation dynamics, and financial developments, including payment system progress all of which set the stage for imagining the outlook for India in 2023 in the concluding section. II. Global Setting Weakening demand conditions, some lingering supply bottlenecks and resurgent COVID infections characterise the global outlook for 2023. Central banks are moderating the pace of monetary policy tightening as inflation eases grudgingly across the globe in sync with moderating commodity prices, although it remains in high reaches and well above targets. Accordingly, their forward guidance has reiterated their commitment to break inflation and anchor inflation expectations. The IMF expects one-third of the world to be in recession in 2023.9 In its latest Global Economic Prospects (GEP) released on January 10, 2023 the World Bank points to a prolonged slowdown in the global economy with growth pegged at 2.2 per cent in 2023 – the third lowest in three decades (Table 1). For advanced economies (AEs), growth has been revised downwards by 170 basis points relative to June 2022 projections to 0.5 per cent whereas for emerging market economies (EMEs), it has been lowered by 80 basis points to 3.4 per cent.10 During Q3:2022, growth in the OECD countries remained flat at 0.6 per cent. Against this backdrop, our model based nowcast11 projects global GDP growth momentum to remain unchanged in Q4:2022 (Chart 1a & 1b)12. Among high frequency indicators, the global composite purchasing managers’ index (PMI) at 48.2 in December continued to contract as output decreased for the fifth successive month (Chart 2). The global manufacturing PMI fell to a 30-month low of 48.6 in December, remaining in the contractionary zone for the fourth successive month as new orders fell across all sectors. World merchandise trade volume growth slowed to 3.2 per cent year-on-year (y-o-y) in October 2022 due to negative momentum as well as an unfavourable base effect (Chart 3a). The Baltic Dry Index – a measure of shipping charges for dry bulk commodities – had edged up in late November - early December 2022 on hopes of a pickup in global demand, but it has fallen in recent weeks on weaker global growth prospects (Chart 3b). According to the World Trade Organization (WTO), the world services trade barometer indicates successive moderation in services growth in the third and fourth quarters of 2022, in line with slowing merchandise trade volume growth. PMI sub-indices also indicate a fall in international trade volumes. 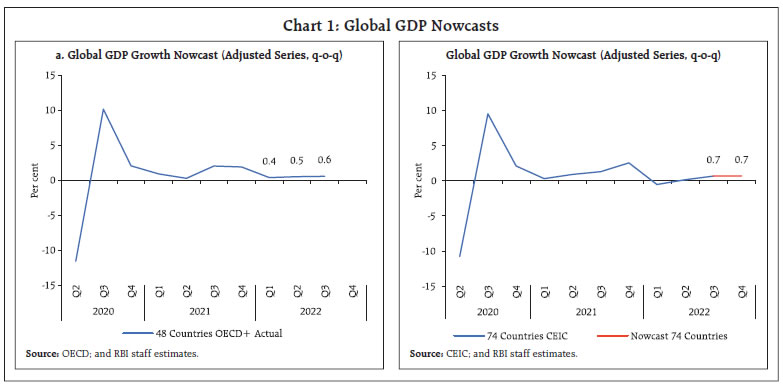
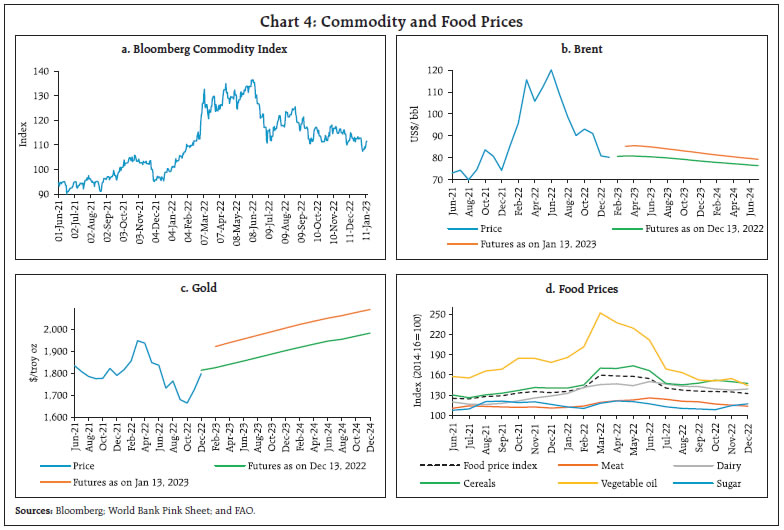
 Global commodity prices remained range bound in December, as slowing global growth dampened demand while Russia-Ukraine tensions posed upside risks (Chart 4a). Crude oil prices traded at an average of US$ 80.9 per barrel in December, taking cues from both demand concerns and imposition of the price cap by G7. Crude oil prices reversed the gains of 2022, ending the year 9.7 per cent lower on a y-o-y basis (Chart 4b). Gold prices inched up in December on safe haven demand amidst rising COVID-19 cases and easing US dollar (Chart 4c). The FAO13 food price index declined for the ninth consecutive month in December 2022, led by a steep fall in vegetable oil prices and declines in cereals and meat prices which were partially offset by moderate increases in sugar and dairy prices (Chart 4d). Nevertheless, the index averaged 14.3 per cent higher in 2022 vis-à-vis the previous year. 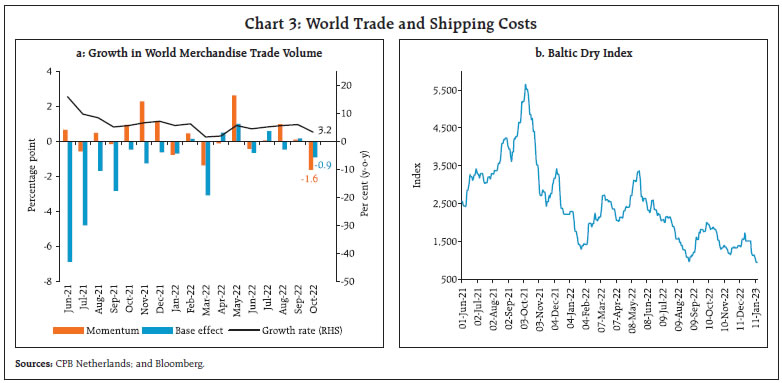
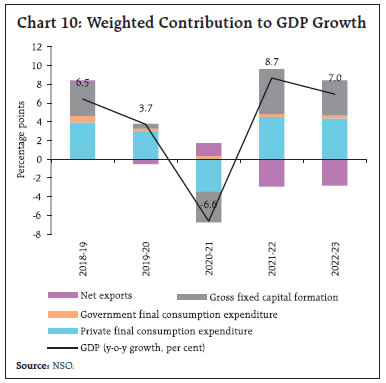
 As pandemic-induced supply chain bottlenecks eased, food and energy prices moderated and headline inflation eased across AEs and EMEs. The US CPI inflation eased markedly for the sixth consecutive month to 6.5 per cent in December 2022 from 7.1 per cent in November. Inflation based on US personal consumption expenditure (PCE) index eased to 5.5 per cent in November from 6.1 per cent in October (Chart 5a). In the Euro area, inflation slowed to 9.2 per cent in December 2022 from 10.1 per cent in November, driven by negative momentum in energy prices. In the UK, inflation edged down to 10.5 per cent in December 2022 from 10.7 per cent in November, led by transport prices. Japan, on the other hand, recorded a four-decade high CPI inflation of 3.8 per cent in November. Among the emerging economies, inflation eased further in Brazil (5.8 per cent), Russia (11.9 per cent) and South Africa (7.2 per cent) in December 2022 (Chart 5b). In China, however, inflation edged up marginally to 1.8 per cent in December 2022. Elevated energy prices, particularly in the EU and UK, still contribute substantially to overall inflation (Chart 5c). The outlook remains uncertain even though increased gas storage is being augmented by demand-reduction initiatives and continental Europe transiting to liquified natural gas (LNG) replacing Russian gas. Also, despite the moderation in headline numbers, services inflation in AEs remains sticky (Chart 5d). Beginning early December, hawkish commentaries from AE central banks imparted a pessimistic bias to global equity markets, which shed gains to the tune of 4 per cent in December. AE markets in the Morgan Stanley Capital International (MSCI) index ended 4.3 per cent lower while EME equities fell by 1.6 per cent from November 2022 (Chart 6a). Markets rallied in the first few days of January 2023 on expectations of a less hawkish stance of the Fed. 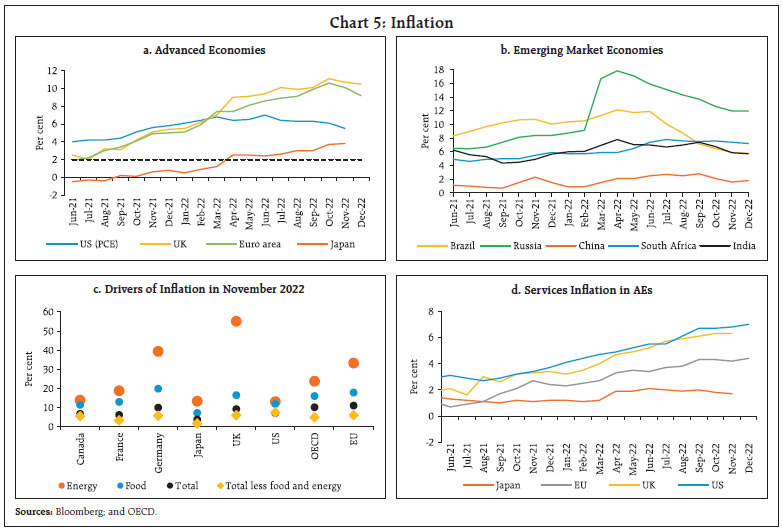 During December 2022, the 10-year G-sec yields hardened across major AEs as investors flocked to Japanese markets after the Bank of Japan (BoJ) expanded its tolerance range of 10-year Japanese Government bond yield fluctuations from ± 0.25 percentage points to ± 0.5 percentage points. The 10-year US treasury yield shot up by 27 basis points while the 2-year G-sec yield rose by 12 bps, thereby reducing the magnitude of yield curve inversion (Chart 6b). The US dollar, which reversed its rally in October, continued to lose strength, shedding 2.3 per cent in December. Concomitantly, the MSCI currency index for EMEs gained momentum, rising 1.7 per cent on the back of capital inflows (Chart 6c & 6d). Central banks of most AEs and EMEs have slowed the pace of monetary policy tightening in recent months (Chart 7a). Israel increased its policy rate by 50 bps in January 2023, taking it to the highest level since 2008. South Korea and Norway raised their key rates by 25 bps in January 2023 and December 2022, respectively. Japan has continued to diverge by maintaining an accommodative stance; however, it expanded its range of 10-year government bonds yield fluctuations, as stated earlier. Most EME central banks have also continued with policy tightening while a few have paused (Chart 7b). Peru hiked its policy rate by 25 bps in January 2023. In December 2022, Mexico and Indonesia moderated their hikes in policy rates to 50 bps and 25 bps, respectively, even as Hungary kept its rate unchanged. China continued with monetary accommodation. III. Domestic Developments The Indian economy exhibited resilience, with growth impulses stemming from domestic drivers. Supply responses are improving with our index of supply chain pressure for India (ISPI) declining to below historical average levels since August (Chart 8). In consonance, the economic activity index extracted from high frequency indicators (HFIs) in a dynamic factor model showed an uptick in activity in November 2022 (Chart 9a). Accordingly, our nowcast of GDP growth for Q3:2022-23 is placed at 4.5 per cent (Chart 9b). Aggregate Demand As per the first advance estimates of national income released by the National Statistical Office (NSO) on January 6, the Indian economy is projected to clock a growth of 7.0 per cent in 2022-23 (Chart 10). Consequently, real gross domestic product (GDP) surpassed its pre-pandemic (2019-20) level by 8.6 per cent. 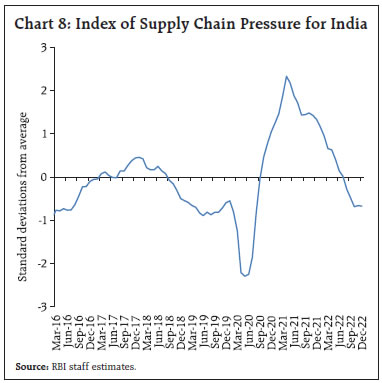 Private final consumption expenditure (PFCE) – the mainstay of aggregate demand – staged an uptick, registering a growth of 7.7 per cent on the back of a buoyant revival in contact-intensive activity, including travel and tourism, and an upbeat festival season. Growth of government final consumption expenditure (GFCE) at 3.1 per cent remained muted as the fiscal consolidation was accompanied by a reorientation of focus on capital expenditure. Gross fixed capital formation (GFCF) remained strong with double-digit growth, primarily aided by the government’s thrust on infrastructure. Accordingly, the real GFCF to GDP ratio increased to 33.9 per cent in 2022-23 from 32.5 per cent in the preceding year. 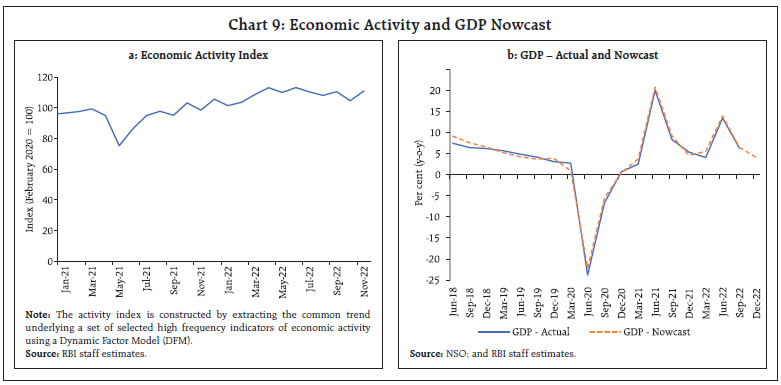
 On the other hand, multiple headwinds – commodity price shocks; tightening financial conditions; and resurgence of COVID-19 in some economies – thwarted external demand in 2022-23. India’s exports, after exhibiting a remarkable recovery post-COVID with growth of 24.3 per cent in 2021-22, moderated to 12.5 per cent in 2022-23. With the growth in imports at 20.9 per cent outpacing the growth in exports, the drag from external demand was at an unprecedented high of 7.1 per cent of GDP. Turning to recent developments, E-way bill volumes reflected sustained growth in underlying economic activity, breaching the 80 million mark in December for the second consecutive month. This was led by an increase in the movement of goods within States (Chart 11a). Toll collections strengthened both in volume and value terms, recording a high of ₹4,939.8 crore in December 2022 (Chart 11b). Lead indicators for the transport sector, however, paint a mixed picture. Fuel consumption rose in December, with petrol and diesel consumption remaining elevated, aided by agricultural demand from rabi sowing (Chart 12a). Sales of automobiles recorded a sequential drop, in spite of strong demand for sports utility vehicles (SUVs) and mid-segment cars (Chart 12b). Vehicle registrations declined for both transport and non-transport vehicles as pent-up demand lost steam (Chart 12c). Even though the festival season brought some respite, sales of two wheelers, three wheelers, motorcycles and tractors remained muted due to weak rural demand (Chart 12d). 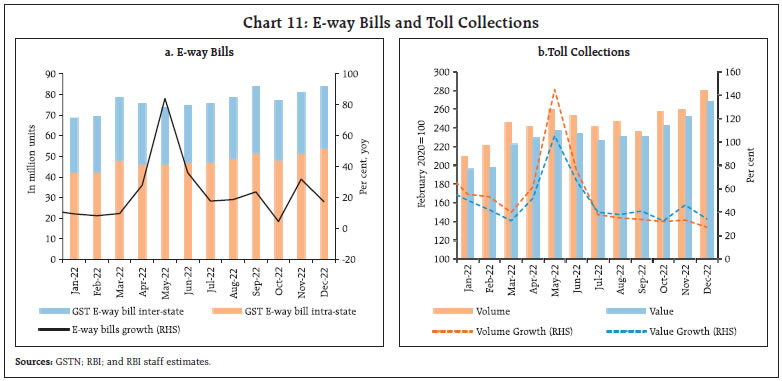 In the trade, hotels and transport sector, hotel occupancy rates crossed the pre-pandemic average for the first time (since February 2020) buoyed by an increase in corporate travel. However, occupancy was 6.5 percentage lower than in November 2019, indicating a sub-par seasonal recovery. Revenue per available room (RevPAR) dipped marginally below pre-pandemic levels while average room rates stayed above 2019 levels for the eighth straight month (Chart 13). Sales of fast-moving consumer goods (FMCG) products recovered sequentially in December14, increasing in value by 1.4 per cent over November levels. Growth was led by urban sales, while the rural segment contracted by 0.2 per cent. Overall FMCG demand remains suppressed with y-o-y contraction in all categories – packaged goods; home care; personal goods; and confectionery. As per the household survey of the Centre for Monitoring Indian Economy (CMIE), the all-India unemployment rate increased marginally to 8.3 per cent in December from 8.0 per cent in November 2022, led by an increase in urban unemployment (Chart 14a). The rise in the unemployment rate was driven by an increase in the labour force participation rate (LFPR) to 40.5 per cent in December from 39.6 per cent in the previous month even as the absolute number of employed workers was higher in both rural and urban areas (Chart 14b).
Organised employment reflected in the employment sub-index of the purchasing managers’ index (PMI) expanded in December 2022 for both manufacturing and services, albeit with a sequential moderation (Chart 15).
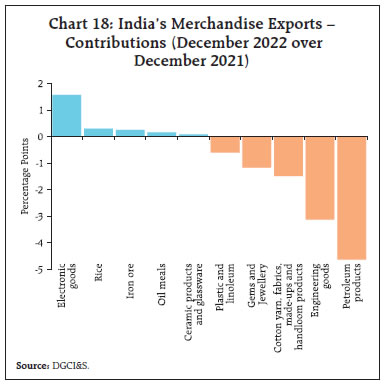
As sowing activity for the rabi season nears conclusion, demand for work under the Mahatma Gandhi National Rural Employment Guarantee Scheme (MGNREGS) has been rising on a sequential basis; however, it remained lower than a year ago, indicating better job opportunities in the labour market (Chart 16). India’s merchandise exports at US$ 34.5 billion contracted by 12.2 per cent on y-o-y basis in December 2022, as an unfavourable base effect interacted with a negative momentum (-1.1 per cent m-o-m) (Chart 17). Electronic goods, rice and iron ore were the primary commodities which contributed positively, while petroleum products, engineering goods, cotton yarn and fabrics weighed down export growth (Chart 18). Overall, non-oil exports witnessed contraction of 9.2 per cent on y-o-y basis in December 2022 and remained below US$ 30 billion for the fifth consecutive month. 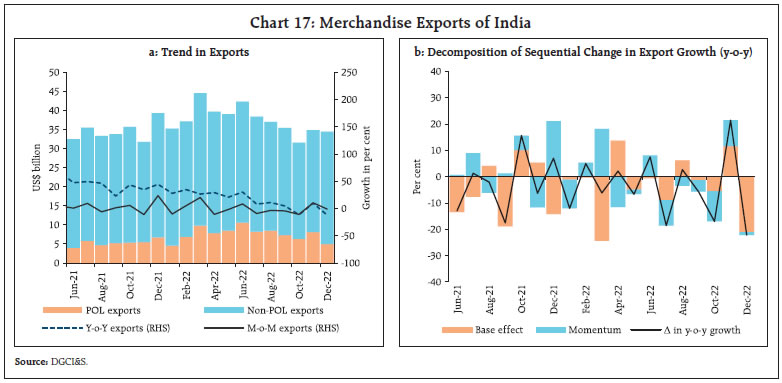
 Exports of gems and jewellery at US$ 2.5 billion contracted by 15.2 per cent in December 2022. According to the Gems and Jewellery Export Promotion Council (GJEPC), global headwinds from slowing markets such as the US contributed to the decline. The exports of engineering goods grew by 12.4 per cent (m-o-m) in December but at US$ 9.1 billion, they remained in contraction for the sixth consecutive month on a y-o-y basis. Eleven major commodities accounting for 18.2 per cent of the export basket, however, witnessed y-o-y expansion in December 2022. During April-December 2022, merchandise exports at US$ 332.8 billion reached 71 per cent of the export target set for 2022-23.15 India’s services exports at US$ 27.0 billion recorded robust growth in November 2022 due to software, business, and travel services, leading to net export earnings of US$ 11.7 billion in the month (Chart 19). After remaining in expansion zone for two years, merchandise imports at US$ 58.2 billion declined by 3.5 per cent on y-o-y basis in December 2022 while remaining unchanged on a sequential basis (Chart 20). Seventeen major commodities accounting for 66.4 per cent of the import basket, experienced positive y-o-y growth in December 2022. Non-petroleum non-gold imports remained below US$ 40 billion for the third consecutive month. Crude oil, transport equipment and iron and steel contributed the most to import growth whereas gold, chemicals, pearls, precious and semi-precious stones weighed it down (Chart 21). Import growth of petroleum and its products moderated to 5.9 per cent in December 2022 with a sequential decline of 3.2 per cent taking them down to US$ 17.5 billion. With rising international gold prices, India’s gold imports at US$ 1.2 billion declined by around 75 per cent (y-o-y) during December 2022. On policy front, the Government has allowed import of 51,000 tonnes of cotton at zero duty in 2023. The Union Cabinet has recently approved the National Green Hydrogen Mission which is expected to provide impetus to exports of green hydrogen and its derivatives. The merchandise trade deficit widened marginally to US$ 23.8 billion in December 2022 from US$ 23.4 billion in November 2022. The deficit was US$ 2.7 billion higher than its level a year ago.
During April – November 2022, the gross fiscal deficit of the central government stood at 58.9 per cent of budget estimates (BE), higher than during the corresponding period last year. The thrust on capital spending continued with a year-on-year (y-o-y) growth in capital outlay of 57.5 per cent, while revenue expenditure recorded a modest growth of 10.8 per cent. This lead to a marked improvement in the quality of spending (Chart 22 a and b). On the receipts side, gross tax revenue recorded a growth of 15.5 per cent, driven by an increase in collections under all major tax heads except excise duty (which is attributed to the cut in excise duty on petrol and diesel in May 2022). Direct and indirect taxes registered y-o-y growth of 23.4 per cent and 8.6 per cent, respectively (Chart 23). On the other hand, non-tax revenues contracted by 11.1 per cent during April-November. Non-debt capital receipts recorded an increase of 100.4 per cent vis-à-vis the corresponding period last year, led by the successful initial public offer (IPO) of the Life Insurance Corporation (LIC). GST collections (Centre plus States) in December 2022 stood at ₹1.49 lakh crore, a growth of 15.2 per cent over the corresponding month last year (Chart 24).
With a view to reducing the economy’s carbon intensity, the Union Budget 2022-23 had announced issuance of Sovereign Green Bonds (SGrBs) as a part of the government’s overall borrowing. Accordingly, ₹16,000 crore would be issued in Q4:2022-23 in 5 and 10-year maturities and the proceeds would be used in public sector infrastructure projects. These securities shall be eligible for repo, SLR and also available for investment by non-residents under the “Fully Accessible Route”. Aggregate Supply Aggregate supply, as measured by the gross value added (GVA) at basic prices, increased by 6.7 per cent in 2022-23, as against a growth of 8.1 per cent a year ago (Chart 25). The resilience in agriculture and services sectors supported overall GVA growth, while the industrial sector decelerated sharply. Agriculture remained robust, recording a growth of 3.5 per cent in 2022-23, driven by buoyant rabi sowing and allied activities. The industrial sector slowed down as input cost pressures impinged on profitability of manufacturing firms. The growth in the services sector accelerated to 9.1 per cent, led by a strong revival in trade, hotels, transport, communication, and services related to broadcasting and financial, real estate and professional services. 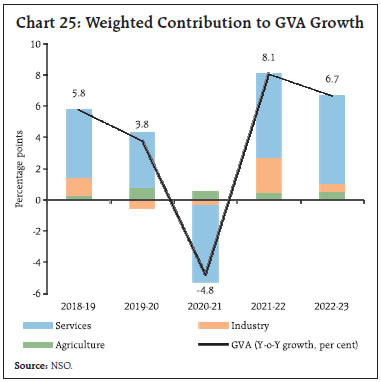
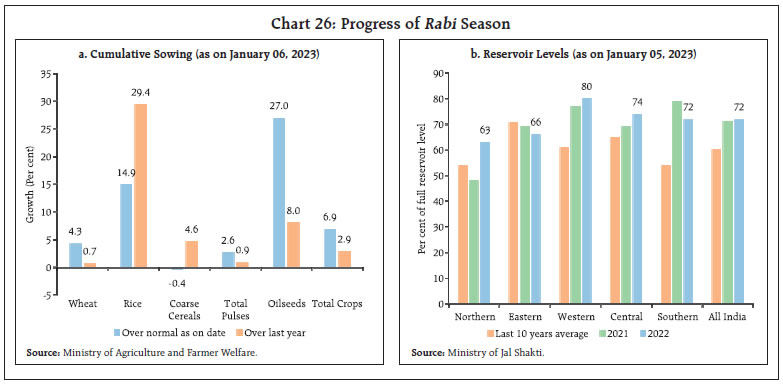 As on January 06, 2023 the cumulative sown area under rabi crops at 665.6 lakh hectares was higher by 2.9 per cent than the sown area in the corresponding week of the previous year and 6.9 per cent above normal acreage (5-year average) (Chart 26a). There was an increase in acreage under rice, maize and rapeseed and mustard. The reservoir water storage level was at 72 per cent of full reservoir level (FRL) as on January 05, 2022 which was 1.4 per cent higher than last year’s level and 20.0 per cent higher than the 10-year average FRL (Chart 26b). The Government of India announced a new integrated food security scheme, allowing provision of free foodgrains (5 kg per person per month to priority households and 35 kg per household per month to the Antyodaya Anna Yojana beneficiaries) to about 81.35 crore beneficiaries under the National Food Security Act (NFSA) for one year from January 1, 2023. This new scheme will replace and subsume the earlier scheme wherein the same amount of foodgrains was provided at subsidised prices (₹3/2/1 per kg of rice/wheat/coarse grains, respectively), along with monthly provision of 5 kg of free foodgrains per person. In the industrial sector, the headline manufacturing purchasing managers’ index (PMI) increased to a twenty-two month high of 57.8 in December supported by a strong increase in new orders and output. The business expectation index remained elevated at 67.1 in December, albeit marginally down from a seven year high of 67.2 last month (Chart 27a). The services PMI recorded its highest expansion in six months, aided by an increase in new business. However, business expectations moderated from November’s 7-year high (Chart 27b). A cross-country comparison shows that India remained an outlier among major economies, with an expansionary composite PMI reading in December (Chart 27c). In the services sector, transport indicators continued to show a mixed picture, with railway freight traffic earnings growing by 3.0 per cent (y-o-y) in December 2022 as compared to 7.2 per cent a year ago (Chart 28a). Cargo traffic picked up at major ports in December due to improvement in carriage of finished fertilizers and coking coal (Chart 28b). In the construction sector, cement production and steel consumption picked up, with steel consumption recording positive y-o-y growth for the tenth consecutive month in December (Chart 29). Cement production recorded the highest growth in 15 months in November, helped by a low base as well as a pick-up in production from a post festival and monsoon-related slack.
High frequency indicators in the service sector indicated that overall recovery remained in traction (Table 2). International and domestic passenger footfalls picked up in December over the previous month. Air cargo recovered in the domestic sector, increasing by 4.4 per cent in December 2022 over the previous month, even as international cargo continued to contract on a m-o-m basis. In January (up to January 11, 2023), international passenger activity increased on a m-o-m basis, while domestic passenger travel and cargo segments recorded contraction. In terms of key policy initiatives at the state level to support infrastructure, the Government of Odisha introduced a scheme to reduce post-harvest management losses and provide marketing support for horticulture produce by providing financial assistance to the farmers in the State. Tamil Nadu announced setting up of a green fund with a corpus amount of ₹1000 crore which will be invested in the circular economy, renewable energy, and other projects aimed at mitigating climate change. In West Bengal, infrastructure projects relating to surface roads, metro rails and railways, and sewerage infrastructure projects were initiated, which included three national highway projects worth ₹1206 crore. Inflation The provisional data released by the National Statistical Office (NSO) on January 12, 2023 showed that inflation, as measured by y-o-y changes in the all-India consumer price index (CPI), moderated to 5.7 per cent in December 2022 from 5.9 per cent in November. The easing was primarily driven by the sharp moderation in food inflation (Chart 30a and 30b). The index declined by 45 bps month-on-month (m-o-m), which was partially offset by an unfavourable base effect (month-on-month change in prices a year ago) of 30 bps, resulting in a fall in headline inflation by around 15 bps between November and December. The m-o-m decline in prices was of the order of 135 bps within the food and beverages group, which more than offset the positive price momentum of 44 bps in the fuel group and 30 bps in the core (excluding food and fuel) category. The softening of CPI food inflation to 4.6 per cent in December from 5.1 per cent in November came from a sharp decline in price momentum of 135 bps despite a strong unfavourable base effect of 88 bps. In terms of sub-groups, inflation softened in respect of fruits and prepared meals while deflation in vegetables prices deepened (Chart 31). On the other hand, inflation rose in cereals to 13.8 per cent (highest since July 2013), protein-based food (pulses, eggs, meat and fish, and milk) to 6.7 per cent and spices to 20.4 per cent. Edible oils and sugar inflation moved into positive territory from deflation in November (Chart 32).
Inflation in the fuel and light group edged up to 11.0 per cent in December from 10.6 per cent in November, mainly driven by kerosene. Firewood and chips inflation also increased, while inflation for electricity and liquified petroleum gas (LPG) remained steady. The fuel group with a weight of 6.8 per cent in the CPI basket contributed 13.0 per cent of headline inflation in December.
CPI core inflation remained steady at around 6 per cent since May 2022. Inflation in sub-groups such as pan, tobacco and intoxicants, health, education, and personal care and effects increased during the month while recreation and amusement, clothing and footwear, housing, household goods and services, and transport and communication sub-groups witnessed some moderation. In terms of regional distribution, rural inflation at 6.0 per cent was higher than urban inflation (5.4 per cent) in December 2022 (Chart 33). Among the states, Mizoram experienced inflation in excess of 8 per cent whereas Chhattisgarh, Daman and Diu, Delhi, Goa, Himachal Pradesh, Manipur, Meghalaya and Odisha recorded inflation below 4 per cent. High frequency food price data for the month of January so far (January 1-12) from the Department of Consumer Affairs (DCA) point to an increase in wheat and atta, and rice prices. Prices of onions, potatoes, tomatoes, pulses and edible oils registered a broad-based decline (Chart 34).
| Table 3: Petroleum Products Prices | | Item | Unit | Domestic Prices | Month-over-month (per cent) | | Jan-22 | Dec-22 | Jan-23 | Dec-22 | Jan-23 | | Petrol | ₹/litre | 102.87 | 102.92 | 102.92 | 0.0 | 0.0 | | Diesel | ₹/litre | 90.51 | 92.72 | 92.72 | 0.0 | 0.0 | | Kerosene (subsidised) | ₹/litre | 36.56 | 59.00 | 53.67 | -0.6 | -9.0 | | LPG (non-subsidised) | ₹/cylinder | 910.13 | 1063.25 | 1063.25 | 0.0 | 0.0 | Note: Other than kerosene, prices represent the average Indian Oil Corporation Limited (IOCL) prices in four major metros (Delhi, Kolkata, Mumbai and Chennai). For kerosene, prices denote the average of the subsidised prices in Kolkata, Mumbai and Chennai.
Sources: IOCL; Petroleum Planning and Analysis Cell (PPAC); and RBI staff estimates. | Retail selling prices of petrol and diesel in the four major metros remained steady in January so far. While LPG prices were kept unchanged, kerosene prices decreased sharply reflecting the pass through of the fall in international prices (Table 3). Input costs, as reflected in the PMIs, increased across manufacturing and services in December 2022. Selling prices also edged up across the two sectors, with manufacturing registering a faster pace of expansion (Chart 35). IV. Financial Conditions Prevailing surplus liquidity conditions were interrupted by outflows in the banking system via payments under goods and services tax (GST) and quarterly advance tax, before increased government spending towards the end of the month helped ease the strain. Reflecting these developments, average daily absorption under the liquidity adjustment facility (LAF) narrowed to ₹1.5 lakh crore during December 12 through January 15, 2023 from ₹1.9 lakh crore during mid-November through December 11, 2022. The overnight standing deposit facility (SDF) absorbed ₹1.3 lakh crore, while variable rate reverse repo (VRRR) auctions accounted for the rest (Chart 36). Declining surplus liquidity prompted a few banks to take recourse to the marginal standing facility (MSF), which rose to ₹33,224 crore on December 30, the highest in nearly two months. On a net basis (adjusted for repo and MSF), average absorption declined to ₹0.6 lakh crore during the period under review from ₹1.0 lakh crore in the preceding period. Reflecting the tightness in liquidity conditions, the fortnightly variable reverse repo rate (VRRR) auction fetched a lower amount of ₹13,453 crore on December 16 and ₹27,084 crore for the fortnight beginning December 30, 2022.
In response to these quarter-end pressures on liquidity, the weighted average call rate (WACR) hovered closer to the upper band of the LAF corridor, but declined thereafter as liquidity conditions eased. During the period under review, the WACR averaged 6.25 per cent, aligning with the prevailing policy repo rate (Chart 37a). Rates in the collateralised segment mirrored the movement in the WACR, with triparty and market repo rates trading closer to the policy repo rate. Across the term money segment, rates on 3-month treasury bill (T-bill) traded 14 bps below the MSF rate, while 3-month certificates of deposit (CDs) and 3-month commercial paper (CP) rates averaged 41 bps and 71 bps, respectively, above the MSF rate (Chart 37b). The average risk premium in the money market (measured as the spread between 3-month CPs and 91-day treasury bill) at 85 bps was lower than 88 bps during November 15-December 9, reflecting stable funding conditions. In the primary market, fund mobilisation through CD issuances has been robust at ₹4.9 lakh crore during the year so far (up to December 30), considerably higher than ₹0.9 lakh crore for the corresponding period last year. This reflects banks’ additional demand for funds to bridge the funding gap between buoyant credit offtake and modest deposit growth. Furthermore, banks also raised funds through bond issuances, which surged to ₹0.9 lakh crore in the first nine months of 2022-23, as against ₹0.7 lakh crore during 2021-22. On the other hand, CP issuances have declined to ₹10.5 lakh crore during the year so far (up to December 31) from ₹16.2 lakh crore for the corresponding period a year ago, as the appetite for bank credit improved. 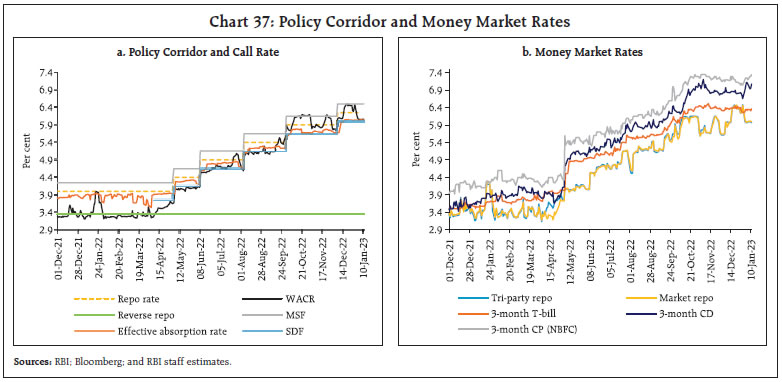
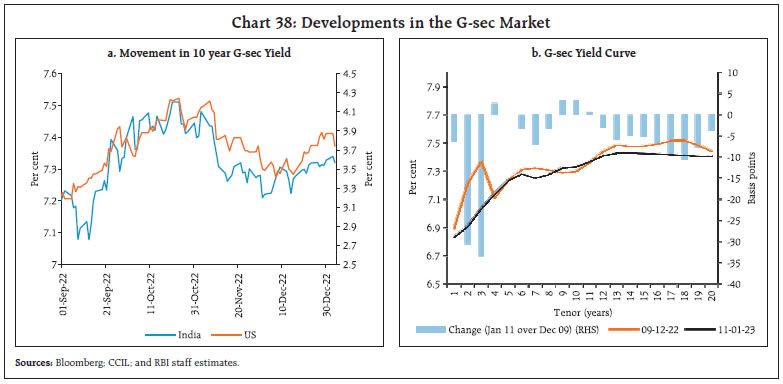 In the fixed income market, the yield on the 10-year G-sec benchmark gradually firmed up in tandem with rising US treasury yields, which surged after Japan unexpectedly raised its cap on 10-year Japanese government bond yields, triggering a sell-off in global bond markets. The yield on the 10-year G-sec benchmark hardened from a low of 7.22 per cent at the close on December 14 to 7.3 per cent on January 13, 2023 (Chart 38a). Across the term structure, G-sec yields moderated sharply at the short-end of the yield curve, which is indicative of lower rate hike expectations (Chart 38b). While long-term yields are more influenced by global factors during the current policy tightening cycle, domestic policy measures seem to have a larger bearing on short-term rates. Corporate bond yields and spreads remained stable across the rating spectrum (Table 4). | Table 4: Financial Markets - Rates and Spread | | Instrument | Interest Rates (per cent) | Spread (bps) (Over Corresponding Risk-free Rate) | | Nov 15 – Dec 12, 2022 | Dec 13, 2022 – Jan 10, 2023 | Variation (in bps) | Nov 15 – Dec 12, 2022 | Dec 13, 2022 – Jan 10, 2023 | Variation (in bps) | | 1 | 2 | 3 | (4 = 3-2) | 5 | 6 | (7 = 6-5) | | Corporate Bonds | | | | | | | | (i) AAA (1-year) | 7.82 | 7.88 | 6 | 88 | 91 | 3 | | (ii) AAA (3-year) | 7.69 | 7.77 | 8 | 43 | 57 | 14 | | (iii) AAA (5-year) | 7.78 | 7.77 | -1 | 48 | 40 | -8 | | (iv) AA (3-year) | 8.40 | 8.48 | 8 | 115 | 129 | 14 | | (v) BBB-(3-year) | 12.06 | 12.14 | 8 | 481 | 494 | 13 | Note: Yields and spreads are computed as monthly averages.
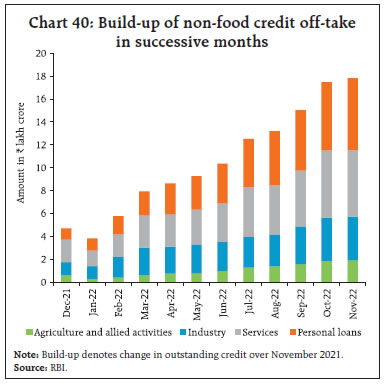
Sources: FIMMDA; and Bloomberg. | Reserve money (RM) excluding the first-round impact of change in cash reserve ratio (CRR) increased by 9.3 per cent on a y-o-y basis as on January 6, 2023 (7.7 per cent a year ago) (Chart 39). Currency in circulation (CiC) – the largest component of RM – recorded a growth of 7.9 per cent same as a year ago. Money supply (M3) grew by 8.7 per cent as on December 30, 2022 (9.9 per cent a year ago), primarily driven by its largest component – aggregate deposits with banks – which grew by 8.7 per cent (10.3 per cent a year ago). Scheduled commercial banks’ (SCBs’) credit, which has registered double digit growth since April 2022, stood at 14.9 per cent on December 30, 2022 (9.3 per cent a year ago). Non-food credit growth has been broad-based across sectors, led by retail loans and loans to the services sector (Chart 40). Credit to agriculture and allied activities grew sequentially, aided by a higher agriculture lending target and the priority sector push. Industrial credit outstanding rose to ₹32.9 lakh crore in November 2022 as against the pre-Covid level of ₹28.7 lakh crore in February 2020. Micro, small, and medium enterprises’ (MSMEs) share in industrial credit increased to 23.7 per cent from 17.7 per cent during the period. This also benefitted from the policy focus on MSME lending in the wake of the pandemic. Large industries credit offtake posted a turnaround with positive momentum. Among sectors, metal products and construction were the key drivers. Contribution to momentum by the services sector has been strong during the current financial year, boosted by non-banking financial companies (NBFCs). 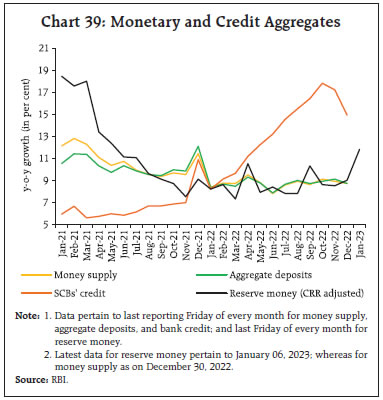
 Households continue to adapt to the COVID-19 environment and the pickup in housing loan demand has further strengthened retail credit demand. The growth in other consumer credit segments like vehicles, credit cards and consumer durables is also gathering pace attaining the pre-COVID-19 growth. The relatively better asset quality16 in the retail segment also appears to be contributing to banks’ focus on this segment. While housing loans are the major contributors to the momentum of retail credit a pick-up in other individual small-ticket loans and vehicle loans is also visible (Chart 41). 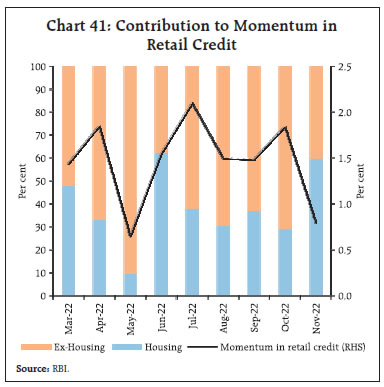 Lending and deposit rates of SCBs have continued to move higher since May 2022 in response to the 225 bps increase in the policy repo rate. During May to December 2022, the external benchmark-based lending rate and the 1-year median marginal cost of funds-based lending rate (MCLR) increased by 225 bps and 107 bps, respectively. Overall, the weighted average lending rate (WALR) on fresh and outstanding rupee loans rose by 135 bps and 71 bps, respectively, during May to November 2022. On the deposit side, the median term deposit rate (card rates) on fresh retail deposits increased by 75 bps during May to December 2022 (Table 5). During the current tightening period, the increase in WALR on fresh loans was higher in the case of public sector banks, while the increase in WADTDR on outstanding deposits and weighted average domestic term deposit rate (WADTDR) on outstanding loans was higher for private banks during May to November 2022 (Table 6). | Table 5: Transmission from Repo Rate to Deposit and Lending Rates of SCBs | | (Variation in basis points) | | Period | Repo rate | Term Deposit Rates | Lending Rates | | Median TDR – Fresh Retail Deposits | WADTDR – Outstanding Deposits | 1-Year Median MCLR | WALR – Outstanding Rupee Loans | WALR – Fresh Rupee Loans | | February 2019 to March 2022 (Easing Phase) | -250 | -208 | -188 | -155 | -150 | -232 | | May to November/December 2022* (Tightening period) | 225 | 75 | 59 | 107 | 71 | 135 | Note: 1. *: Data on WALRs and WADTDR are up to November; and data on Median TDR, MCLR and repo rate are up to December.
2. WALR: Weighted Average Lending Rate. WADTDR: Weighted Average Domestic Term Deposit Rate; TDR: Term Deposit Rate; and MCLR: Marginal Cost of Funds based Lending Rate.
Source: RBI. |
| Table 6: Transmission to Lending and Deposit Rates across Bank Groups | | (Variation in basis points) | | | February 2019 - March 2022 | May to November 2022 | | Repo Rate | WALR – Outstanding Rupee Loans | WALR – Fresh Rupee Loans | WADTDR – Outstanding deposits | Repo Rate | WALR – Outstanding Rupee Loans | WALR – Fresh Rupee Loans | WADTDR – Outstanding Deposits | | Public sector banks | | -153 | -252 | -169 | | 59 | 149 | 51 | | Private banks | -250 | -141 | -188 | -211 | +190 | 82 | 101 | 59 | | SCBs# | | -150 | -232 | -188 | | 71 | 135 | 59 | #: SCBs include public, private, and foreign banks.
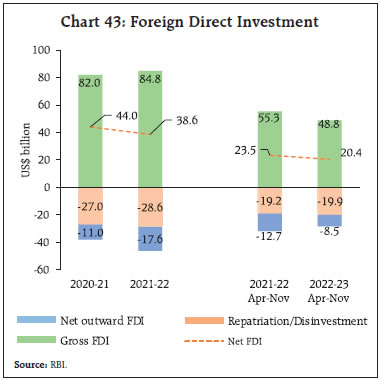
Source: RBI. | Interest rates on various small savings instruments (SSIs) – which are fixed on a quarterly basis with a spread of 0-100 bps over and above G-sec yields of comparable maturities – have been revised upwards in the range of 20-110 bps for Q4:2022-23. The increase in rates on SSIs may pose competition to banks for raising deposits, and banks may be prompted to further increase their retail deposit rates. The BSE Sensex and Nifty 50 closed at all-time highs of 63,284 and 18,812, respectively, on December 1, 2022, but declined subsequently in the month tracking weak cues from global markets (Chart 42). Sentiment was muted amidst prevailing uncertainty regarding the global outlook and hawkish commentary by major central banks on terminal rates. Furthermore, the resurgence of COVID-19 cases in some parts of the world also led to intermittent bouts of volatility. The BSE Sensex and Nifty 50 declined by 3.6 per cent and 3.5 per cent, respectively, during December 2022. Overall, the Indian equity market outperformed most global peers during 2022, on the back of inter alia sustained support from domestic institutional investors (DIIs). It has been found that in the recent period the sensitivity of equity returns in India to FPI flows has declined (Annex 1). In the beginning of January 2023, Indian equities were volatile ahead of the release of the US FOMC minutes. The benchmark indices bounced back, subsequently, taking positive cues from global market expectations of slower policy rate hikes in the US. The gains could not be sustained, however, and the BSE Sensex and Nifty 50 declined by 1.2 per cent each during January 2023 so far to close at 60,093 and 17,895, respectively, on January 16, 2023. Gross inward foreign direct investment (FDI) moderated to US$ 48.8 billion during April-November 2022 from US$ 55.3 billion a year ago (Chart 43). The majority of FDI equity inflows was received by manufacturing, computer services, financial services, retail and wholesale trade and communication services. Singapore, Mauritius, and the US were the major source countries of FDI during this period. Net FDI decreased to US$ 20.4 billion during this period from US$ 23.5 billion a year ago, mainly due to a moderation in gross FDI flows and an increase in repatriation of FDI. 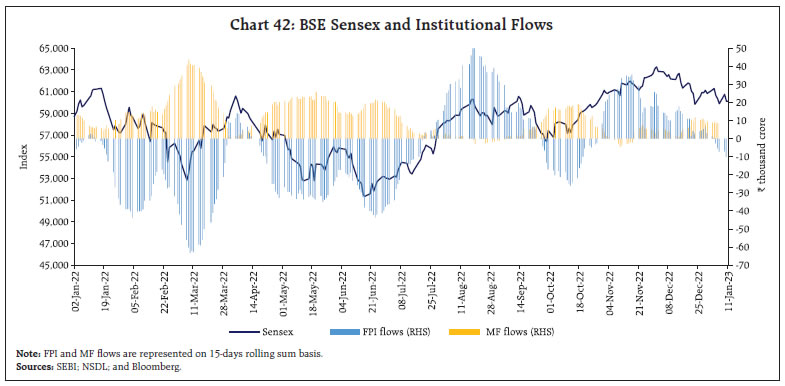
 FPIs turned net sellers in domestic financial markets in December 2022 (Chart 44), with net outflows to the tune of US$ 0.6 billion in that month alone, equally distributed between equity and debt segments. Within equity, outflows were reported in information technology (IT), oil, gas and consumable fuels, and power sector stocks whereas fast-moving consumer goods, consumer services and realty sectors attracted fresh investments. In January 2023 (up to 13th), net sales by FPIs were to the tune of US$ 1.9 billion. 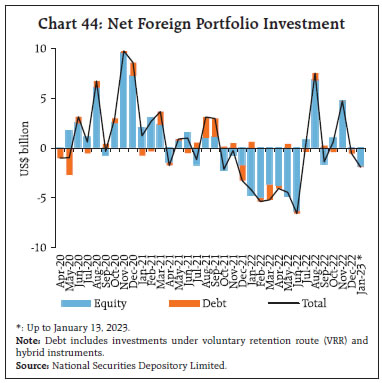 Gross disbursements of external commercial borrowings (ECBs) to India at US$ 13.4 billion during April-November 2022 moderated from US$ 17.0 billion a year ago. On a net basis, ECBs recorded outflows of US$ 2.9 billion as against net disbursement of US$ 6.2 billion in the previous year (Chart 45). The share of ECB used for new projects and import of capital goods increased during 2022-23 so far as compared to the previous year (Chart 46). During November 2022, ECBs were mainly raised for local sourcing of capital goods, import of capital goods and new projects. Lower spreads of weighted average interest rates on ECB loans over global benchmarks rendered them attractive, despite increases in the benchmark London interbank offer rate (LIBOR) and the secured overnight financing rate (SOFR) by 329 bps and 354 bps, respectively, during April-November 2022 (Chart 47).
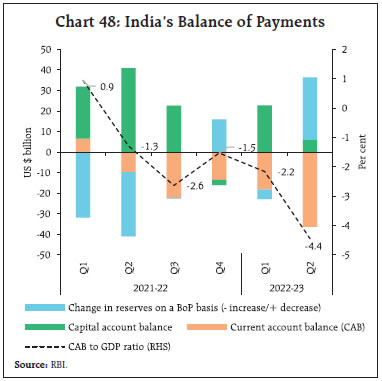
With the merchandise trade deficit reaching an all-time high of US$ 83.5 billion in a quarter, and an increase in net outgo from the income account, the current account deficit (CAD) increased to 4.4 per cent of GDP in Q2:2022-23. It is noteworthy, however, that the CAD for Q1 was revised down from 2.8 per cent to 2.2 per cent on account of downward adjustment in customs data. Similar adjustments may impinge on the CAD for Q2:2022-23 as customs data or imports are revised (Chart 48). 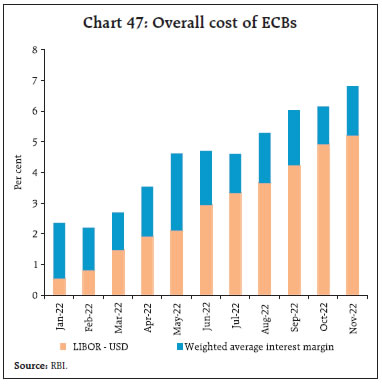
 India’s external debt to GDP ratio declined to 19.2 per cent at end-September 2022 from 19.3 per cent at end-June 2022, mainly reflecting the valuation gains arising due to the appreciation of the US dollar vis-à-vis major currencies. While India’s net international investment position (i.e., net claims of non-residents on India) increased moderately and the ratio of short-term debt (on residual maturity basis) to foreign exchange reserves increased, most vulnerability indicators remained lower than their levels observed during the taper tantrum (Chart 49). India’s foreign exchange reserves increased by US$ 28.9 billion since end-September 2022 and stood at US$ 561.6 billion as on January 6, 2023, covering more than nine months of imports projected for 2022-23 (Chart 50). Amidst a hawkish stance by US Fed and sell-off by FPIs, the Indian rupee depreciated by 0.8 per cent vis-à-vis the US dollar (m-o-m) in December 2022 (Chart 51). The Indian rupee depreciated by 3.0 per cent in terms of the 40-currency real effective exchange rate (REER) in December 2022 (m-o-m) (Chart 52).
Payment Systems Digital payments sustained healthy acceleration in 2022, increasing by 63 per cent and 19 per cent (y-o-y) in volume and value terms, respectively.17 Both large-value and retail segments recorded robust growth (y-o-y) in December (Table 7). Transaction values processed under the Real Time Gross Settlement (RTGS) continued to accelerate, while volumes rose to 2.15 crore, i.e., the highest in the current financial year so far. Payments under the Unified Payments Interface (UPI) mode also expanded strongly, owing to resurgence in travel and proliferation of omnichannel commerce. The total value of card payments (through debit cards, credit cards and prepaid payment instruments) increased by 48 per cent, while cash withdrawals from ATMs (through the National Financial Switch and micro ATMs) declined by 2.3 per cent (y-o-y) (between December 31, 2022 to January 2, 2023). For the week ending January 6, CIC grew 7.9 per cent (y-o-y), i.e., recording single-digit growth for 75 weeks since August 202118 and averaging 8.6 per cent. 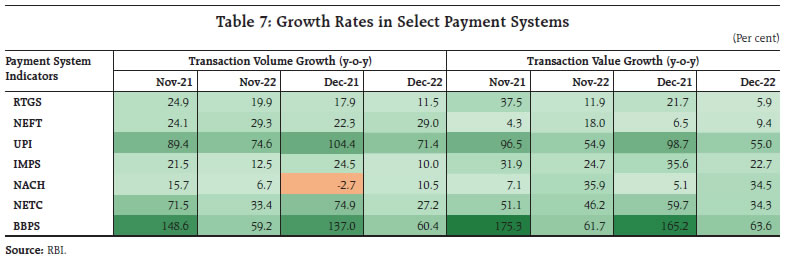 Fundraising by the Fintech sector tapered to US$ 4.2 billion during 2022 (upto Q3), halving from the peak of US$ 8 billion reached in the previous year (Chart 53). This is indicative of shifting investor focus toward basic profitability levels and financially stable business models. Going ahead, latest initiatives such as the launch of the Open Network for Digital Commerce (ONDC)19 and the roll-out of 5G services are expected to drive the Indian digital economy through the ongoing ‘techade’. On the regulatory front, the Reserve Bank migrated reporting of payment frauds to ‘DAKSH’ – Advanced Supervisory Monitoring System, with effect from January 1, 2023. In addition to the existing bulk upload facility, DAKSH provides additional functionalities including inter alia maker-checker facility, online screen-based reporting, facility to issue alerts/advisories to regulated entities, and generation of dashboards and reports. The move is expected to streamline fraud reporting, augment efficiency, automate the payments fraud management system and make supervisory processes more robust. Under the fourth Regulatory Sandbox (RS) cohort on ‘Prevention and Mitigation of Financial Frauds’, the Reserve Bank has selected six entities for the test phase commencing from February 2023. 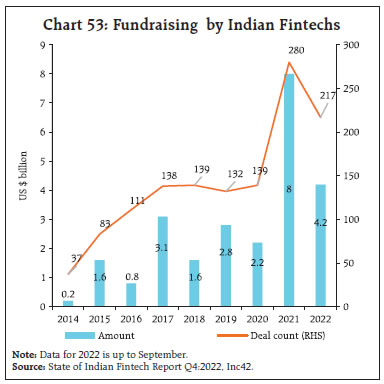 In yet another step towards building a robust digital payment ecosystem, the Union Cabinet has approved a ₹2,600 crore scheme for promoting RuPay debit cards and low-value BHIM-UPI transactions. Under the scheme, banks will be provided financial incentives for promoting Point of Sale (PoS) and e-commerce transactions using RuPay and UPI in the current financial year. As part of India’s G20 Presidency, the Ministry of Electronics and Information Technology (MeitY) launched the ‘Stay Safe Online’ campaign and the ‘G20 Digital Innovation Alliance’ (G20-DIA) in December 2022. These initiatives aim at unlocking the true potential of digital integration through innovations, enhanced safety measures, and building a future-ready digitally skilled workforce. Conclusion The foregoing discussion on the global outlook and early developments, both globally and domestically, brings into sharp relief: what does 2023 hold for India? The prospect of India as a bright spot amidst 2023’s encircling gloom is burnished by most recent history and current developments. By cross-country standards, the Indian economy exhibited resilience through 2022 in the face of the triad of shocks – war; monetary policy tightening; and recurring waves of the pandemic. An important factor in the overall outcome has been the measured responses of monetary and fiscal policies in sharp contrast to the aggressive tightening worldwide. The year 2023-24 may see deceleration in real GDP growth from 7 per cent in 2022-23 (NSO estimates) to 6.5 per cent as projected in the RBI’s monetary policy report of September 2022. At current prices and exchange rates, therefore, India will be a US$ 3.7 trillion economy in 2023, maintaining its lead over the UK as the fifth largest economy of the world. According to the IMF’s calculations, India will move into fourth place in 2025 and into the third place in 2027 as a US$ 5.4 trillion economy. Even diehard disparagers acknowledge that ‘India has a compelling story - a vibrant IT-services industry, a burgeoning domestic tech economy, an increasingly attractive location for global manufacturers and strong economic growth’20. India is onshoring too. In the process, it is striving to build a global manufacturing hub and a preferred habitat for companies to shift their production bases. Turning to early developments in 2023, macroeconomic stability is getting further entrenched. Recent data arrivals indicate that the first milestone of monetary policy is being passed – bringing inflation into the tolerance band. The objective during 2023 is to tether inflation therein so that it aligns with the target by 2024 – the second milestone. Fiscal consolidation is underway at central and sub-national levels, graduated to nurture the pace of the economic recovery. Lead indicators suggest that the current account deficit is on course to narrow through the rest of 2022 and 2023. India’s stock markets stood out in 2022 and continue to outperform peers on the strength of macroeconomic fundamentals and retail participation. Furthermore, early bird results declared by 35 non-financial sector companies21 - mostly information technology (IT) sector companies – show that revenues were robust in Q3:2022-23 (October-December 2022), with the depreciation of the INR providing tailwinds. Softening of commodity prices and other costs have eased expenditure slightly. As a result, both operating and net profits have improved, the latter in spite of a decline in other income on account of treasury losses. In closing, 2023 may well be the opening ajar of a window in which India’s time on the world stage is arriving. In April 2023, India’s population will be the largest in the world, projected at 1.4 billion. A sixth of the increase of the world’s population of working age (15-64) people between 2023 and 2050 will be Indians. Coupled with a median age of 28, this is India’s chance to seize the demographic dividend and herald its emergence as an economic powerhouse of the future.
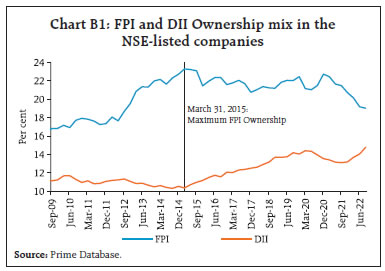
Annex 1 Impact of FPI Flows in Indian Equity Markets The ownership of foreign portfolio investors (FPIs) in Indian equities has been declining from the peak share of 23.3 per cent in March 2015 to 19.0 per cent by end-September 2022 (Chart B1). Contemporaneously, the ownership of domestic institutional investors (DIIs), including domestic mutual funds, insurance companies, and pension funds, etc., increased from 10.4 per cent to 14.8 per cent as DII inflows outpaced FPI inflows (Chart B2). Drawing on the literature which documents a strong positive relationship between unexpected investor flows and market returns (Warther, 1995; Ananthnarayanan et al., 2009; Acharya et al., 2022; and Boyer and Zheng, 2009), weekly normalised FPI flows to India are decomposed into expected and unexpected flows by estimating a five variable VAR as in (1) using data from January 2008 to December 2022: 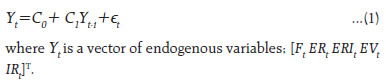
The residuals from the equation corresponding to Ft are extracted as unexpected FPI flows. Furthermore, bivariate vector autoregressive (VARs) models are estimated by using unexpected FPI flows and returns on the Nifty 50 index, Nifty Midcap index and the Nifty Smallcap index respectively. The bivariate VARs are estimated separately for two sub-samples – before and after March 2015. The results indicate that before March 2015, the impact of a unit unexpected increase (decrease) in FPI flows led to an increase (decrease) in market returns (Nifty 50, Nifty Midcap and Nifty Smallcap) in the range of 2.2 to 3.0 per cent over the next 2-3 months. Since March 2015, however, the impact has declined to a range of 1.25 to 1.50 per cent indicating the declining influence of FPIs in affecting market returns. While earlier the impact was more on the Nifty Midcap and Nifty Smallcap, the impact is more symmetrically felt now (Chart 1). | Variable | Description | | Ft | FPI flows normalised by the previous 12-week rolling average of the total market capitalisation | | ERt | Excess returns of NSE 500 index over the MSCI EM index in US dollar terms | | ERIt | Excess short-term risk measured as the difference between the Nifty VIX and the US CBOE VIX | | EVt | Valuation of the Indian market relative to other emerging markets, measured as the difference between the price-earnings ratio of the NSE500 index and the MSCI EM index | | IRt | Interest rate differential between India and foreign markets measured as the difference between the 3-month t-bill rates of India and the US |
References: Acharya, V. V., V. R. Anshuman, and K. K. Kumar. (2022). Foreign Fund Flows and Equity Prices during the COVID-19 Pandemic: Evidence from India. ADBI Working Paper 1333. Tokyo: Asian Development Bank Institute. Ananthanarayanan, S., Krishnamurti, C., & Sen, N. (2009). Foreign institutional investors and security returns: Evidence from Indian stock exchanges. In Proceedings of the 7th INFINITI conference on international finance 2009-credit markets, credit institutions and macroeconomic volatility. Trinity College, School of Business. Boyer, B., & Zheng, L. (2009). Investor flows and stock market returns. Journal of Empirical Finance, 16(1), 87-100. Warther, Vincent A., (1995), “Aggregate Mutual Fund Flows and Security Returns”, Journal of Financial Economics, 39.
|