Global economic activity has sustained its growth momentum in the second quarter of 2023, albeit with two diverging roads. While economies like India are rebounding, some others are slowing or contracting. India’s real GDP growth in Q4:2022-23 at 6.1 per cent was the highest among major economies of the world, and CPI inflation came down to a 25-month low of 4.3 per cent in May 2023. Kharif sowing has begun on the back of a record rabi harvest, and the manufacturing sector has posted a pick-up in net profits. Credit growth is rebasing to more durable sources of funding, and the Indian rupee is turning out to be the most stable currency among emerging market peers. Introduction The global economy is exhibiting surprising tensility, cresting the tidal waves unleashed by banking collapses, resolute monetary tightening and the prolonging geopolitical conflict. Estimates available in early June 2023 indicate that global economic activity gathered pace in the first quarter of 2023 after slowing in the preceding quarter – the Organization of Economic Cooperation and Development (OECD) calculates that global GDP growth accelerated to an annualised rate of over 3 per cent in January-March 2023 from just 2 per cent in the fourth quarter of 2022. High frequency indicators suggest that this momentum of global growth has been sustained in the second quarter of 2023 – the world composite purchasing managers’ indices (PMIs) rose to an 18-month high in May, powered by the vibrancy of the services sector. The pick-up in speed is fragile, with mixed outcomes across jurisdictions, including recessionary developments in a few of them; yet, the odds of an upturn are so high that it evokes hope – the future may be brighter than we think it is today. Some of it is due to the decline in commodity prices and abating supply chain pressures. Global food prices have fallen to their lowest levels in two years, with declines in prices of grains, vegetable oil and dairy offsetting higher sugar and meat prices. This is reviving hopes that sticky inflation will start to ease, although the pass-through to consumers is taking time with transportation, labour and energy costs remaining relatively high. Agricultural prices could fall even further in the rest of 2023 – by 7.2 per cent projected by the World Bank for 2023 and further by 2 per cent in 2024. While inflation remains generally elevated relative to targets, it has started to relent, emboldening some central banks to sight the light at the end of the tunnel and breathe easier on monetary policy stances. Major economies have borne well the headwinds assailing the global economy, and some like India have rebounded strongly. The optimism generated by these developments has started to infuence the forecasts. In June, both the OECD and the World Bank have modestly upgraded their outlooks for 2023, indicative of a directional shift in their view of the world. World trade is suffering, however, under the brunt of fissures opened up by rising protectionism in industrial and trade policies, reordering of global value chains and the fragmentation in finance and technology flows that is also impacting foreign direct investment. According to the OECD, global trade volumes recovered hesitantly in the first quarter of 2023 on the back of booming demand for traded services. On the other hand, the World Bank pointed to the slowing of global merchandise trade growth in the first half of 2023 in tandem with weakening industrial production. The gradual rotation of demand back to its pre-pandemic composition of goods and services from the pandemic-induced expansion in demand for tradeable goods and away from less trade-intensive services could also be slowing world trade. Transport prices and shipping volumes are weak and survey measures point to muted manufacturing export orders, although service export orders continue to improve. Accordingly, trade volumes are expected by the OECD to slow to a third of the growth recorded in the preceding year. The World Bank also affirmed that global trade volume growth (including goods and nonfactor services) would slump from 6.0 per cent in 2022 to barely 1.7 per cent in 2023. From a medium-term perspective, the secular shrinking of openness that took hold from 2012 and intensified from 2018, may be signaling the ending of the glorious era of globalisation that had powered the global economy since the 1980s. The growth prospects of emerging market economies (EMEs) are particularly at risk as the trade engine sputters after decades of energising their integration into the global economy and lifting them to higher trajectories of growth and productivity than when they were relatively closed. The global financial landscape, which is recouping from the reverberations of banking failures in March, was calmed by the resolution of the debt ceiling impasse in the US. Financial markets responded positively, with a slight dip in the US dollar providing a small upside to emerging market currencies, stocks edging higher and bond yields dropping. In the ensuing days, fears of further tightening of financial conditions have overwhelmed this initial enthusiasm as hawkish monetary policy guidance foretells of further interest rate increases even after a pause, and investors brace for a wall of treasury issuances of close to US$ 1 trillion and a deluge of corporate bond offerings which were held back ahead of the fractious debt ceiling negotiations. In other noteworthy financial developments, the world’s most important crude oil price benchmark – Brent – will for the first time starting June 8, include in its calculations crude oil prices from the US – West Texas Intermediate Midland crude - marking the maiden inclusion of a non-North Sea variety into the global pricing standard. Analysts believe that the addition of cheaper US crude will lower average prices globally, which is a positive for net oil importers like India. It could also impact financial flows by changing the funneling of investments into derivatives traded on US exchanges and this could impact prices of futures globally. In terms of geopolitics, this move is a recognition of the shale revolution which has made the US the world’s biggest exporter of crude. This could provide an effective counterpoise to the oligopolistic power exerted by OPEC plus from time to time. From July 1, market participants have been asked by the UK’s Financial Conduct Authority to stop using the London Inter-Bank Offer Rate (LIBOR) as a benchmark, bringing to end five decades of its widespread use in pricing a range of financial instruments. The main challenge that market agents face is identifying and adopting suitable alternative reference rates (ARRs). Transitioning from LIBOR also requires making significant adjustments to internal systems, processes and models. The choice of ARR also poses challenges of market liquidity and product availability, which can lead to market inefficiencies and pricing difficulties as well as availability of certain financial products – illustratively, substantial proportion of the junk loan market is shackled to the LIBOR. Regulators, banks and financial institutions need to educate users about the imminent change and provide guidance on how to navigate the transition. LIBOR transition will also involve steering through complex legal and regulatory processes. Underlying the tenacious growth momentum in the global economy are two diverging roads among major economies, with some of them like India rebounding and others slowing or contracting. The provisional estimates of national income for 2022-23 released by the National Statistical Office (NSO) on May 31, 2023 have muted the Cassandras and borne out the cautious optimism expressed in this article in its February and March editions. Already, the NSO’s release has triggered a flurry of upward revisions, recalibration of balance of risks and widening of forecast ranges relating to India’s growth rate for 2023-24, outside our borders and within. When meaningful factual international comparison is feasible, it may show that India’s January-March 2023 quarter real GDP growth was the highest among major economies of the world. Its quarter-on-quarter momentum at 8.4 per cent is the highest in any quarter of 2022-23; this is true even on a seasonally adjusted basis. If this is a precursor of the year ahead, the bright spots on the aggregate supply side are likely to be manufacturing and construction, alongside the sustained buoyancy in services that became evident through 2022-23. Manufacturing posted a pick-up in net profits in January-March for the first time, after three consecutive quarters of slowdown in profitability. This uptick is attributable primarily to easing of input costs, which augurs well for the manufacturing sector if it can expand revenues more vigorously in the tailwinds of the momentum of growth in the economy. In the construction sector, there seems to be a sustained ebullience, fuelled by public spending on capital expenditure (capex), including by public sector undertakings, and surging launches and sale of residential housing units. Services, which constitute more than 60 per cent of the gross value added in the economy, are likely to sustain their post-pandemic resurgence. Travel platforms, airlines and hotel chains are reporting strong summer demand in spite of high air fares on both domestic and international routes, and hotel tariffs are already on par with pre-pandemic levels. In the e-commerce space, the open network for digital commerce (ONDC) may well turn out to be a gamechanger by creating a standardised digital commerce infrastructure for the entire ecosystem. By easing access for consumers and small businesses, it could substantially boost gross value added by the trade sector, accelerate overall economic growth and reap productivity gains. In other parts of the economy, both manufacturing and construction are employment-intensive, with backward and forward linkages with the other sectors of the economy propagating the positive externalities associated with their strong performance so far. Consumer confidence is rising and businesses expressed optimism on production, order books, employment, capacity utilisation and the overall business situation in the second and third quarters of 2023-24 in the RBI’s latest consumer confidence and industrial outlook surveys. Turning to agriculture, the southwest monsoon finally made landfall in Kerala on on June 8, 2023. As per the latest assessment (June 21), it continues to advance into the southern and eastern regions of the country after a hiatus on account of the impact of cyclone Biparjoy. Kharif sowing has begun on the back of a record rabi harvest and higher year-on-year mandi arrivals. Wheat procurement is 39.5 per cent higher than the full season procurement last year. Revision in minimum support prices for 14 major kharif crops were announced on June 7, 2023 translating to an effective increase of 7.5 per cent in procurement prices. While this may translate to an increase of 10-12 basis points in consumer price inflation, some of which is already factored into the RBI’s quarterly inflation projection for 2023-24, the timely announcement may lead to a positive supply response that offsets some of the retail price increase that occurs on the seasonal hardening of food prices ahead of the monsoon. Financial developments have kept pace with the vigour of macroeconomic activity. Loan loss provisioning for banks continued to fall for the fifth consecutive quarter in January-March in an environment of sustained collection efficiency and improving asset quality. The banking, financial services and insurance (BFSI) sectors as a whole reported another quarter of high double digit growth in revenue. Combined net profit of the BFSI sector rose more than 60 per cent, the best showing in four quarters. Expectedly, the BSE Bankex – index of banking companies – among the top 500 listed companies has outperformed the broader equity market indices. Responding to the strength of India’s macroeconomic and financial fundamentals, foreign portfolio investors have increased their holdings of Indian equity and debt in May 2023 to the highest level since August 2022, the highest among emerging market comparators. In the first half of June 2023 (upto June 19), close to US$ 1.3 billion of portfolio investment has flowed into Indian markets. Financial services, automobiles and fast moving consumer goods (FMCG) attracted the bulk of these investments. Indian stocks have started to outshine their emerging market peers, with the Morgan Stanley Capital International (MSCI) India index trading at an 8-month high premium to the MSCI emerging market index. Bond yields have traded in a tightly range-bound manner, indicating stable inflation expectations that affirm the downtrend in households’ inflation expectations since September 2022, as revealed in the RBI’s survey. The Indian rupee is turning out to be the most stable currency, at least among emerging market peers. Its implied volatility1, which is the metric that captures the market’s view of the likelihood of fluctuations in its value, is at its lowest since 2008. In the credit market, the wedge between growth rates of bank credit and deposits has started to narrow, suggesting that credit growth is rebasing to more durable sources of funding. Analysts have drawn attention to the transformation that India has undergone in less than a decade. India’s corporate tax rates are internationally comparable. Rapid formalisation of the economy is reflected in the surging ratio of digital transactions to GDP (76 per cent in 2022-23), the increase in housing launches spurred by the formalisation of contracts between builders and buyers under the real estate regulation and development act (RERA) and the expansion in direct benefit transfers. Macroeconomic stability has instilled investor interest, making India a preferred habitat for greenfield investment among emerging economies.2 The Annual Report of the Reserve Bank released on May 30, 2023 assessed that India’s growth momentum is likely to be sustained in 2023-24 with real GDP growth projected at 6.5 per cent on the back of sound macroeconomic policies, softer commodity prices, a robust financial sector, a healthy corporate sector, and new growth opportunities stemming from global realignment of supply chains. It also emphasised that it is important to sustain structural reforms to improve India’s medium-term growth potential. The report noted that the cumulative increase in the policy repo rate by 250 bps last year is steering the disinflationary process, along with supply side measures addressing transient demand-supply mismatch due to food and energy shocks, expectations of a stable exchange rate and a normal monsoon. Accordingly, headline inflation is likely to edge down to 5.1 per cent in 2023-24 from 6.7 per cent recorded last year. The Report noted that the Union Budget 2023-24 has prioritised capital expenditure to accelerate growth while maintaining fiscal prudence to strengthen macroeconomic stability. The forward-looking evaluation of India’s prospects set out in the Report indicates that while foreign portfolio investment (FPI) flows may remain volatile, the favourable domestic growth outlook, lower inflation, and business friendly policy reforms could help sustain buoyancy in FDI inflows while inward remittances are likely to remain robust. In the financial sector, Indian banks and non-banking financial intermediaries remain sound and resilient in the wake of recent financial sector turmoil in the US and Europe; yet, the need for stress testing for these new shocks as well as reviewing and strengthening capital and liquidity buffers was highlighted. The size of the Reserve Bank’s balance sheet increased by 2.5 per cent for the year ended March 31, 2023 with income rising by 47.1 per cent and expenditure by 14.0 per cent, recording an overall surplus of ₹87,416.22 crore (₹30,307.45 crore in the previous year). The surplus amount was transferred to the central government, after making provision of ₹1,30,875.75 crore towards the contingency fund to maintain the contingency risk buffer at 6.0 per cent of the balance sheet size. Set against this backdrop, the remainder of the article is structured into four sections. Section II sketches the rapidly evolving developments in the global economy. The evolution of the domestic economy is laid out in Section III. Section IV evaluates the domestic financial conditions, while the last Section sets out concluding remarks. II. Global Setting In the second quarter of 2023, the global economy has sustained the growth momentum achieved in the previous quarter, with easing supply chain pressures and receding dislocations in the commodity and energy markets. Our model-based nowcast for global GDP also points towards a marginal pick-up in global growth momentum during Q2:2023 (Chart 1). Economic performance, however, has remained uneven across geographies, with the Euro zone entering a technical recession in Q1:20233 weighed by stubborn inflation and high interest rates while in other parts of the global economy growth has remained resilient. In its latest economic outlook, OECD and the World Bank have both revised the global growth forecast for 2023 upwards while cautioning that the recovery may be slow-paced (Table 1). Among the high frequency indicators, the global composite PMI increased to 54.4 in May 2023. The global services PMI inched up to 55.5 in May from 55.4 in April, with expansion in output and new orders gathering pace. The global manufacturing PMI, however, remained unchanged at 49.6 in May, even though input costs decreased for the first time in three years (Chart 2a).
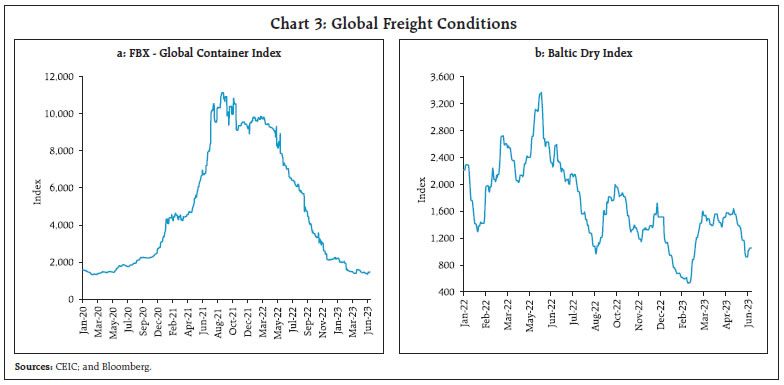
Global supply chain pressures eased further in May, as reflected in the global supply chain pressure index (GSCPI)4 declining for the fifth month in a row to its lowest level (since the series began in 1997) [Chart 2b]. Easing cost pressures were also reflected in the Freightos Baltic Index (FBX) – Global Container Index5 - which has been declining post the pandemic (Chart 3a). During the second half of May, the Baltic Dry Index6 declined sharply, reflecting a broad-based easing in its constituent indices – panamax; capesize; and supramax. However, it reversed its downward trajectory in June, buoyed by a pick-up in demand for capesize vessels (Chart 3b). Global commodity prices fell sharply in May 2023, as demand concerns over fear of recession in the select AEs resurfaced (Chart 4a). This was also reflected in the Food and Agriculture Organization (FAO) food price index which declined by 21.4 per cent (y-o-y) [Chart 4b]. 
 Crude oil prices moderated in May to an average of US$ 75.7 per barrel from US$ 84.1 per barrel in April, driven by slowing demand concerns (Chart 4c). Following Saudi Arabia’s decision to slash its production by 1 million barrels per day (mbpd), crude oil spot prices edged up by around 0.5 per cent on June 5 and remained volatile thereafter. Crude oil prices fell by 1.5 per cent on June 14 after the Fed inidicated the possibility of further interest rate hikes reacting to a stronger-than-expected economy and a slower decline in inflation. Data release showing unexpected large build-up of crude oil stockpiles also contributed to the decline in prices. Though futures are signalling lower crude oil spot prices, augmenting these forward-looking variables with real sector variables can enrich the forecasts of crude oil spot prices (Box). 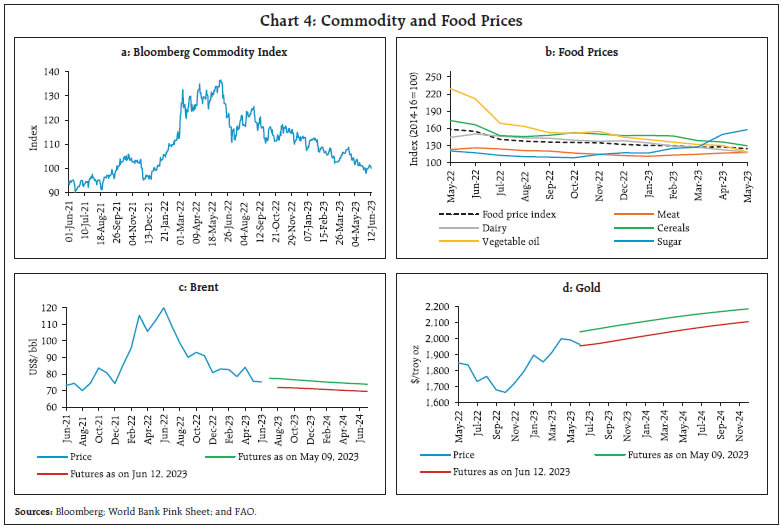 Gold prices, that were propelled higher by the banking crisis in the US and Europe, declined marginally in May as risks to the banking system abated. They have stayed rangebound in June so far (June 14, 2023) [Chart 4d]. Lower inflation expectations and profit booking by investors also contributed to the easing of gold prices. Inflation eased further across most economies. In May, consumer inflation cooled off in the US for the 11th consecutive month to 4 per cent (y-o-y). Inflation based on the US personal consumption expenditure (PCE) index, however, edged up to 4.4 per cent in April from 4.2 per cent in March (Chart 5a). In the UK, inflation remained unchanged at 8.7 per cent in May while Japan’s CPI (all items less fresh food) inflation edged up to 3.5 per cent in April after remaining steady at 3.3 per cent since February 2023. Inflation in the Euro area moderated to 6.1 per cent in May 2023 (from 7.0 per cent in April), its lowest level since February 2022. Among the EMEs, while inflation firmed up in May in Russia (2.5 per cent) and China (0.2 per cent), it fell in Brazil to 3.9 per cent (Chart 5b). Core inflation, however, remained stubbornly high, driven by services inflation and the prospect of sustained strong wage growth (Chart 5c and 5d). Global equity indices extended their gains into June so far (June 12, 2023) reacting to a surge in jobless claims and signs of easing inflation bolstering expectations of a more generalised pause in the rate hike cycle (Chart 6a). Volatility in bond markets spiked, with the 10-year G-sec yields in AEs hardening since late May despite softer economic data. In the US, yield curve inversion continued to persist, with the spread hovering around 80 bps in early June 2023 (Chart 6b). In the currency markets, the US dollar moved in tandem with expectations of the Fed’s monetary policy action – it appreciated in May but later shed those gains in June so far (June 14, 2023). The Morgan Stanley Capital International (MSCI) currency index for EMEs remained volatile and corrected by 0.9 per cent in May, but rebounded thereafter (Chart 6c and 6d). With the abatement of bank failure risks, the credit default swap (CDS) spreads for global systemically important banks (G-SIBs) have reverted to levels preceding these episodes (Chart 7).
With headline inflation softening, major central banks have shifted gears to a pause or relatively less aggressive rate hikes, while hinting at further rate hikes if warranted by incoming data (Chart 8a and 8b). In the US, the Federal Open Market Committee (FOMC) kept the policy rate unchanged in its latest meeting on June 14, allowing room for assessing additional information and its implications for monetary policy. In June, policy rates were raised by 25bps by the Euro Area, Australia and Canada. In the UK, policy rates were raised by 50bps to a fifteen year high as inflation continued to remain elevated. Most EMEs held their policy rate unchanged during May-June 2023 while China reduced its key rates by 10 bps for the first time since August 2022. 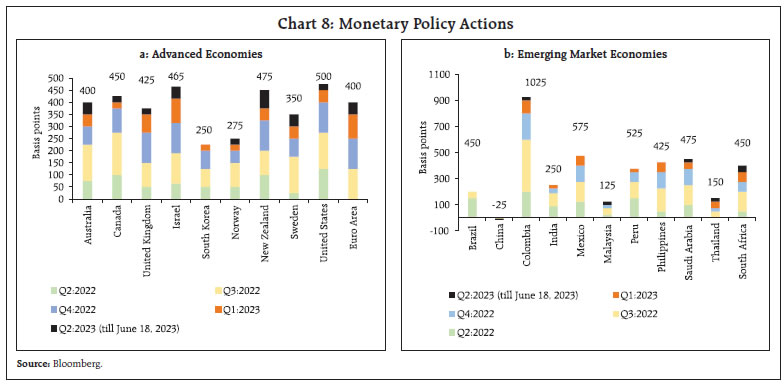
Box: Forecasting Crude Oil Price for India Futures prices are used to forecast spot crude oil prices as they are expected to factor in all available information at any given point in time. Their forecast performance, however, tends to be unstable, especially during periods when macroeconomic factors that drive oil price dynamics exhibit significant volatility. Drawing on work which adjusted the future prices for capacity utilisation rate in the US, which is considered as a forward-looking indicator of overall macroeconomic conditions and also shows high complementarity with energy consumption in the economy (Pagano and Pisani, 2009), crude oil prices for India can be forecasted with some modifications. First, capacity utilisation of other major oil consumers (China) is incorporated as an additional explanatory variable. Secondly, the quarterly average of Brent 3-month ahead futures prices, which is the more relevant price for India, is used to forecast the price of the Indian crude basket.7 
| Table B1: Adjusting Futures Prices for Capacity Utilisation | | | Coefficient | P-value | | Intercept | 87.50 | 0.206 | | CA_US | 1.26* | 0.046 | | CA_CN | -2.42** | 0.004 | *: Significant at 5% level, **: Significant at 1% level.
Note: The period considered is from Q1:2013, which is the first quarter for which capacity utilisation for China is available to Q1:2023, the latest available data. |
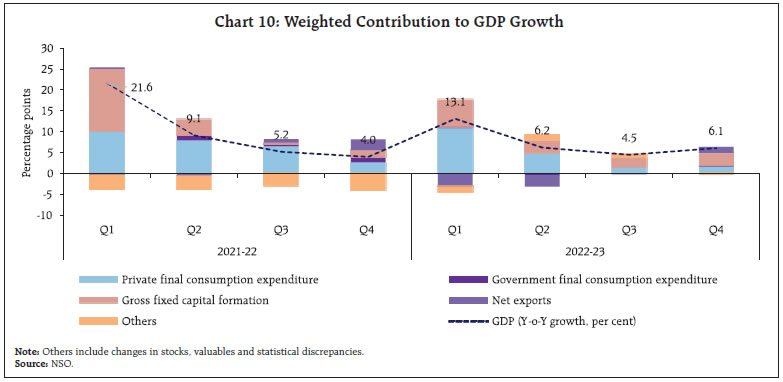
Given that adjusting for macroeconomic outcomes leads to improvement in forecast performance, an approach of pooling forward looking information from a variety of sources is called for while assessing the oil prices trajectory rather than relying solely on futures prices. References Pagano, P., & Pisani, M. (2009). “Risk-Adjusted Forecasts of Oil Prices,” European Central Bank Working Paper No.999. | III. Domestic Developments The Indian economy has sustained its growth momentum in 2023-24 so far, with favourable tailwinds from the index of supply chain pressure for India (ISPI) remaining below its historical average and overall economic activity, as captured by our economic activity index (EAI), remaining resilient (Chart 9a and 9b). Incorporating these, the GDP growth for Q1:2023-24 is nowcast at 7.9 per cent (Chart 9c). Aggregate Demand As per the NSO’s provisional estimates (PE) released on May 31, 2023, real gross domestic product (GDP) of the Indian economy grew by 7.2 per cent in 2022-23 [up from 7.0 per cent in the second advance estimates (SAE)]. The Government’s thrust on infrastructure helped boost growth in gross fixed capital formation (GFCF) to 11.4 per cent in 2022-23 (PE), expanding the GFCF/GDP ratio to 34.0 per cent from 32.7 per cent in the previous year. During Q4:2022-23, GDP growth had accelerated to 6.1 per cent (y-o-y) from 4.5 per cent in Q3:2022-23 (Chart 10). The seasonally adjusted annualised rate (SAAR) of real GDP also accelerated to 5.5 per cent in Q4 from 5.2 per cent in the preceding quarter. Among the components of real GDP, private final consumption expenditure (PFCE) remained subdued, registering a growth of 2.8 per cent but showed an improvement over the preceding quarter’s growth of 2.2 per cent. Government final consumption expenditure (GFCE) growth improved to 2.3 per cent in Q4, following contraction in Q2 and Q3. With construction activity gaining traction, GFCF growth stood robust at 8.9 per cent in Q4. This was mirrored in its proximate indicators, viz., steel consumption, production of cement and import of capital goods. The drag from the external sector narrowed to 0.1 per cent of GDP in Q4 as exports remained robust whereas imports moderated sharply following double digit growth in the first three quarters of 2022-23. 
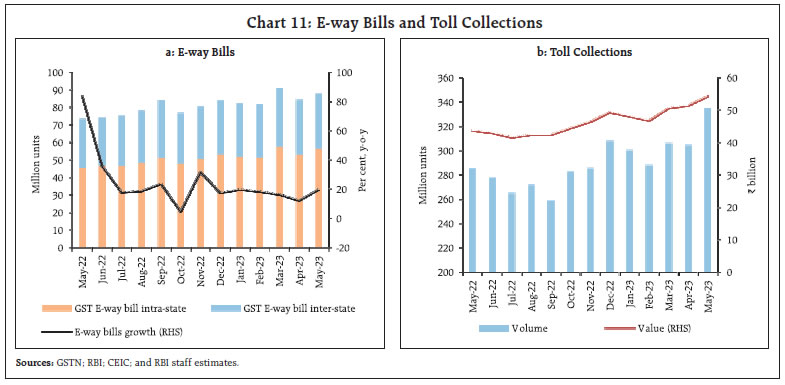
Among lead indicators of demand conditions, E-way bill volumes indicated heightened transportation activity in May, led by movement of goods within States (Chart 11a). Toll collections crossed 300 million in volume terms and amounted to ₹54 billion in May, with the FASTag system reaching a penetration rate of 97 per cent9 (Chart 11b). Automobile sales recorded a robust expansion of 17.9 per cent y-o-y in May 2023, with their highest ever sales of passenger cars (Chart 12a). Electric vehicle sales crossed the 1 lakh mark for the eighth consecutive month in May, driven by the rationalisation in Faster Adoption and Manufacturing of Electric Vehicles (FAME) subsidies, set to be effective from June 1. Sales of two wheelers accelerated in May. Tractor sales also improved after recording a dip a month ago (Chart 12b). Vehicle registrations picked up in May, led by non-transport vehicles. Retail sales of passenger vehicles improved on account of better availability, strong pending orders and robust demand (Chart 12c). The daily average consumption of petroleum products increased 4.5 per cent m-o-m in May, led by demand for transportation fuels (Chart 12d). In the hospitality sector, the hotel occupancy rate exhibited a sequential pick-up in April, despite steep hotel rates (Chart 13a). The average room rate (ARR) in April grew by 21 per cent (y-o-y) leading to growth (y-o-y) of 18 per cent in revenue per available room (RevPAR) [Chart 13b]. The all-India unemployment rate10 was at 7.7 per cent in May 2023, with a higher rate of unemployment observed in urban areas (Chart 14a). The labour force participation rate (LFPR) and the employment rate (ER), however, moderated to 39.6 and 36.6 per cent in May from 40.7 and 37.2 per cent, respectively, in the previous month (Chart 14b). The employment outlook in the organised sector, as polled by the PMI for manufacturing and services, recorded an expansion in May (Chart 15).
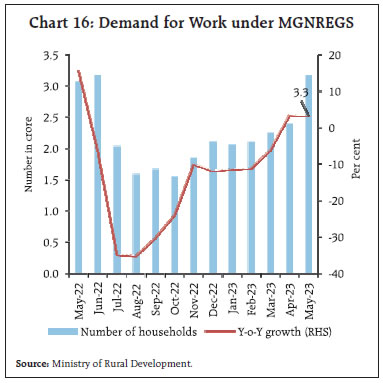
The demand for work under the Mahatma Gandhi National Rural Employment Guarantee Scheme (MGNREGS) remained elevated both sequentially as well as on a y-o-y basis due to lower agricultural activity in summer (Chart 16). India’s merchandise exports declined by 10.3 per cent (y-o-y) to US$ 35.0 billion in May 2023, registering a contraction for the fourth successive month (Chart 17a). The contraction was broad-based, with nearly three-fourth of the export basket (17 out of 30 major commodities) registering a decline on a y-o-y basis. Sequentially, total exports registered a marginal growth of 0.7 per cent (m-o-m), led by non-oil exports (2.8 per cent) which was mostly offset by the contraction in petroleum exports [(-) 8.5 per cent] (Chart 17b). 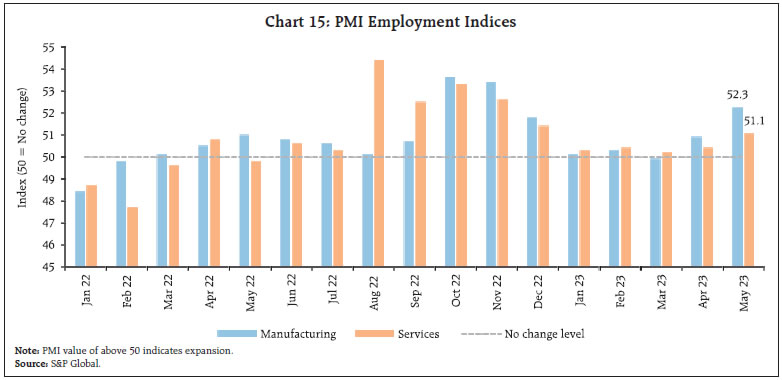
 Amidst the overall decline, electronic goods, which account for 6.9 per cent of total merchandise exports, continued to contribute positively to export growth in May (Chart 18). Mobile phones have provided the growth impetus in recent months with their exports more than doubling in 2022-23 to US$ 11.1 billion. This rapid growth has also benefitted from the Production Linked Incentive (PLI) scheme for large scale manufacturing and IT hardware.11 With imports of mobile phones falling from US$ 2.6 billion in 2017-18 to US$ 1.4 billion in 2023, India has transformed into a net exporter of mobile phones with a trade surplus of US$ 9.7 billion in 2022-23 in that category (Chart 19). Merchandise imports declined by 6.6 per cent (y-o-y) in May 2023 for the fifth consecutive month to US$ 57.1 billion (Chart 20). While gold, petroleum, oil, and lubricants (POL), coal, pearls, precious and semi-precious stones and chemicals dragged down import growth, electronic goods, machinery, non-ferrous metals, fertilisers, and iron and steel contributed positively (Chart 21).
India’s merchandise trade deficit widened to US$ 22.1 billion in May 2023. As POL imports witnessed marginal sequential growth against a decline in exports, the deficit on account of oil trade widened by US$ 1 billion. The share of oil in the total trade deficit, however, fell to a six-month low of 43.8 per cent in May 2023 due to a relatively sharper expansion in non-oil imports as compared with non-oil exports (Chart 22). 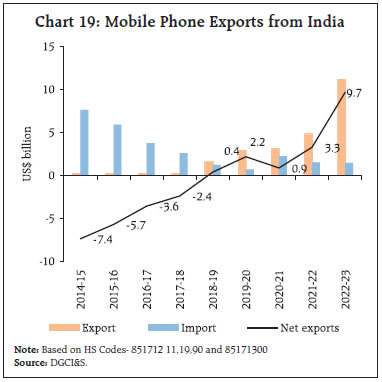 The key deficit indicators viz., gross fiscal deficit (GFD), revenue deficit (RD) and primary deficit (PD) of the Central Government showed an improvement in 2022-23 as per the provisional accounts (PA) vis-a-vis the revised estimates (RE). This improvement in the financial position of the Central Government was brought about by higher receipts (both tax and non-tax revenues), which were partially offset by lower disinvestment receipts (Table 2). Accordingly, the GFD was placed at 6.36 per cent of GDP for 2022-23 (PA) as against 6.43 per cent of GDP in the RE. While the total expenditure (PA) was broadly in line with the RE, total capital expenditure and revenue expenditure were at 101.1 per cent and 99.8 per cent of the RE, respectively. 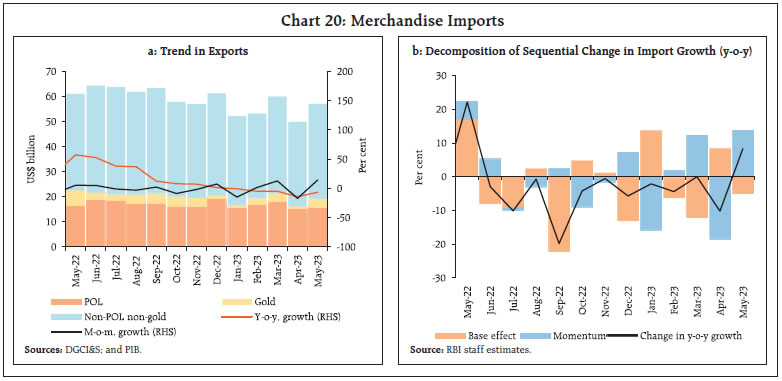
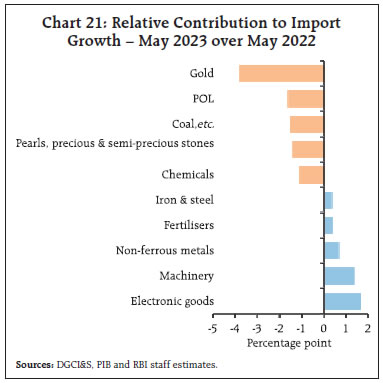
Table 2: Key Fiscal Indicators
(as a per cent of GDP) | | Indicator | 2021-22 | 2022-23 | 2023-24 | | Actuals | BE | RE | PA | BE | | 1. Fiscal Deficit | 6.75 | 6.44 | 6.43 | 6.36 | 5.92 | | 2. Revenue Deficit | 4.39 | 3.84 | 4.07 | 3.92 | 2.88 | | 3. Primary Deficit | 3.32 | 2.79 | 2.98 | 2.95 | 2.34 | | 4. Gross Tax Revenue | 11.54 | 10.69 | 11.14 | 11.21 | 11.14 | | 5. Non-Tax Revenue | 1.56 | 1.05 | 0.96 | 1.05 | 1.00 | | 5. Revenue Expenditure | 13.64 | 12.38 | 12.67 | 12.67 | 11.61 | | 6. Capital Expenditure | 2.53 | 2.91 | 2.67 | 2.70 | 3.32 | | (i) Capital Outlay | 2.28 | 2.37 | 2.27 | 2.28 | 2.77 | Notes: 1. GDP used for 2022-23 budget estimates (BE) and revised estimates (RE) is as per the Union Budget 2022-23 and 2023-24, respectively.
2. For 2022-23 (PA), the GDP used is the provisional estimates (PE), released by the Ministry of Statistics and Programme Implementation (MoSPI) on May 31, 2023.
Sources: Union Budget Documents; and Controller General of Accounts (CGA). |
 Capital outlay (viz., capital expenditure minus loans and advances) has been steadily improving in the post pandemic phase, underscoring the Government’s emphasis on medium to long-term growth. Consequently, the ratio of revenue expenditure to capital outlay (RECO), which serves as an indicator of the quality of Government expenditure, has been recording a consistent improvement (Chart 23). During April 2023, the major deficit indicators such as GFD, RD and PD increased on a y-o-y basis. On the receipts side, gross tax revenue collection turned out to be lower, with direct taxes and indirect taxes contracting (y-o-y) by 10.1 per cent and 0.5 per cent, respectively. Non-debt capital receipts and non-tax revenue also contracted (y-o-y) by 81.6 per cent and 8.2 per cent, respectively. Conversely, total expenditure growth during April 2023 was higher on account of an increase in revenue expenditure (15.2 per cent, y-o-y) whereas capital expenditure contracted by 0.6 per cent (y-o-y). GST collections (Centre plus States) stood at ₹1.57 lakh crore in May 2023, recording a growth rate of 11.5 per cent y-o-y (Chart 24). 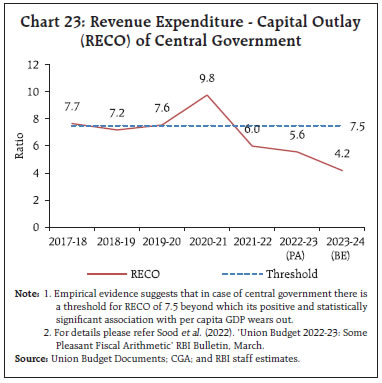 The consolidated GFD of States and UTs declined from its peak of 4.1 per cent of GDP in 2020-21 to 2.8 per cent in 2021-2212 and remained at the same level in 2022-2313, well below the BE of 3.4 per cent. The consolidation is primarily driven by a sharp decline in revenue expenditure even as revenue receipts fell marginally. Within revenue receipts, the States’ own tax revenue increased in 2022-23, led by States’ GST. Capital expenditure remained at the same level as in 2021-22 (Table 3). The States’ GFD-GSDP ratio has been budgeted at 3.2 per cent in 2023-2414, well within the indicative target of 3.5 per cent set by the Centre. Capital expenditure is budgeted to increase to 3.2 per cent of GSDP in 2023-24 (BE) along with improvement in the RECO ratio (Chart 25). Aggregate Supply As per the NSO’s provisional estimates, real gross value added (GVA) at basic prices – a measure of aggregate supply – recorded 7.0 per cent growth in 2022-23 as compared with 8.8 per cent a year ago. GVA growth (PE) was revised upward by 40 basis points (bps) from 6.6 per cent in the SAE. Overall, growth was driven by resilient agriculture and allied activities and the services sector, while industrial sector activity remained tepid. All the three sectors have undergone upward revisions in the PE vis-à-vis the SAE. Table 3: Key Fiscal Indicators
(as a per cent of GDP/GSDP) | | Indicator | 2021-22
Actuals | 2022-23 | 2023-24
BE | | BE | RE | PA | | Gross Fiscal Deficit | 2.8 | 3.4 | 3.1 | 2.8 | 3.2 | | Revenue Deficit | 0.4 | 0.3 | 0.5 | 0.3 | 0.2 | | Primary Deficit | 1.0 | 1.6 | 1.4 | 1.2 | 1.4 | | Tax Revenue | 10.0 | 10.1 | 9.3 | 9.8 | 10.6 | | Non-Tax Revenue | 1.1 | 1.3 | 1.0 | 1.0 | 1.2 | | Revenue Expenditure | 14.2 | 15.3 | 13.7 | 13.5 | 14.6 | | Capital Expenditure | 2.5 | 3.2 | 2.7 | 2.5 | 3.2 | | i) Capital Outlay | 2.3 | 2.9 | 2.4 | 2.2 | 2.9 | Note: Data for 2021-22, 2022-23 (BE) and 2022-23(PA) pertain to 31 States/UTs and for 2022-23 (RE) and 2023-24 (BE) pertain to 29 States/UTs. Data for 2023-24(BE) is taken as a per cent of GSDP.
Source: Budget documents of the states; Comptroller and Auditor General of India and RBI. |
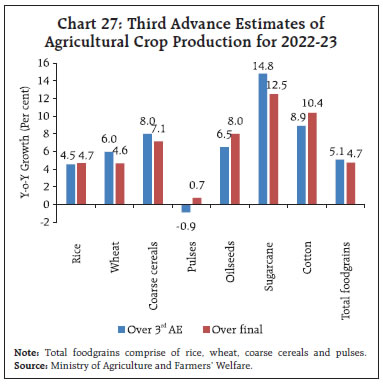
 On a similar note, real GVA at basic prices clocked a growth of 6.5 per cent in Q4:2022-23, accelerating from 4.7 per cent in Q3:2022-23 (Chart 26). Agriculture and allied activities recorded a growth of 5.5 per cent in Q4 due to bumper production of wheat, rice and maize.15 Manufacturing rebounded in Q4 as easing input costs facilitated an improvement in profit margins of listed manufacturing companies. A broad-based resurgence was recorded within the services sector. Trade, hotels, transport, communication and services related to broadcasting grew on a y-o-y basis. Financial, real estate and professional services picked up momentum while profit margins of IT companies remained subdued. Despite episodes of unseasonal rains, agriculture and allied activities clocked GVA growth of 4.0 per cent in 2022-23, supported mainly by resilient rabi crop production. The third AE of agriculture production for 2022-2316 has projected a record foodgrains production (for the seventh consecutive year) of 330.5 million tonnes, 4.7 per cent higher than the final estimates for 2021-22 (Chart 27). All major categories of foodgrains (rice, wheat and pulses), except coarse cereals, recorded the highest ever production in 2022-23. 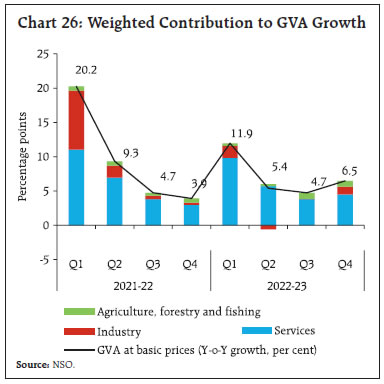
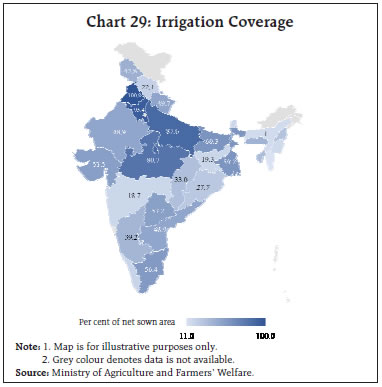
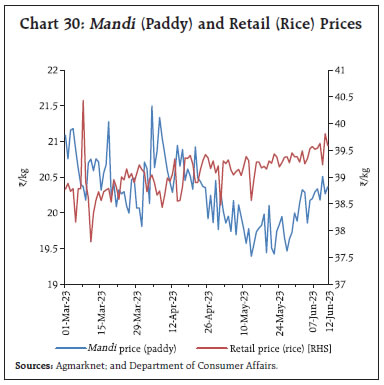
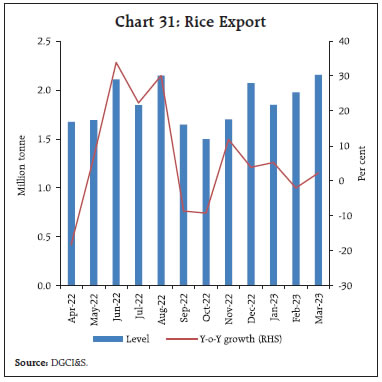
 The India Meteorological Department’s (IMD) updated long-range forecast (LRF) released on May 26, 2023 for the South West Monsoon (SWM) rainfall remains unchanged at 96 per cent of the long period average (LPA) from the previous LRF but with higher precision (model error of +/- 4 per cent). Spatially, the forecast probability of normal and above rainfall is higher than that of below normal rainfall for the whole country barring the north-western region (Chart 28). Adequate irrigation coverage (mainly tubewells) in the key north-western agricultural states could offset the impact of monsoon deficits (if any) on agricultural production (Chart 29). Mandi prices of paddy declined during April-May on account of record production and higher mandi arrivals but they have edged up in recent weeks due to firm export demand and anticipation of adverse impact of El Nino (Chart 30). Retail prices remained firm, partly on account of higher exports throughout 2022-23 (Chart 31). The cumulative procurement of rice in the ongoing kharif marketing season 2022-23 so far (i.e., October 1, 2022 to June 17, 2023) at 55.4 million tonnes was 3.0 per cent lower than the previous year’s level. However, as on June 1, 2023, the stocks of rice (including unmilled paddy) remained sufficient at 3.1 times the Q1 buffer norms. The Government has announced sale of rice under its open market sales scheme (OMSS) to moderate prices, the quantity, however, is yet to be decided.17 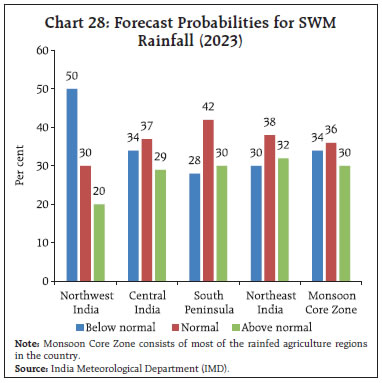
 The cumulative Government purchase of wheat has reached 26.2 million tonnes as on June 17, 2023 (39.5 per cent above the total procurement during previous year), aided by the Government’s relaxation of norms for procurement of grains damaged due to unseasonal rains. With stocks remaining at 31.4 million tonnes (4.2 times the Q1 buffer norms, as on June 1, 2023), the supply appears to be sufficient for both normal offtake and interventions in the open market (Chart 32). Consequently, the Central Government has announced that it will offload 1.5 million tonnes under the first phase of its domestic OMSS of 2023. Further, the Government has also imposed stock limits on wheat for various market participants (retailers, wholesalers and processors). Minimum Support Prices (MSP) were announced for 14 major kharif crops for the marketing season 2023-24 (Oct-Sep) on June 7, 2023. MSPs have been revised upwards in the range of 5.3 - 10.4 per cent (Chart 33). For most of the crops, the rate of increase has been higher than the increase during the previous year, in line with the increase in cost of production. The headline PMI for the manufacturing sector accelerated to 58.7 in May 2023, the highest since October 2020, led by output, new orders, and stocks. Business expectations in the manufacturing sector also expanded to a five month-high of 62.9 (Chart 34a). The PMI services remained robust at 61.2 in May 2023, the second highest in 13 years, led by a pick-up in new business growth and favourable market conditions (Chart 34b).
In the services sector, transport indicators recorded a marginal uptick in May. Growth in cargo traffic at major ports increased by 3.7 per cent, led by a rise in containerised cargo and coking coal (Chart 35a). Growth in railway freight, however, decelerated to a seven-month low in May, driven by a fall in freight of coal to thermal power houses (Chart 35b). Coincident indicators for the construction sector suggested robust activity in the sector. While steel consumption grew by 7.8 per cent in May (y-o-y), cement production recorded a double digit growth in April 2023 (Chart 36).
High-frequency services sector indicators for May 2023 also point to economic activity sustaining pace. Automobile sales recorded robust growth with acceleration in both two and three wheelers’ sales. (Table 4). In terms of regional policy initiatives, Odisha has launched. “Mo Ghara” scheme to provide financial support to low-income rural households to construct pucca houses. To ensure a safe working environment for inter-state migrant workers, Tamil Nadu has formed an inter-state coordination cell to build confidence and sort out issues related to migrant labourers. The North East Frontier Railway (NFR) authority has operationalised 107 One Station One Product (OSOP) outlets under its jurisdiction to promote the Government of India’s vision of “Vocal for Local” to encourage local/ indigenous products and provide additional income opportunities for the marginalised sections of society. Inflation Headline inflation, as measured by y-o-y changes in all-India consumer price index (CPI)18, moderated to 4.3 per cent in May 2023 from 4.7 per cent in April. The fall in headline inflation was driven by food and fuel sub-components while core (excluding food and fuel) inflation remained steady (Chart 37). The momentum (m-o-m change in prices in current year) of around 50 bps was more than offset by a favourable base effect (m-o-m change in prices a year ago) of around 90 bps, resulting in a 40 bps fall in headline inflation between April and May. The m-o-m increase in prices was of the order of around 60 bps in food, 55 bps in fuel, and around 40 bps in core groups. CPI food inflation (y-o-y) moderated sharply to 3.3 per cent in May from 4.2 per cent in April on account of a large favourable base effect of around 145 bps, which more than offset a positive price momentum of around 55 bps. In terms of sub-groups, inflation moderated in cereals, fruits, non-alcoholic beverages and prepared meals. Edible oils, meat and fish and vegetables remained in deflation while inflation in milk, eggs, sugar, spices and pulses edged up in May. Inflation in the fuel and light group declined to 4.6 per cent in May from 5.5 per cent in April as a large favourable base effect of 140 bps more than offset the positive momentum (55 bps). Within the group, inflation in LPG, firewood and chips prices continued to witness further moderation. Electricity price inflation, on the other hand, edged up in May. Core inflation remained unchanged at 5.1 per cent in May as the momentum of 40 bps was completely offset by the base effect. Within this category, sub-groups such as housing, clothing and footwear, household goods and services, health, transport and communication and education witnessed further deceleration in inflation. Inflation in pan, tobacco and intoxicants, and personal care and effects, however, registered in uptick in May (Chart 38 and 39). In terms of regional distribution, rural inflation at 4.17 per cent was marginally lower than urban inflation (4.27 per cent) in May 2023. Majority of the States registered inflation in the range of 4-6 per cent with only a few States, viz., Haryana, Mizoram and Tripura experiencing inflation between 6 to 8 per cent (Chart 40).
High frequency food prices data for June (June 1-12) point to an increase in prices of cereals, most of the pulses and key vegetables (potatoes, onions and tomatoes). Edible oil prices, however, witness a moderation (Chart 41). Retail selling prices of petrol and diesel in the four major metros remained steady in June so far. While kerosene prices experienced a continued decline, LPG prices were kept unchanged in June (Table 5). Input costs prices measured by the wholesale price index (WPI) for industrial inputs and farm inputs, recorded deflation in May 2023, reflecting favourable base effects as well as a fall in prices (Chart 42). The decline in industrial inputs prices primarily reflected moderation in prices of non-food articles, high speed diesel (HSD) and electricity while farm inputs moderated on the back of the fall in prices of fodder, pesticides, HSD and electricity. 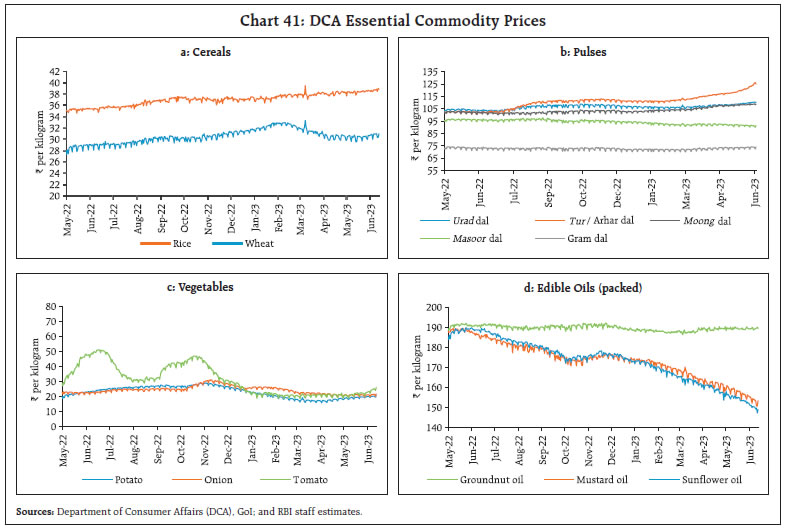
| Table 5: Petroleum Products Prices | | Item | Unit | Domestic Prices | Month-over-month (per cent) | | May-22 | Apr-23 | May-23^ | Apr-23 | May-23^ | | Petrol | ₹/litre | 104.18 | 102.92 | 102.92 | 0.0 | 0.0 | | Diesel | ₹/litre | 93.48 | 92.72 | 92.72 | 0.0 | 0.0 | | Kerosene (subsidised) | ₹/litre | 61.99 | 47.55 | 44.12 | -3.3 | -7.2 | | LPG (non- subsidised) | ₹/cylinder | 1013.25 | 1113.25 | 1113.25 | 0.0 | 0.0 | ^: For the period June 1-12, 2023.
Note: Other than kerosene, prices represent the average Indian Oil Corporation Limited (IOCL) prices in four major metros (Delhi, Kolkata, Mumbai and Chennai). For kerosene, prices denote the average of the subsidised prices in Kolkata, Mumbai and Chennai.
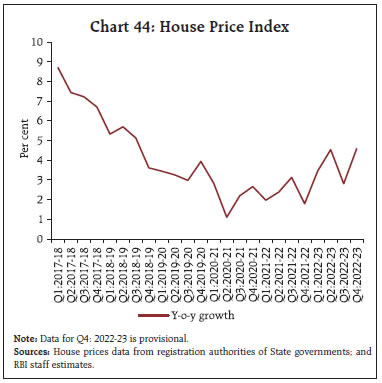
Sources: IOCL; Petroleum Planning and Analysis Cell (PPAC); and RBI staff estimates. | The PMIs for May 2023 indicated a moderation in input costs across the manufacturing sector while they increased for the services sector. Selling prices, however, edged up further for both manufacturing and services (Chart 43). In the housing sector, the all India house price index (HPI) increased by 4.6 per cent y-o-y in Q4:2022-23 recording its highest increase over the last seventeen quarters (Chart 44). On a sequential (q-o-q) basis, HPI increased by 0.6 per cent during Q4. IV. Financial Conditions Surplus liquidity, as reflected in average daily absorptions under the LAF at ₹1.8 lakh crore during May 16 to June 15, 2023 was higher than ₹1.3 lakh crore during April 16 to May 15. After remaining tight for a few days during the second fortnight of May 2023, liquidity conditions improved subsequently in the wake of (i) the return of currency to the banking system — from both the withdrawal of ₹2,000 banknotes from circulation, and an accelerated pace of Government spending before the onset of the monsoon season; and (ii) the Reserve Bank’s market operations. 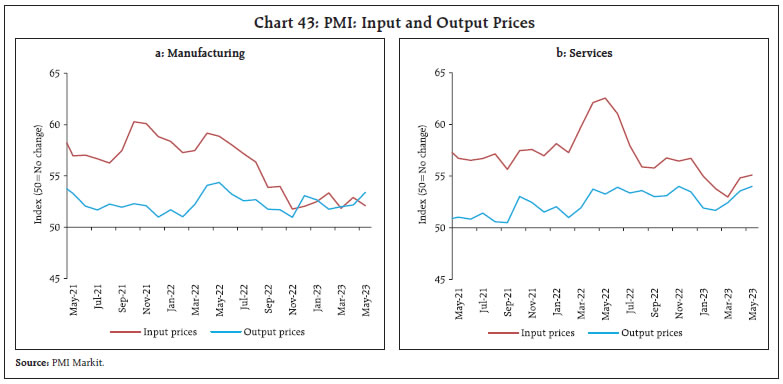
 The Reserve Bank remained prompt and agile in conducting two-way liquidity management operations in response to the evolving liquidity scenario during May 16-June 15, 2023. To assuage the liquidity tightness in the middle of May, the Reserve Bank conducted a 14-day variable rate repo (VRR) auction (main operation) to inject liquidity amounting to ₹50,000 crore on May 19, 2023. Subsequently, however, with an improvement in liquidity conditions, a 14-day variable rate reverse repo (VRRR) auction (main operation) of ₹2.0 lakh crore was conducted on June 2 to absorb liquidity, followed by five fine tuning operations – (i) a 4-day VRRR of ₹1.0 lakh crore on June 5; (ii) a 3-day VRRR of ₹0.75 lakh crore on June 6; (iii) a 2-day VRRR of ₹0.75 lakh crore on June 7, 2023; (iv) a 4-day VRRR of ₹1.0 lakh crore on June 9 and (v) a 2-day VRRR of ₹0.50 lakh crore on June 13. 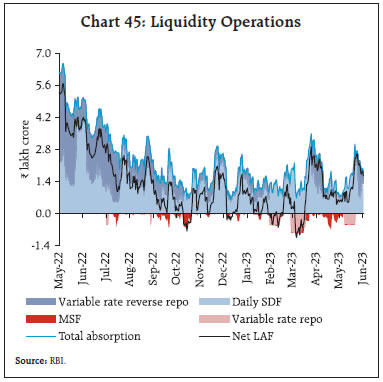 The placement of funds under the standing deposit facility (SDF) increased to ₹1.4 lakh crore during May 16 to June 15, 2023 from ₹0.95 lakh crore during the previous period (April 16 to May 15, 2023). Recourse to the marginal standing facility (MSF) declined, averaging ₹0.02 lakh crore during this period from ₹0.22 lakh crore during the previous period. Consequently, net absorption under the LAF stood higher at ₹1.45 lakh crore during May 16 to June 15, 2023 as compared with ₹0.92 lakh crore during April 16 to May 15, 2023 (Chart 45). Reflecting the augmented surplus liquidity, the weighted average call rate (WACR) gradually softened to below repo rate levels. In sync, other overnight money market rates also eased. On an average basis, the WACR, the triparty repo and market repo rates traded 7 basis points (bps), 14 bps and 10 bps, respectively, below the policy repo rate during May 16 to June 15, 2023 (Chart 46a). Across the term money segment, yields softened on 3-month certificates of deposit (CDs) issued by banks and commercial papers (CPs) issued by non-banking financial companies (NBFCs), although both remained above the upper band of the corridor, while the yield on 3-month treasury bills (T-bills) was broadly aligned with the MSF rate (Chart 46b). In the primary market, fund mobilisation through issuances of CDs at ₹0.95 lakh crore during 2023-24 (up to June 2) was higher than ₹0.79 lakh crore in the corresponding period of the previous year. On the other hand, CP issuances at ₹2.3 lakh crore (up to May 31) remained flat as compared with the corresponding period a year ago. 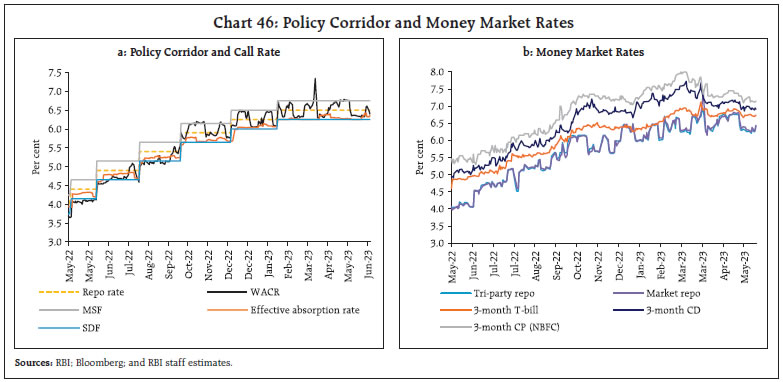 Yields on Government securities (G-secs) hardened marginally across the curve on June 8 and the 10 year benchmark (7.26 per cent GS 2033) yield closed at 7.02 per cent on that day, increasing by 4 bps 6.98 per cent from previous day as the Monetary Policy Committee (MPC)’s focus on aligning inflation with the target of 4 per cent was perceived by the market participants to be hawkish. Subsequently, yields eased somewhat, following the decline in CPI inflation to a 25-month low of 4.3 per cent. Overall, bond yields largely traded in a narrow range, with the yield on the 10-year benchmark Government security (G-sec) closing at 7.0 per cent on June 13, 2023 unchanged from its level on May 15 (Chart 47a). Across the curve, yields generally eased, particularly at the mid-segment of the curve (Chart 47b). Despite the large Government borrowing programme, the relative stability of long-term yields augurs well for the economy and suggests effective anchoring of market inflation expectations. It also suggests that financial conditions, despite the unchanged stance of withdrawal of accommodation, remain congenial and supportive of growth. Corporate bond yields, too, softened during May 16, 2023 to June 15, 2023. Average risk premia in the bond market (5-year AAA minus 5 year G-sec) were largely unchanged during the same period (Table 6). Funds mobilised through corporate bond issuances amounted to ₹0.53 lakh crore during April 2023, significantly higher than ₹0.16 lakh crore for the same period in the preceding year. Reserve money (RM), excluding the first-round impact of change in the cash reserve ratio (CRR), grew by 6.8 per cent on a y-o-y basis as on June 9, 2023 (8.3 per cent a year ago) [Chart 48]. Currency in circulation, the largest component of RM, decelerated to 5.3 per cent from 8.3 per cent a year ago, reflecting both the exchange of ₹2,000 bank notes beginning May 19, 2023 and ongoing adoption of digital modes of payment. 
| Table 6: Financial Markets - Rates and Spread | | Instrument | Interest Rates
(per cent) | Spread (basis points)
(Over Corresponding Risk-free Rate) | | Apr 17, 2023 – May 15, 2023 | May 16, 2023 – Jun 15, 2023 | Variation (in bps) | Apr 17, 2023 – May 15, 2023 | May 16, 2023 – Jun 15, 2023 | Variation (in bps) | | 1 | 2 | 3 | (4 = 3-2) | 5 | 6 | (7 = 6-5) | | Corporate Bonds | | | | | | | | (i) AAA (1-year) | 7.71 | 7.65 | -6 | 60 | 64 | 4 | | (ii) AAA (3-year) | 7.81 | 7.73 | -8 | 73 | 72 | -1 | | (iii) AAA (5-year) | 7.73 | 7.66 | -7 | 61 | 60 | -1 | | (iv) AA (3-year) | 8.51 | 8.36 | -15 | 143 | 133 | -10 | | (v) BBB-(3-year) | 12.16 | 12.07 | -9 | 508 | 505 | -3 | Note: Yields and spreads are computed as monthly averages.
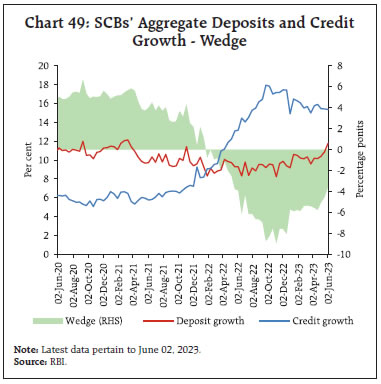
Sources: FIMMDA; and Bloomberg. | As on June 2, 2023 money supply (M3) growth was higher at 10.5 per cent (y-o-y) than 8.6 per cent in the corresponding period of last year, primarily driven by its largest component - aggregate deposits with banks, which increased by 11.2 per cent (8.8 per cent a year ago). Scheduled commercial banks’ (SCBs’) credit moderated to 15.4 per cent (y-o-y) from the peak of 17.8 per cent recorded in October 2022 due to an unfavourable base effect and moderation in credit growth to industry. Furthermore, the wedge between the growth rates of SCBs’ credit and deposit narrowed, with the growth in deposit mobilisation recording a 27-month high of 11.8 per cent amidst continuing efforts by SCBs to bridge the funding gap (Chart 49). 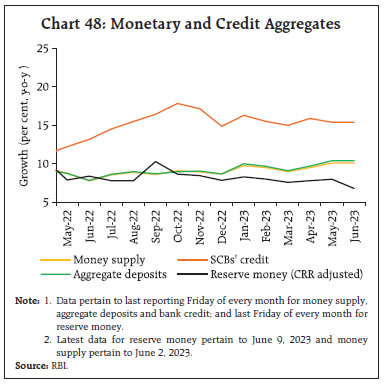
 In response to the Reserve Bank’s repo rate hike of 250 bps since May 2022, banks have revised their benchmarks for pricing of loans —the external benchmark-based lending rate (EBLR) and the marginal cost of funds-based lending rate (MCLR) — upwards. Accordingly, during May 2022 to April 2023, banks have cumulatively increased their EBLRs and their 1-year median MCLR by 250 bps and 145 bps, respectively. As a result, the weighted average lending rate (WALR) on fresh and outstanding rupee loans increased by 158 bps and 104 bps, respectively. On the deposit side, the weighted average domestic term deposit rate (WADTDR) on fresh and outstanding deposits increased by 233 bps and 125 bps, respectively (Chart 50). On a m-o-m basis, the WALR on fresh rupee loans and WADTDR on fresh deposits declined by 23 bps and 12 bps, respectively, in April 2023. The increase in the WALRs on fresh rupee loans and WADTDRs on fresh deposits was higher in the case of public sector banks (PSBs) relative to private banks (PVBs). During May-June 2023 so far, the BSE Sensex increased by 3.7 per cent to close at 63,385 on June 16, at an all-time closing high. (Chart 51). The equity market remained under pressure in the second half of May amidst negative global cues on account of lingering concerns over the US debt ceiling negotiations and lower Chinese industrial production data. The market, however, recovered towards the end of the month amidst substantial net foreign portfolio investors (FPI) inflows – the highest monthly inflow since August 2022.
In the beginning of June 2023, Indian markets registered further gains supported by positive global cues, upbeat domestic manufacturing PMI and elevated GST collections in May 2023 as well as strong GDP growth performance in Q4:2022-23 and the low inflation reading for May. Amidst gradually normalising price and volume dynamics, nominal sales growth of listed private non-financial manufacturing companies19 moderated to 5.3 per cent (y-o-y) in Q4:2022-23 from 10.6 per cent in the previous quarter. In real terms, sales, however, increased by 5.5 per cent (y-o-y) in Q4:2022-23 from 4.0 per cent in the previous quarter, with real sales index reaching an all-time high (Chart 52). The net profit margin of manufacturing companies improved to 10.1 per cent from 7.2 per cent over this period, aided by softening in input costs and rise in other income (Chart 53a). The Information technology (IT) sector’s profitability moderated amidst the global slowdown (Charts 53b). Profitability in non-IT services, which was most adversely affected during the pandemic, recovered and net profit margin turned positive in Q4:2022-23 for the first time since the onset of the pandemic (Chart 53c).
Improved profitability helped the private manufacturing sector to make more capital investments during 2022-23. Over 40 per cent of funds were used for fixed asset formation as reported by 1,550 listed manufacturing companies. These companies relied on internal funds/short-term borrowings for funding requirements (Chart 54). The cost of the projects being supported by banks and financial institutions went up substantially during 2022-23, indicating congenial signs for a pick-up in the private capex cycle. Funds raised through external commercial borrowings (ECBs) nearly doubled in 2022-23 and have shown a healthy growth during 2023-24 so far (up to May 2023) [Chart 55]. 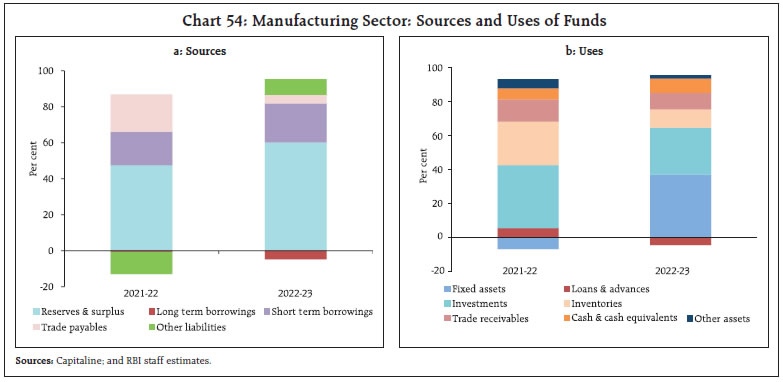
 Gross inward foreign direct investment (FDI) flows, albeit strong, moderated to US$ 6.9 billion in April 2023, from US$ 8.4 billion in April 2022 (Chart 56a). Net FDI declined to US$ 2.8 billion in April 2023 from US$ 5.3 billion a year ago. Manufacturing, business services and financial services attracted majority of FDI inflows in April 2023, while Singapore, the Netherlands and Mauritius were major source countries for FDI during the month. According to the FDI Report 2023 released by the fDi Intelligence20, India was the most attractive destination country in the Asia-Pacific region by a significant margin with a total of 994 India-bound projects recorded in 2022 (Chart 56b). 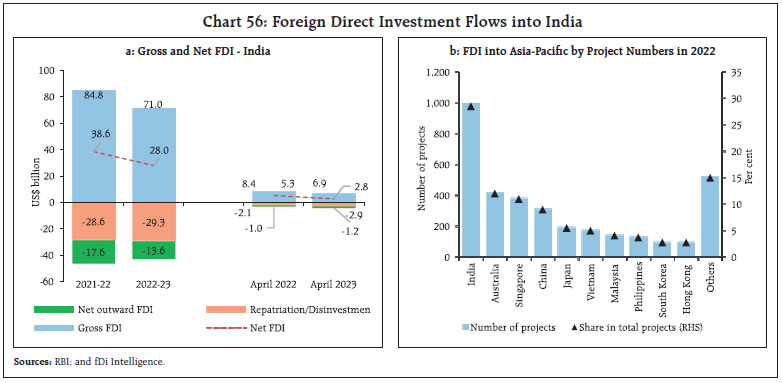
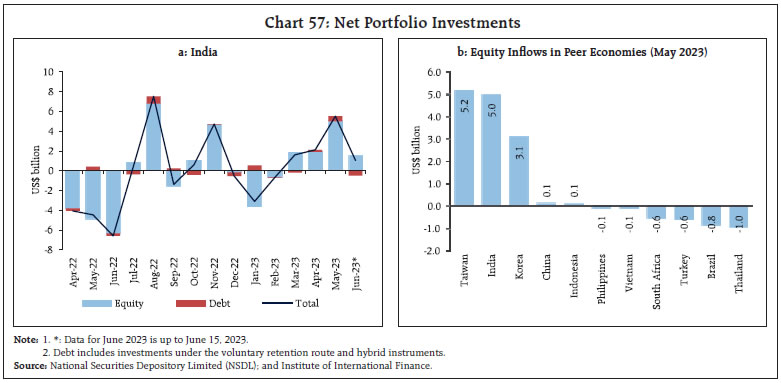 FPI flows at US$ 5.5 billion remained positive for the third consecutive month in May 2023 and at their highest level in the previous nine months (Chart 57a). The equity segment accounted for most of the inflows (US$ 5.0 billion). Relative to comparable emerging market peers, Indian equities attracted the second highest FPI inflows during May 2023 (Chart 57b). Financial services, automobiles and fast-moving consumer goods (FMCGs) attracted the bulk of these investments during May. In June 2023 so far (up to June 16), FPIs invested US$ 1.2 billion in Indian markets, taking net inflows in 2023-24 to US$ 8.8 billion, as against net outflows of US$ 5.9 billion during 2022-23. India received 48.7 per cent of total emerging markets FPI equity flows in 2023-24 (up to June 14)21 as against India’s weight in MSCI Emerging Market Index of 14.3 per cent (as on May 31, 2023). With net accretion to all accounts- Non-Resident Ordinary (NRO); Foreign Currency Non-Resident [FCNR(B)] accounts, and Non-Resident (External) Rupee Accounts [NR(E)A] the overall net accretions to non-resident deposits increased to US$ 9.0 billion in 2022-23 from US$ 3.2 billion a year ago.
ECB registrations surged to US$ 13.0 billion during April-May 2023 (US$ 1.9 billion in April-May 2022), largely driven by manufacturing and infrastructure borrowers. Also, ECB net flows have turned significantly positive in 2023-24 so far, as against net outflows in the same period last year, and a small positive in 2022-23. Despite stable global reference rates, the overall cost of ECB loans fell in April 2023 due to the substantial decline in the weighted average interest margin, which reflects the creditworthiness of new borrowers (Chart 59). The foreign exchange reserves increased by US$ 69.2 billion since October 21, 2022 and stood at US$ 593.7 billion on June 9, 2023 sufficient to cover 10 months of imports projected for 2022-23 or 97 per cent of total external debt outstanding at end-December 2022 (Chart 60a). During the calendar year 2023, India’s foreign exchange reserves increased by US$ 31.0 billion, which is the second highest among major foreign exchange reserves holding countries (Chart 60b). The INR depreciated by 0.4 per cent (m-o-m) vis-à-vis the US dollar in May 2023, in line with most EME currencies (Chart 61).
The INR has emerged as one of the least volatile among major currencies, with the least one-month implied volatility in 2023 so far (Chart 62). The INR appreciated by 1.2 per cent (m-o-m) in terms of the 40-currency real effective exchange rate (REER) in May 2023 (Chart 63). Payment System India’s progression towards a less-cash economy continued with steady growth across various payment modes in May 2023 (Table 7), supported by online transactions by over 35 crore users.22 The Unified Payments Interface (UPI) – the mainstay of retail payments – achieved a milestone of 9.4 billion transactions, with a 143 per cent growth (y-o-y) in successful transactions under the UPI Autopay feature and a 23 per cent rise (y-o-y) in new mandate registrations. Furthermore, person-to-merchant (P2M) payments have gained prominence, comprising 57 per cent of the total transaction volume through the UPI.23 With the linking of Rupay credit cards to UPI, the share of P2M transactions in value terms is also anticipated to rise, owing to a higher average ticket size of credit card purchases than UPI.24 The UPI is expected to account for 90 per cent share of retail digital transactions volume in the next five years, up from 75.6 per cent in 2022-23.25 
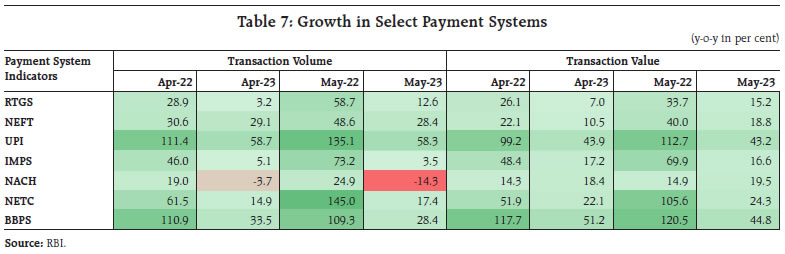 While the issuance of new credit cards is projected to exhibit a compound annual growth rate (CAGR) of 21 per cent in the next five years26, other retail digital payment methods such as the Bharat Bill Payment System (BBPS), the National Electronic Toll Collection (NETC), the National Electronic Funds Transfer (NEFT), and the Immediate Payment Service (IMPS) have demonstrated consistent growth in both transaction volume and value. The robust growth in payments was reinforced by a rapid scaling up of the payment acceptance infrastructure. The proliferation of UPI quick response (QR) codes (44 per cent y-o-y growth) and point-of-sale (PoS) devices (27 per cent y-o-y growth) continued to provide consumers and merchants with cost-effective and expeditious payment options.27 Additionally, the number of toll plazas processing more than 90 per cent of transactions in under 2 minutes (through NETC FASTags) increased by 70 per cent, thereby saving on fuel wastage and reducing carbon emissions. In its Statement on Developmental and Regulatory Policies of June 8, 2023, the Reserve Bank decided to allow the issuance of Rupay prepaid forex cards by banks in India, thereby facilitating their use at ATMs, PoS machines, and online merchants overseas by Indians travelling abroad. It also proposed to expand the scope and reach of e-RUPI vouchers (purpose-specific digital vouchers) and announced streamlining of Bharat Bill Payment System (BBPS) processes and membership criteria. Owing to the policy-supported ecosystem, the momentum in digital transactions is predicted to stay up, with 85 per cent of the businesses being digitally enabled and 50 per cent of the transactions by households being made through digital modes by 2026.28 Going ahead, digital transactions are expected to get a significant boost with the adoption of the Open Network Digital Commerce (ONDC), which recorded an impressive forty times expansion in the number of merchants onboarded on the platform (from 800 to 35,000)29, who are servicing more than 25,000 orders per day in around 236 cities.30 Conclusion Amidst the play of these developments, the RBI’s monetary policy committee (MPC) met during June 6-8, 2023 in its scheduled second bi-monthly meeting for the year 2023-24. Noting that the target variables – real GDP growth and CPI inflation – have broadly formed in line with projections made at the April meeting, the MPC assessed that while the impulses of growth were getting stronger, headline inflation could rule above the target through 2023-24 although it would decline from its level in 2022-23 when it breached the upper tolerance band and averaged 6.7 per cent. The MPC expressed the view that inflation’s trajectory warrants “continuous vigil”. While the cumulative rate hike of 250 basis points undertaken so far is transmitting through the economy and should keep inflationary pressures contained, the MPC judged that monetary policy would need to be carefully calibrated with the goal being alignment of inflation with the target. Accordingly, the committee decided to keep the policy repo rate unchanged at 6.50 per cent and committed “to take further monetary actions promptly and appropriately as required”. In this context, the words of Governor Shri Shaktikanta Das are stark and illuminating as regards the future course of monetary policy. In our view, this is the best forward guidance that can be given in these volatile and uncertain times: “Let me re-emphasise that headline inflation still remains above the target and being within the tolerance band is not enough. Our goal is to achieve the target of 4.0 per cent, going forward… We have made good progress in containing inflation, supporting growth and maintaining financial and external sector stability. Despite three years of global turmoil, India’s growth has bounced back and headline CPI inflation is easing. This confluence of factors gives us the confidence that our policies are on the right track. Nevertheless, we need to move towards our primary target of 4 per cent inflation. It is always the last leg of the journey which is the toughest. I wish to emphasise that we will do whatever is necessary to ensure that long-term inflation expectations remain firmly anchored.” The reinforced commitment to aligning inflation with the target has been interpreted as a hawkish pause,31 while all the boxes have been adjudged to be ticked.32 Others have opined that the fight against inflation is far from over, justifying the RBI’s watchful response while being mindful of the impact of high interest rates on consumption.33 Indeed, by keeping the policy rate unchanged, monetary policy has been effectively tightened in the near-term in terms of the real policy rate while maintaining a positive real rate four quarters ahead over which monetary policy is expected to work, given its lags. Market-based indicators of inflation expectations and polls of households’ views are already reflecting a re-anchoring thereof. Recent national accounts data and corporate results when read in conjunction clearly show that inflation is slowing down personal consumption expenditure. This, in turn, is moderating corporate sales and holding back private investment in capacity creation. Bringing down inflation and stabilising inflation expectations will revive consumer spending, boost corporate revenues and profitability, which is the best incentive for private capex. As Governor Shri Shaktikanta Das emphasised, “The best contribution of monetary policy to the economy’s ability to realise its potential is by ensuring price stability”. Flexible inflation targeting is in the final analysis the analogue of a growth preservation and promotion monetary policy framework. It is by no means the single minded pursuit of a single target as the critics would have us believe. It is axiomatic that the path to high but sustainable inclusive growth has to be paved by price stability. Once this is realised, the trade-offs and dilemmas confronting the conduct of monetary policy fade away.
|