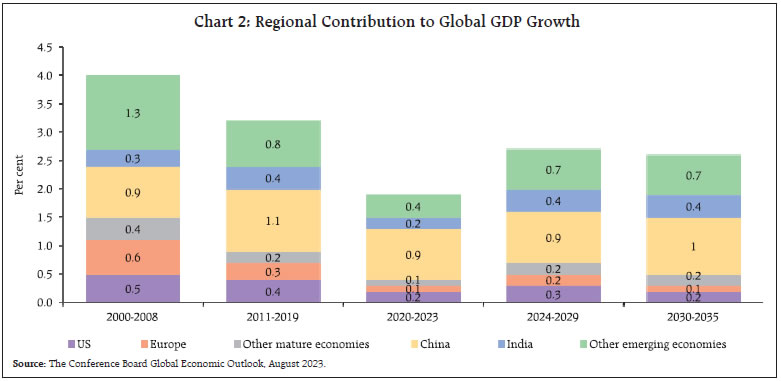
India’s G20 Presidency and its outcomes with the ethos of Vasudhaiva Kutumbakam as the vision of global progress assume significance in an environment where global economic activity is experiencing a loss of momentum with a dichotomy in macroeconomic conditions across regions. Amidst weakening global prospects, the Indian economy is gaining strength led by domestic drivers – private consumption; and fixed investment with strong public sector capex. Supply responses are improving and headline inflation has softened in August from the previous month’s peak. Introduction In September 2023, the earth’s centre of gravity shifted to India as leaders of the most powerful nations, country groupings and international organisations converged to New Delhi. Under India’s presidency of the G20, nations set aside centrifugal differences pulling them apart in a fragmenting world. Standing shoulder to shoulder, their leaders committed to global solutions to global challenges. Multilateralism got a shot in the arm as consensus was built around 12 commitments: sustainable development; debt vulnerabilities; climate resilience; health emergencies; financing for sustainable development goals; access to digital services and public infrastructure; the Paris Agreement; reform of multilateral development banks; gender equality; improving employment conditions; and ensuring that the voice of the global south is heard. The Delhi declaration became a historic movement in which no one gets left behind - the African Union took its permanent place at the G20 high table – in the endeavour to accelerate strong, sustainable, balanced and inclusive growth.1 The G20 declaration marked in no less a manner India’s ascent on the world stage, with the ethos of Vasudhaiva Kutumbakam as our vision of global progress. The world stood up and applauded India’s transformation into a leader, its cultural and geographical diversity, and the meshing of its national priorities into global goals. The world also commended our philosophy of Atithi Devo Bhava – the tradition of revering guests like divinity, as set out in the Upanishads.” Under the G20’s Finance track specifically, other major achievements include a way forward for regulating crypto assets; two pillar taxation solutions; scaling up sustainable finance for social sectors like health and education; and global conversations on transition policies. On climate change, the declaration notes the need for US$ 5.8 -5.9 trillion in the pre-2030 period for developing countries as well as US$ 4 trillion per year for clean energy technologies by 2030 to reach net zero by 2050. Among several initiatives that were committed to on the sidelines, two initiatives stand out as momentous in shaping the world of tomorrow. First, an India-Middle East-Europe economic corridor was announced that will enhance connectivity and economic integration across continents. It will include railway projects, a reliable and cost-effective cross-border ship-to-rail transit network to supplement existing maritime and road transport routes, linking of energy grids, internet, and telecommunication lines through undersea cables. The project aims to develop commercial hubs, support existing trade and manufacturing synergies, and strengthen food security and supply chains. It is a giant and historic step forward towards building sustainable, resilient and high quality infrastructure for a better future. Second, the Global Biofuels Alliance (GBA) was launched with the goal of driving the development and deployment of these fuels across the world to sustain energy transition to a zero-emissions environment. The Global Biofuel Alliance (GBA), an initiative by India as the G20 President, intends to facilitate technology advancements for intensifying utilization of sustainable biofuels, with robust standard setting and certification through the participation of a wide spectrum of stakeholders. The alliance will also act as a central repository of knowledge and an expert hub. It will place emphasis on strengthening markets, facilitating global biofuels trade, development of concrete policy lesson-sharing and provision of technical support for national biofuels programs worldwide. It will also emphasize the already implemented best practices and success cases. The G20 declaration could not have been more timely. High frequency indicators point to some loss of momentum in global economic activity in the third quarter of 2023 and divergent paths across geographies. The outlook is complicated by structural shifts in the global economy amidst unusual uncertainty.2 The turn warranting immediate policy attention is inflation, which is still elevated. Central banks indicate, therefore, that it is too early to declare victory. Interest rates are expected to remain higher for longer before the world can adapt to a regime of low inflation and sustainable growth. Second, the global economy has to brace up to living with extreme shifts ranging from lockdowns to geopolitical conflicts. Labour markets are contending with labour participation slowly recovering from a reluctance or inability to return to work. There is also a persisting shortfall in private investment and new capacity creation, and this is also evident in a structural downturn in foreign direct investment. All this is coinciding with monetary policy seeking to squeeze aggregate demand to fight inflation. Third, fiscal policy is coming off its pandemic bulge but remains much too loose, with public debt levels highly elevated. Fiscal consolidation is simultaneously being challenged by demographic and climate changes. Fourth, the sources of global growth are shifting eastwards. Amidst this shift, the world must contend with the slowing down of China and the emergence of east Asia and India as the new growth centres of the world in the current decade itself. Fifth, the world is getting to be a smaller place as multilateralism gives way to fragmentation and as countries erect barriers to trade and investment and promote resilience over efficiency. In such an environment, global growth may slow secularly – “3 per cent is the speed limit”3; productivity will fall and improvements in living standards will become more sluggish. It has been pointed out that “there is no existing playbook for the situation we are facing today – and so our task is to create a new one.”4 It is in this context that India’s G20 Presidency and its outcomes assume significance. The looming concern is that global growth is likely to slow in 2024 after outperforming expectations in 2023 so far, which will act like a negative base effect. This is premised on the belief that inflation could remain stubbornly above target and r-star or neutral interest rates higher, forcing central banks to maintain disinflationary stances well into 2024. The upheavals over the past three years may likely bring about persistent price pressures that will be unpredictable and harder to root out. Hence tighter financial conditions may continue to prevail. The global economy could slowly be approaching an inflection point beyond which things will change to local growth booms but production inefficiencies worldwide.5 This has led to a view that there will be a recession; it is just getting pushed into 2024.6 Even as the debate intensifies about whether the recession will be big or small, and whether it will be faced sooner or later, international trade is showing signs of deep distress - the UNCTAD nowcasts world merchandise trade volume growth at just 0.37 per cent for the third quarter of 2023. The pandemic time surge is ebbing while expenditure switching from goods to less traded services is in evidence, and confidence in China as a locomotive of global trade is shaken. The outlook for trade is downcast due to the gloomy outlook for global demand, as pointed out in the preceding paragraph. Moreover, it faces a more hostile environment than before as countries re-shore and friend-shore supply chains and the world becomes less open. According to the World Trade Organization, the growth of global trade is likely to fall below GDP growth from 2023.7 Global financial markets are caught up in this churn. A surge in bond yields has shaken stock markets worldwide by undermining support for riskier assets like stocks and their valuations. Although some lost ground has been clawed back, the outlook for stocks remains fragile. Real yields, i.e., adjusted for inflation, also provide a gauge of the borrowing costs in an economy, have risen to their highest levels since 2009. In knock-on effects, borrowings in the corporate bond market and refinancing of existing debt, are getting costlier. Already new issuances have fallen off drastically. It is in this context that the Financial Stability Board has issued warnings of further challenges and shocks facing the global financial system in the months and years to come8, warranting full implementation of global capital standards by banks and tighter regulation of non-bank financial institutions. In fact, hedge funds have been cited as a potential source of market instability due to elevated levels of synthetic and hidden leverage that can amplify liquidity risks. This has prompted calls for higher requirements for haircuts and margins on derivatives and securities financing transactions as well as measures for brokers’ risk management and stronger liquidity buffers.9 A new risk to global financial stability stems from the commodity markets as crude prices ruling above US $ 90 per barrel challenge 10-month highs due to Saudi Arabia and Russia extending voluntary production cuts to the end of 2023. The strength of the US dollar on safe haven demand is also making crude prices higher. Global inflation is once again under siege as deep deficits in global oil balances become persistent unless global demand is hit by a sharp economic downturn. Dispelling this global gloom, the Indian economy is picking up steam and strength. Real GDP growth for the first quarter of 2023-24 came in exactly at the nowcast presented in the August edition of the State of the Economy – at 7.8 per cent year-on-year (y-o-y) and just a shade below the projection of the MPC. Significantly, this was led by domestic drivers – private consumption and fixed investment – which offset the negative spill from net exports. In the second quarter, available indicators point to a gain in quarter-on-quarter (q-o-q) momentum on the back of domestic demand. Clothing and lifestyle retailers and shopping malls are experiencing a sharp recovery in sales across price points in the past few weeks. This has raised hopes of a pick-up in demand through the rest of the festival season that began with Raksha Bandhan and Onam, and cheers for discretionary retail spending. On watch are electronics and autos, which may be the next segments to attract festival spend. There are also indications that rural demand for fast moving consumer goods has swung back into positive territory after being under pressure for over a year. A key lead indicator will be how inflation evolves, with expectations of a sharp decline in September, on top of the August ebbing, fanning optimism. Looking ahead, India’s consumer market is expected to become the world’s third largest by 2027, with household per capita spending outpacing all other developing economies in Asia.10 On the investment side, capex by large central public sector enterprises (CPSEs) is strong at above 42 per cent of the annual target of Rs 100 crore, keeping pace with the emphasis on capital spending by the central government. Highways, the petroleum sector and railways are leading the surge in CPSE capex in the first five months of 2023-24. States have also boosted their capital outlays by close to 50 per cent year-on-year. On the other hand, the private corporate sector is reported to be continuing to go slow on capex11, although sectoral improvements are also being reported, based on projects sanctioned by banks/financial institutions.12 Supply responses are also improving. In spite of August turning out to be the driest and warmest since 1901, kharif sowing has kept pace with last year’s activity. According to the India Meteorological Department (IMD), precipitation in September is expected to be normal, ranging between 91 and 109 per cent of the long period average (LPA), which should restore reservoir levels and soil moisture content. In addition, the Indian Ocean Dipole has risen above the positive threshold (0.4 degrees Celsius), according to the Australian Bureau of Meteorology; and if sustained, it may boost the performance of the monsoon. Purchasing managers’ indices (PMIs) relating to manufacturing and services expanded on new orders and output in the case of the former and on exports and lower input costs in the latter. In August, India’s composite PMI turned out to be the highest among major economies. Providing a somewhat silver lining to domestic developments, headline inflation softened in August from the peak it had reached a month ago. As in the case of the upswing, the ebbing was driven by a reversal in the prices of vegetables. Hearteningly, the correction is not complete, and more is expected to drive down retail inflation in its September reading. Furthermore, there are early indication of corrections in a broad range of vegetable prices going beyond the TOP13 group. An important development for the conduct of monetary policy is the stabilizing of core inflation, which also reflects a broad-based easing of price pressures across its constituents, both goods and services. Both rural and urban CPI inflation have eased, each tracking the magnitude of easing of the headline. Set against this backdrop, the remainder of the article is structured into four sections. Section II sketches the rapidly evolving developments in the global economy. The evolution of the domestic economy is laid out in Section III. Section IV evaluates the domestic financial conditions, while the last Section sets out concluding remarks. Global Setting The outlook for the global economy remains ambivalent, driven by a dichotomy in macroeconomic conditions across regions. While expectations of a ‘Goldilocks’ soft landing in the US are strengthening, concerns about slowdowns in China and Europe are rife. The impact of aggressive monetary tightening is spreading, with the services sector joining housing, bank lending and industrial production in a loss of momentum. Our model-based nowcast for global GDP points towards muted global growth in Q3:2023 (Chart 1), which may extend into the latter half of 2023 and early 2024.14 During the rest of the current decade as well as the next, global growth is projected to be lower than in the previous two decades, especially amongst the Advanced Economies (AEs) [Chart 2]. Emerging economies, on the other hand, are likely to become a key engine of the global economy. 
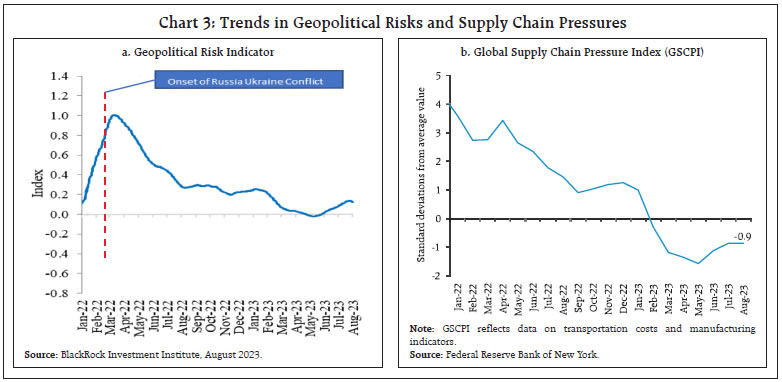 The balance of risks around the global outlook has tilted to the downside, with geopolitical risks having risen in recent months (Chart 3a), although global supply chain pressures remain below their historical average level in August (Chart 3b). Consumer sentiment is mixed across jurisdictions, reflecting uncertainty about households’ future financial situation and general economic conditions (Chart 4a). Financial conditions have tightened across economies such as China, the EU, the UK and the US (Chart 4b). The global composite purchasing managers’ index (PMI) fell to 50.6 in August from 51.6 in July, pulled down by service sector business activity, which was at its weakest since February 2023. The manufacturing PMI exhibited a sequential pick-up, albeit in the contraction zone as it remains weighed down by declines in production, new orders, and slowdown in export business (Chart 5).
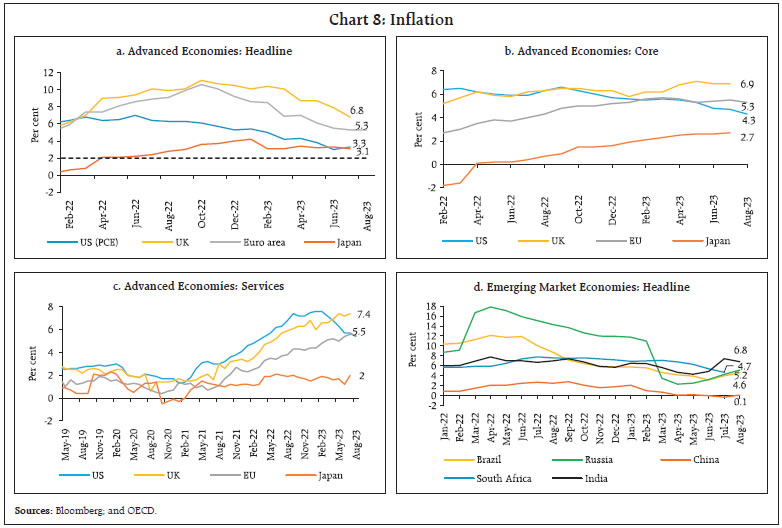
Global trade activity continues to face significant headwinds. Export orders for manufacturing, as evident from PMIs, remained in contraction in August, in spite of a modest sequential improvement (Chart 6). Export orders for services, however, remained in the expansionary zone, partly offsetting the drag from manufacturing. Global commodity prices generally softened in August and the Bloomberg commodity price index eased by 3.6 per cent month-on-month (m-o-m) [Chart 7a]. Gold prices declined in tandem with a stronger dollar and higher treasury yields (Chart 7b). The Food and Agriculture Organization’s (FAO’s) food price index declined by 2.1 per cent (m-o-m) in August as prices of dairy products, vegetable oils, meat and cereals declined (Chart 7c). Food grain prices, which had surged after Russia pulled out of the Black Sea Grain deal in June, have since retreated partly. Supply cuts from OPEC+15 in early August and signals of further reductions drove crude oil prices up to average US$ 86.2 per barrel in August and further in September to US$ 91.8 per barrel (as on September 14, 2023) [Chart 7d].  Headline inflation, which receded from multi-year peaks over the course of last year, recorded a marginal uptick or a slowdown in the pace of its decline in most economies during July-August. As per flash estimates, Euro area inflation remained steady at 5.3 per cent (y-o-y) in August 2023 (Chart 8a). In the US, CPI inflation increased to 3.7 per cent in August from 3.2 per cent in July. Inflation based on the US personal consumption expenditure (PCE) price index edged up to 3.3 per cent in July from 3.0 per cent in June. CPI inflation eased in the UK, to 6.8 per cent in July 2023, the lowest since February 2022, and in Japan (CPI excluding fresh food) to 3.1 per cent in July (3.3 per cent in June). Core and services inflation continue to rule above headline inflation in major AEs (Chart 8b and 8c). Among the emerging market economies (EMEs), inflation edged up in Brazil, China, and Russia in August (Chart 8d). 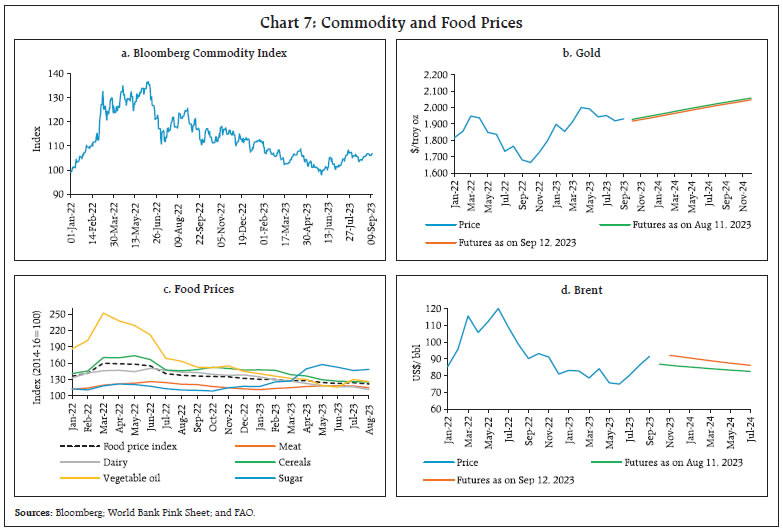
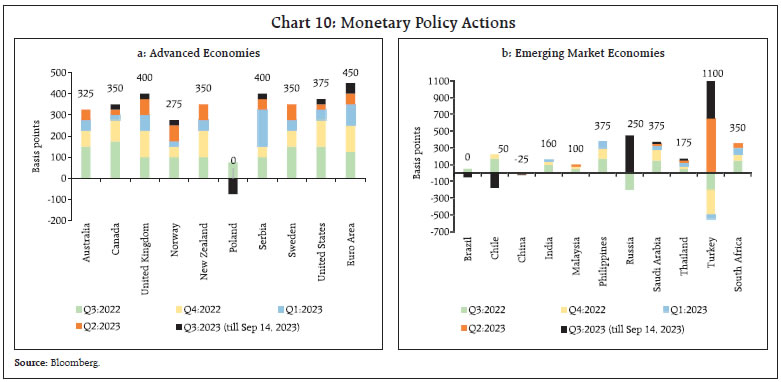
 Global equity indices declined in August and early September as hawkish minutes from the Federal Reserve’s July policy meeting and subsequent resilient economic data releases led to expectations of a prolonged period of higher policy rates (Chart 9a). Bond yields hardened following the announcement of large debt issuance worth US$ 1 trillion by the US Treasury in Q3:2023 and the sovereign rating downgrade by Fitch Ratings. In the US, yield curve inversion has persisted since July 2022 (Chart 9b). In the currency markets, the US dollar maintained its appreciating bias on expectations of prolonged monetary policy tightening, especially in the wake of higher inflation readings. Concomitantly, the Morgan Stanley Capital International (MSCI) currency index for EMEs shed gains by 1.5 per cent in August as capital outflows continued (Chart 9c and 9d). AE central banks continued to tighten policy rates while some opted for a pause (Chart 10a). In their August policy meetings, the Bank of England and Norges Bank raised their key rates by 25 bps. The European Central Bank (ECB) raised its key interest rate by 25 bps to a record high of 4 per cent on September 14, 2023 and assessed that maintaining the current levels of interest rates for an extended period will significantly aid in timely return of inflation to the target. On the other hand, Canada, Australia, New Zealand and South Korea held their policy rates unchanged in their latest meeting. Most EME central banks also kept their policy rates unchanged in their August meetings. The central bank of Brazil, however, cut its benchmark interest rate by 50 bps in August after almost a year-long pause and Poland embarked on a rate cutting cycle, lowering its policy rate by 75 bps in its September meeting after staying on hold since October 2022. The People’s Bank of China (PBoC) cut its one-year loan prime rate (LPR), one-year medium-term lending facility (MLF) rate and the seven-day reverse repo rate by 10 bps, 15 bps and 10 bps, respectively. On the other hand, the Bank of Russia, in its off-cycle meeting in August 2023, increased its key rate by 350 bps and by another 100 bps in its scheduled September meeting (Chart 10b). 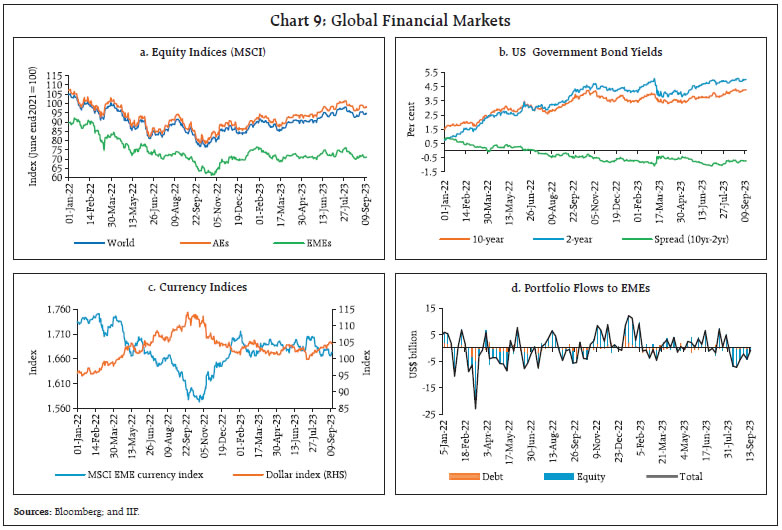
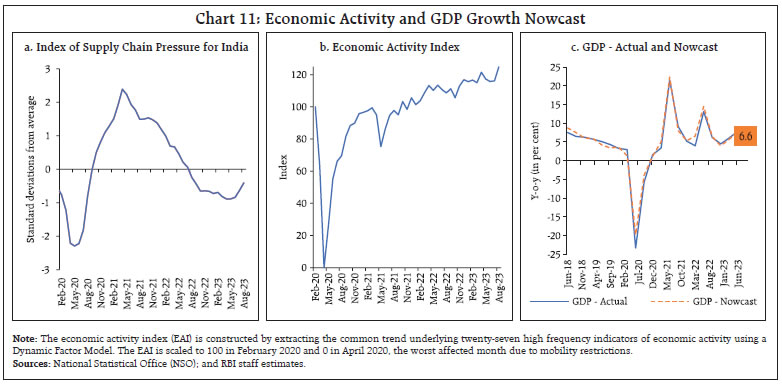 III. Domestic Developments The Indian economy remains an outlier amidst darkening global prospects. Supply chain pressures in India remain below historical average levels despite a pick-up since May 2023 (Chart 11a). Our economic activity index (EAI) nowcasts GDP growth for Q2:2023-24 at 6.6 per cent (Chart 11b and 11c). Aggregate Demand According to the quarterly estimates released by the National Statistical Office (NSO), the Indian economy grew solidly on a year-on-year basis in Q1:2023-24 (Chart 12). Private final consumption expenditure, the mainstay of aggregate demand with a share of 57.3 per cent in gross domestic product (GDP), recorded a growth of 6.0 per cent. Buoyed by the government’s thrust on infrastructure and exuberant real estate activity, gross fixed capital formation (GFCF) grew by 8.0 per cent, maintaining its share at 34.7 per cent of GDP. Acceleration in investment activity is also corroborated by robust growth in steel consumption, cement production, as well as capital goods production and imports. With import growth exceeding that of exports, net exports dragged real GDP growth by 4.6 percentage points in Q1. 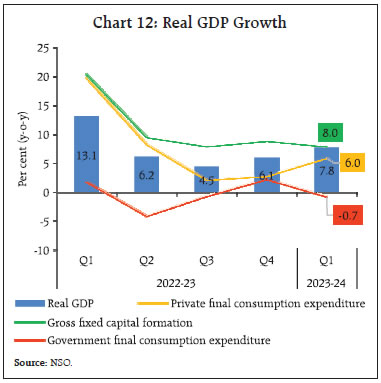
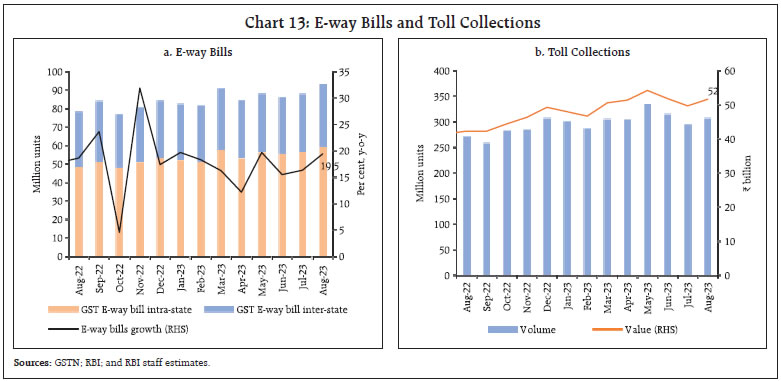 Among lead indicators of demand conditions, e-way bill volumes touched a historical high of 93.4 million units in August 2023 due to stockpiling of goods by businesses in the run-up to the festival season16 and increased compliance obligations (Chart 13a). Toll collection expanded in August after witnessing a decline over the preceding two months consecutively (Chart 13b). Automobile sales registered a y-o-y expansion of 3.6 per cent in August 2023, with passenger vehicle sales rising to an all-time high on robust demand for sports utility vehicles (Chart 14a). Three-wheeler sales were the highest since October 2019. Two-wheeler sales reverted to positive y-o-y growth, led by scooters, after a sharp contraction in the previous month (Chart 14b). Retail sales growth as reflected in vehicle registrations moderated sequentially (Chart 14c). As per the Federation of Automobile Dealers Association (FADA), inventory levels for passenger vehicles hit an all-time high in August ahead of the festival season. The daily average consumption of petroleum products accelerated in August as manufacturing and construction activity remained robust17 and mobility increased (Chart 14d). The all-India unemployment rate (UR) edged up to 8.1 per cent in August 2023 on account of higher UR in urban areas while rural unemployment fell (Chart 15a). The labour force participation rate (LFPR) and the employment rate (ER), recorded an increase, with the urban LFPR rising to its highest level since the onset of the pandemic (Chart 15b). The employment outlook in the organised sector, as polled by the PMI for manufacturing and services, remained in the expansionary zone, with services employment expanding at its fastest pace in nine months (16). The demand for work under the Mahatma Gandhi National Rural Employment Guarantee Scheme (MGNREGS) continued to decline in August, reflecting increasing labour demand for kharif crop operations in the rural parts of the country (Chart 17).
India’s merchandise exports at US$ 34.5 billion in August 2023 remained in contraction for the seventh consecutive month. The pace of decline, however, moderated to single digit rate of 6.8 per cent (y-o-y) for the first time since March 2023, aided by favourable base effect (Chart 18). More than two-fifth of the export basket (15 out of 30 major commodities) registered a y-o-y decline. Petroleum products, gems and jewellery, chemicals, rice and ready-made garments (RMG) of all textiles dragged exports down whereas engineering goods, electronic goods, cotton yarn, fabrics, iron ore, and drugs and pharmaceuticals supported export growth in August 2023. Petroleum products export fell for the sixth consecutive month. After witnessing contraction for eight consecutive months, engineering goods, which account for more than one-fourth of the export basket, grew by 7.7 per cent on a y-o-y basis (Chart 19). Following the prohibition of exports of non-basmati white rice on July 20, 2023 the Government introduced an export duty of 20 per cent on parboiled rice on August 25, 2023 (for exports till mid-October to curb rising domestic prices and ensure adequate domestic availability), and a minimum export price of US$ 1200 per metric tonne of basmati rice on August 27, 2023 to check illegal exports of non-basmati rice, misclassified as parboiled or basmati rice.18 In volume terms, parboiled and basmati rice together accounted for two-third of overall rice exports in June 2023 (Chart 20a). Additionally, the Government imposed a 40 per cent duty on onion exports on August 19, 2023 (effective till the end of 2023) to increase the domestic availability of onions. Onion exports have witnessed a sharp rise in 2022-23 and 2023-24 so far (up to June) [Chart 20b]. Merchandise imports at US$ 58.6 billion registered a contraction of 5.2 per cent (y-o-y) in August 2023, the seventh consecutive month of contraction. The pace of decline, however, moderated from 17.0 per cent in the previous month due to a favourable base effect and a positive momentum. More than two-fifth of the import basket (15 out of 30 major commodities) registered a decline on a y-o-y basis (Chart 21). Petroleum, oil and lubricants (POL), coal, fertilisers, organic and inorganic chemicals and silver were the main items that dragged imports down while gold, chemical material and products, dyeing, tanning and colouring materials, machinery and electronic goods contributed positively in August 2023 (Chart 22). With higher momentum in imports than in exports, the merchandise trade deficit in August increased by US$ 5.7 billion on a sequential basis to reach a ten-month high of US$ 24.2 billion. The oil deficit also widened to a 3-month high, accounting for about 30 per cent of the overall deficit (Chart 23). During April-August 2023, India’s merchandise exports at US$ 172.9 billion contracted by 11.9 per cent (y-o-y). Merchandise imports at US$ 271.8 billion declined by 12.1 per cent (y-o-y). Consequently, the merchandise trade deficit narrowed to US$ 98.9 billion from US$ 112.9 billion during the corresponding period a year ago. Petroleum products were the major source of the trade deficit, followed by electronic goods (Chart 24a). Country-wise, China and Russia remained the major sources of the trade deficit for the April-July period (Chart 24b).
India’s services exports at US$ 26.2 billion in July 2023 recorded a growth of 8.1 per cent (y-o-y), mainly due to an increase in software services and business services receipts (Chart 25).
As per the Controller General of Accounts (CGA), the gross fiscal deficit (GFD) of the Central government during April-July 2023 stood at 33.9 per cent of the budget estimates (BE) for 2023-24, higher than 20.5 per cent of BE during the corresponding period last year. This is attributable to an increase in capital expenditure by 52.0 per cent (y-o-y) and revenue expenditure by 15.9 per cent (y-o-y) [Chart 26a]. Notably, revenue expenditure when netted out for interest payments and major subsidies (comprising food, fertilisers and petroleum) also grew by 18.7 per cent (y-o-y). Capital outlay recorded an increase of 40.7 per cent, resulting in a marked improvement in the quality of spending (Chart 26b). On the receipts side, during April-July 2023-24 direct tax collections contracted by 1.7 per cent (y-o-y) owing to a 10.4 per cent decline in corporate tax collections, while income tax receipts recorded a growth of 6.4 per cent. Indirect tax collections grew by 7.6 per cent (y-o-y), with the growth in goods and services tax (GST) and customs revenues outweighing the contraction in excise duties.19 While gross tax revenue grew by 2.8 per cent (y-o-y), net tax revenue contracted by 12.6 per cent due to higher tax devolution to State governments in June and July 2023 with the release of one advance instalment of tax devolution to States in June 2023 to enable them to expedite capital spending20 (Chart 27).
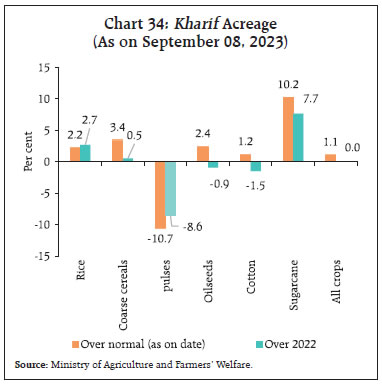
Non-tax revenue collection grew by 99.6 per cent (y-o-y) on account of more than budgeted surplus transfer from the Reserve Bank21, compensating for sub-par tax collections and non-debt capital receipts22 (Chart 28). Total receipts recorded a contraction of 1.4 per cent on a y-o-y basis GST collections (Centre plus States) grew by 10.8 per cent (y-o-y) to ₹1.59 lakh crore in August 2023. The average monthly gross GST collection during April-August 2023-24 stood at ₹1.66 lakh crore, up from ₹1.49 lakh crore a year ago. As per the accounts data for April - July 2023-24, states’ GFD23 as a proportion of the full year BE was marginally higher than a year ago (Chart 29a). Growth in revenue receipts, though lower than a year ago, was higher than revenue expenditure, leading to a surplus in the revenue account (Chart 29b). On the other hand, a sharp pick up in capital expenditure offset the revenue surplus, resulting in a marginal increase in the GFD. Out of the budgeted ₹1.3 lakh crore 50-year interest free loan for States’ capital expenditure in the ‘Scheme for Special Assistance to States for Capital Investment’, ₹29,518 crore was released by the Centre during April-July 2023. Among the 12 States which received these loans24, 8 States witnessed a growth of 69 per cent in their capital expenditure. Aggregate Supply Real gross value added (GVA) at basic prices – a measure of aggregate supply – grew by 7.8 per cent in Q1:2023-24 vis-a-vis 11.9 per cent a year ago. Services remained the primary contributor to growth, while agriculture and industrial sector activity remained steady (Chart 30). Agriculture, forestry, and fishing registered a robust growth of 3.5 per cent in Q1, driven by record rabi production. Manufacturing – the dominant component of the industrial sector – exhibited robust growth of 4.7 per cent in Q1, driven by improved corporate profit margins as input cost pressures tapered. Within the services sector, financial, real estate and professional services growth surged to 12.2 per cent in Q1, with continued exuberance in credit and deposit growth, and robust profit margin and salary growth in information technology (IT) companies. The cumulative south-west monsoon (SWM) season rainfall, which was highly deficient in June 2023, recovered and exceeded the LPA by 5 per cent by end-July. The subsequent period, however, witnessed a large deficit in rainfall, resulting in the cumulative SWM rainfall (June 1 to September 12, 2023) being 10 per cent below LPA. The production weighted rainfall index (PRN) was also short by 11 per cent of its LPA during this period (Chart 31). Adequate rainfall in July led to most of the States recording normal rainfall on a cumulative basis, barring a few in south peninsula and east and northeast region (Chart 32). The reservoir position as of September 06, 2023 indicates that the current storage level is lower than in the previous year as well as the decadal average (Chart 33). 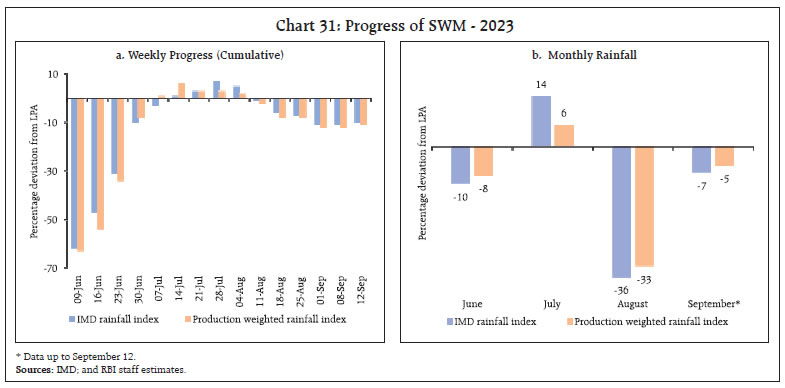 As on September 08, 2023, the total kharif sown area stood at 1,088.5 lakh hectares (99.7 per cent of full season normal area), almost at the previous year’s level (Chart 34). While area under rice, coarse cereals and sugarcane remained higher than last year, acreage under pulses, oilseeds and cotton lagged. Rice, which accounts for 37 per cent of kharif full season normal area, progressed steadily despite the erratic and uneven SWM. Sown area in the major States producing kharif pulses, except Rajasthan, registered a decline over a year ago’s coverage due to delayed and deficient monsoon (Chart 35). As per the 3rd advance estimates (AE) of agriculture production for 2022-23, kharif pulses constitute 28.5 per cent of total pulses production in the country, with crops such as tur, and urad majorly being sown during the kharif season. 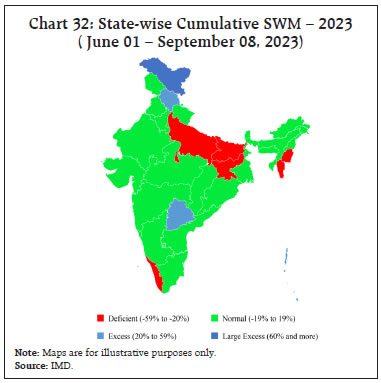

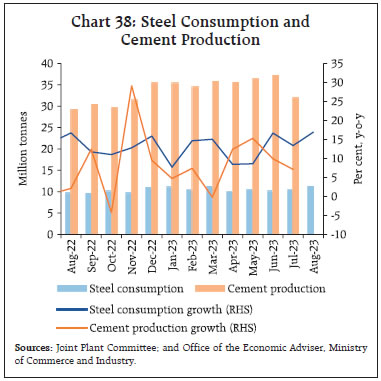
 As on August 15, stock of rice and wheat with Food Corporation of India (FCI) and other public agencies remained comfortable at 355.7 lakh tonnes (2.6 times the buffer norm) and 273.7 lakh tonnes (1.0 times the norm), respectively. To ensure domestic availability in the wake of growing uncertainty towards kharif production in an El Nino year, the Government has undertaken a number of supply-side initiatives, in addition to the trade related measures discussed earlier. On August 09, the government announced that 50 lakh metric tonnes (LMT) of wheat and 25 LMT of rice would be offloaded in the open market in a phased manner under Open Market Sale Scheme (Domestic) [OMSS(D)] through e-auctions. So far (up to August 30), the government has sold 12.8 lakh tonnes of wheat and 0.33 lakh tonnes of rice in the e-auctions conducted since the announcement on June 12, 2023.25 The headline PMI for the manufacturing sector expanded to 58.6 in August 2023, recording the second highest acceleration since October 2020 (Chart 36a). The PMI for services moderated in August from a 13-year high last month due to moderation in new business, although the index remains in the expansionary zone, well above its historical average (Chart 36b). Transport indicators remained upbeat in August 2023. Cargo traffic at major ports continued to show resilient y-o-y growth (Chart 37a). Railway freight traffic recorded an uptick in August y-o-y growth as compared to previous month, driven by an increase in freight of iron ore and containerised cargo (Chart 37b). Coincident indicators of the construction sector remain strong in August. Steel consumption increased by 16.9 per cent (y-o-y) in August owing to continued impetus from the government’s infrastructure spending while cement production increased by 7.1 per cent (y-o-y) in July 2023 (Chart 38). High-frequency indicators for the services sector reflects a broad-based uptick in overall economic activity in August 2023, as shown by higher y-o-y growth in steel consumption, GST e-way bills, railway freight and port cargo traffic (Table 2). 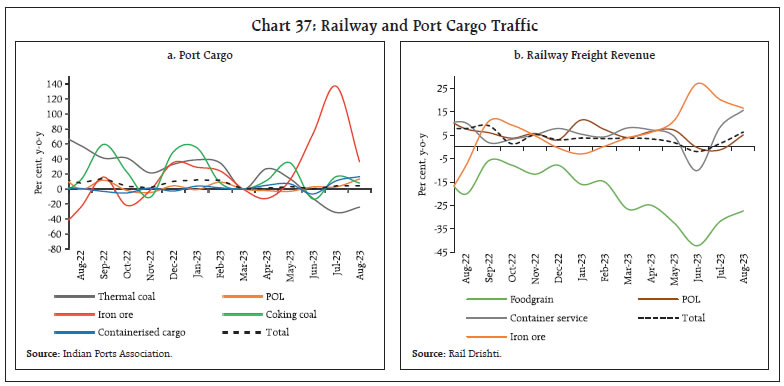
 In terms of regional policy initiatives, Odisha is set to open customer service point (CSP) Plus banking outlets in unbanked gram panchayats (GPs) that offer rent-free banking spaces for five years and cover one-time fixed and recurring expenses. Chhattisgarh initiated the Gramin Awas Nyay Yojana-Rural (GANY) to provide homes to the homeless and offer one year unemployment allowances through the Berojgari Bhatta Yojana, which can be extended for an additional year if employment is not secured. Servotech Power Systems Ltd. has entered into a Memorandum of Understanding (MoU) with Uttar Pradesh to establish an EV charger manufacturing plant. Madhya Pradesh approved the disbursement of ₹6,000 each to eligible farmers under the Kisan Kalyan Yojana for 2023-24.
Inflation Headline inflation, as measured by y-o-y changes in the all-India consumer price index (CPI)26, moderated to 6.8 per cent in August 2023 from 7.4 per cent in July (Chart 39). The 60 bps softening in inflation came from a negative momentum of around 10 bps which was supported by a favourable base effect of about 50 bps. The negative momentum was on account of a m-o-m decline of about 50 bps in food prices, which was partially offset by positive momentum of around 15 bps in fuel prices, and 40 bps in the core group (i.e., excluding food and fuel). At a disaggregated level, the decline in price pressures was broad-based – the combined weight of items in the CPI basket which recorded below 0.5 per cent momentum went up to 64.8 per cent in August 2023 from 57.9 per cent in July (Chart 40). Food inflation (y-o-y) fell to 9.2 per cent in August from 10.6 per cent in July as the negative momentum was reinforced by a favourable base effect. In terms of sub-groups, inflation in vegetables softened sharply, though it remained elevated (Chart 41). Inflation moderated in cereals, milk, pulses and prepared meals, while it edged up in spices, fruits, eggs, meat and fish. Edible oils continued to record deflation, albeit at a lower rate.
Inflation in the fuel and light group increased to 4.3 per cent in August from 3.7 per cent in July. Electricity prices recorded double-digit inflation (13.5 per cent y-o-y). While inflation in LPG prices softened in line with a sequential decline in prices, kerosene prices recorded a lower rate of deflation. Core inflation remained steady at 4.9 per cent in August. While inflation in clothing and footwear, housing, household goods and services, recreation and amusement, and personal care and effects moderated, it increased in pan, tobacco and intoxicants (Chart 42). In terms of regional distribution, rural inflation at 7.02 per cent was higher than urban inflation at 6.59 per cent in August 2023. Majority of the States registered inflation in the range of 6-8 per cent. Arunachal Pradesh, Goa and Delhi experienced inflation of less than 4 per cent (Chart 43). High frequency food price data for September so far (up to 12th) show that cereal prices exhibited further increases, mainly driven by rice and pulses prices rose mainly for tur and gram (Chart 44). Among edible oils, mustard and sunflower oil prices continued to decline. Within key vegetables, tomato prices continued their precipitous fall as fresh harvest arrivals strengthened and logistics improved during the monsoon break phase (Chart 45). Onion prices started moving upward owing to seasonal shortage during July-August and storage losses in rabi crops following unseasonal rains during the pre-monsoon phase in Maharashtra and Karnataka. Retail selling prices of petrol and diesel in the four major metros remained steady in September so far (up to 12th). While kerosene prices increased further, LPG prices were cut by ₹200 per cylinder on August 30, 2023 and have been kept unchanged in September so far (Table 3). The PMIs for August 2023 indicate a further uptick in input cost in the manufacturing sector while softening for services. Selling prices, on the other hand, moderated in manufacturing while they increased for the services sector (Chart 46). The all-India house price index (HPI)27 increased by 5.1 per cent (y-o-y) during Q1:2023-24, its highest increase in the last eighteen quarters (Chart 47). On a sequential (q-o-q) basis, HPI increased by 2.6 per cent, with eight of the ten cities recording a rise in house registration prices. | Table 3: Petroleum Products Prices | | Item | Unit | Domestic Prices | Month-over-month (per cent) | | Sep-22 | Aug-23 | Sep-23^ | Aug-23 | Sep-23^ | | Petrol | ₹/litre | 102.92 | 102.92 | 102.92 | 0.0 | 0.0 | | Diesel | ₹/litre | 92.72 | 92.72 | 92.72 | 0.0 | 0.0 | | Kerosene (subsidised) | ₹/litre | 60.13 | 47.65 | 54.89 | 7.7 | 15.2 | | LPG (non-subsidised) | ₹/cylinder | 1063.25 | 1100.35 | 913.25 | -1.2 | -17.0 | ^: For the period September 1-12, 2023.
Note: Other than kerosene, prices represent the average Indian Oil Corporation Limited (IOCL) prices in four major metros (Delhi, Kolkata, Mumbai and Chennai). For kerosene, prices denote the average of the subsidised prices in Kolkata, Mumbai and Chennai.
Sources: IOCL; Petroleum Planning and Analysis Cell (PPAC); and RBI staff estimates. |
IV. Financial Conditions In consonance with the strategy of calibrated withdrawal, surplus liquidity in the banking system moderated considerably since August 12, 2023 following the imposition of the incremental CRR (I-CRR) which impounded liquidity of about ₹1.13 lakh crore from the banking system. Liquidity increased towards the end of the month and in early September in response to larger government spending but moderated thereafter. Reflecting these developments, average total absorption under the liquidity adjustment facility (LAF) declined sharply to about ₹1.0 lakh crore during August 16 to September 12, 2023 from ₹1.9 lakh crore during July 16 - August 15 (Chart 48). Of the total average surplus liquidity, placement of funds under the standing deposit facility (SDF) averaged ₹0.8 lakh crore while the remaining amount was mopped up through variable rate reverse repo (VRRR) operations. 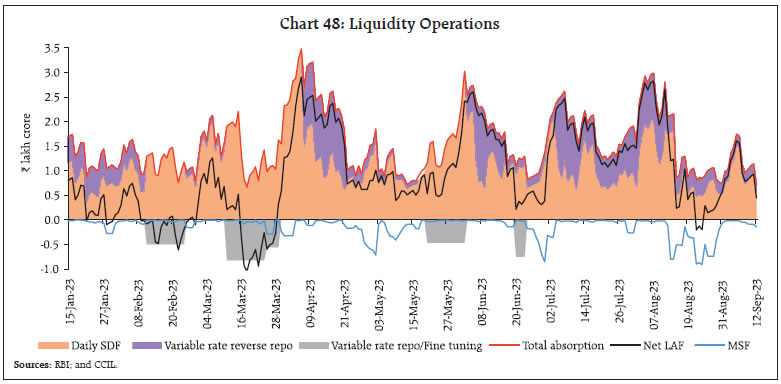 With moderation in surplus liquidity, net absorption under the LAF came down to ₹0.6 lakh crore during August 16 to September 12, 2023 from ₹1.7 lakh crore during July 16 - August 15, 2023. During this period, net LAF slipped into deficit (first time in the current financial year) for three consecutive days, i.e., August 21-23, when average recourse to the marginal standing facility (MSF) was in excess of ₹0.89 lakh crore. Drawals under the MSF peaked at ₹0.91 lakh crore on August 23 and averaged ₹0.31 lakh crore during August 16 to September 12, 2023 (₹0.13 lakh crore during July 16 - August 15). The shrinkage in surplus liquidity was also reflected in overnight money market conditions. During August 17 to September 12, the weighted average call rate (WACR) firmed up and breached the ceiling of the LAF corridor on 5 occasions. On average, the WACR, triparty repo and market repo rates traded 14 bps, 12 bps and 14 bps, respectively, above the policy repo rate (Chart 49a). Across the term money segment, the yield on 3-month certificates of deposit (CDs) and commercial paper (CP) for non-banking financial companies (NBFCs) stayed elevated, while the yield on 3-month treasury bills (T-bills) was broadly aligned with the MSF rate (Chart 49b). In the primary market, fund mobilisation through issuances of CDs remained robust at ₹2.39 lakh crore during 2023-24 (up to August 25) on account of higher growth in credit vis-a-vis that of deposits. Furthermore, the I-CRR also prompted banks to resort to fresh CD issuances for their funding requirements − ₹5.88 lakh crore (up to August 31) they were marginally higher than ₹5.50 lakh crore in the corresponding period of the previous year. After easing in the second half of August, domestic bond yields firmed up in tandem with US treasury yields but softened on September 13, taking cues from the lower than expected CPI inflation reading for August. The yield on the old 10-year benchmark G-sec (7.26 per cent GS 2033) remained almost unchanged at 7.20 per cent on September 13, 2023 as against 7.21 per cent on August 14 (Chart 50a). The yield on the new 10-year benchmark (7.18 per cent 2033) eased to 7.17 per cent from 7.18 per cent on August 14. Although the yield on the 10-year US treasury eased from a high of 4.34 per cent on August 21 consequent upon benign employment and inflation data releases, it hardened thereafter as resilient economic data and higher inflation prints fuelled expectations of a prolonged period of elevated interest rates. Overall, the domestic yield curve flattened as the short to mid-end of the curve hardened while long term bond yields softened (Chart 50b). 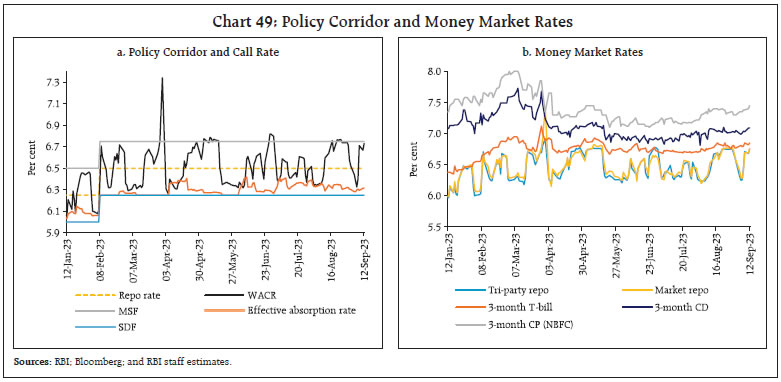 Corporate bond yields and associated risk premia generally increased during August 17 to September 12, 2023; however, the average risk premia in the bond market (5-year AAA minus 5 year G-sec) declined by 6 bps, indicating healthy investor appetite in this segment (Table 4). Favourable market conditions on the back of stable long term-yields and a cost advantage over bank loans increased the preference for corporate bonds. Overall, corporate bond issuances during the year so far (up to July) at ₹2.9 lakh crore was nearly twice ₹1.5 lakh crore during the same period last year. 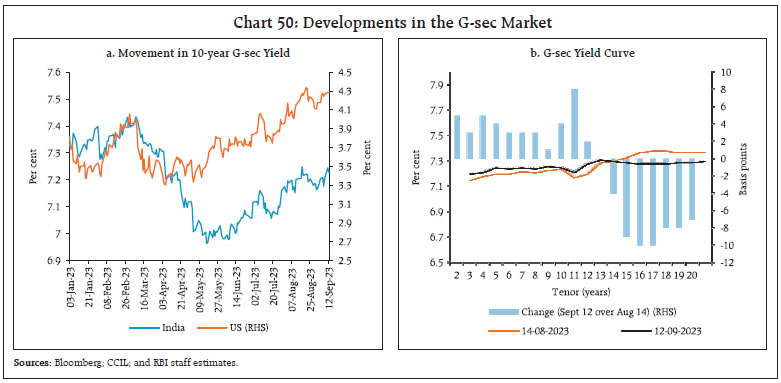
| Table 4: Financial Markets - Rates and Spread | | Instrument | Interest Rates (per cent) | Spread (basis points) (Over Corresponding Risk-free Rate) | | Jul 17, 2023 – Aug 14, 2023 | Aug 17, 2023 – Sept 12, 2023 | Variation | Jul 17, 2023 – Aug 14, 2023 | Aug 17, 2023 – Sept 12, 2023 | Variation | | 1 | 2 | 3 | (4 = 3-2) | 5 | 6 | (7 = 6-5) | | Corporate Bonds | | (i) AAA (1-year) | 7.57 | 7.68 | 11 | 56 | 55 | -1 | | (ii) AAA (3-year) | 7.79 | 7.90 | 11 | 56 | 58 | 2 | | (iii) AAA (5-year) | 7.69 | 7.71 | 2 | 44 | 38 | -6 | | (iv) AA (3-year) | 8.39 | 8.50 | 11 | 116 | 118 | 2 | | (v) BBB-(3-year) | 12.00 | 12.18 | 18 | 478 | 486 | 8 | Note: Yields and spreads are computed as monthly averages.
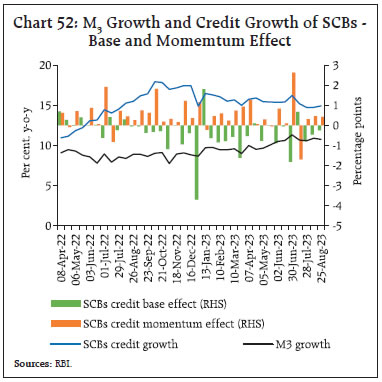
Sources: FIMMDA; and Bloomberg. | Reserve money (RM), excluding the first-round impact of change in the CRR28 recorded a growth of 6.0 per cent (y-o-y) as on September 8, 2023 (8.5 per cent a year ago) [Chart 51]. Currency in circulation (CiC), the largest component of RM, decelerated to 4.0 per cent from 8.2 per cent a year ago, reflecting the withdrawal of ₹2000 banknotes29 − 93 per cent has been returned to the banking system, mostly in the form of deposits (as on August 31, 2023). Excluding the impact of the merger of a non-bank with a bank (with effect from July 1, 2023), money supply (M3) growth, as on August 25 was higher at 10.8 per cent (y-o-y) than 8.9 per cent in the corresponding period last year. Aggregate deposits with banks, the largest component of M3, increased by 11.8 per cent (9.0 per cent a year ago). SCBs’ credit (excluding the impact of the merger) growth registered a slight moderation amidst ongoing deposit mobilisation efforts by the banking sector (Chart 52). The incremental credit-deposit ratio moderated further to 88.9 per cent, net of merger, from the peak of 142.2 per cent as on November 4, 2022.30 The merger had a larger impact on SCBs’ credit than on deposits (Box 1). 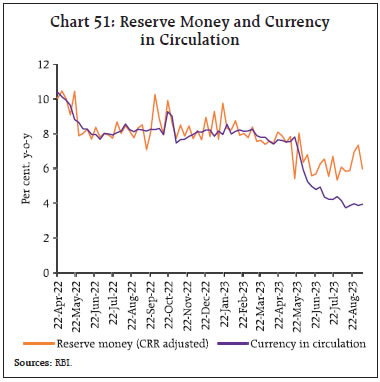
Box 1: Merger of HDFC Ltd with HDFC Bank: Implications on Money Supply The impact on monetary aggregates from the recent merger31 of a non-bank (HDFC Ltd.) with a bank (HDFC Bank) is different from the merger of two banks as there is an expansion of the balance sheet of the banking system in the former case than in the latter case. As money supply (M3) is a lateral aggregation of liabilities of the banking system, monetary aggregates remain unaffected in the case of a merger of two banks. On the other hand, in the case of a merger of a non-bank with a bank, time deposits of the non-bank will be included in the money supply though its major liabilities, viz., borrowings and capital market instruments are excluded. Consequently, on the components side, there is an accretion to the time and hence aggregate deposits. On the sources side, lending by the bank to the erstwhile non-bank is now considered as intra-bank lending and cancels out; but the entire loan portfolio of the non-bank becomes a part of the merged bank’s assets and as such, the overall bank lending to the commercial sector increases. Accordingly, a difference of 70 bps (as on August 25, 2023) has been observed between growth rates of M3, including and excluding the impact of the merger. The divergence is sharper for SCBs’ credit, a major source of variation in M3, which registered a growth of 19.8 per cent including the impact of merger, as the large loan portfolio of HDFC Ltd. is now part of the banking system (Chart B1). | Metropolitan branches of SCBs, which accounted for around 60 per cent of bank credit in June 2023, exhibit larger fluctuations in sync with business cycles. As post-pandemic business activity normalised, credit growth across geographies (viz., rural, semi-urban, urban and metropolitan regions) has converged (Chart 53). Personal loans (housing and non-housing), which have supported overall credit expansion in the recent years, recorded some deceleration but continue to grow well above the headline credit growth (Chart 54). Export credit by SCBs has been declining and its y-o-y growth turned negative for the last four quarters (up to Q1:2023-24), reflecting the overall moderation in exports (Chart 55).
With a rise in the policy rate, the share of loans below 8 per cent interest rate has come down from 53 per cent in March 2022 to 18 per cent in June 2023. The share of bank loans at interest rate of 10 per cent or above increased from 22 per cent to 34 per cent over this period (Chart 56).
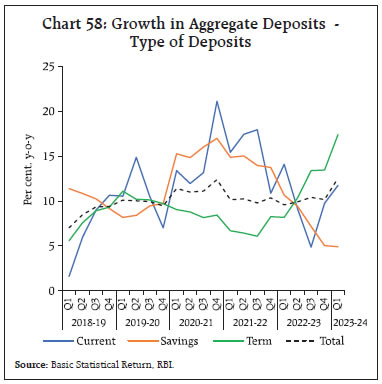
There has been an increase in the share of term deposits offering 7 per cent and above returns in the recent period (Chart 57). As a result, growth of term deposits picked up while savings deposits decelerated, reflecting the relative attractiveness of term deposits in an increasing interest rate environment (Chart 58). 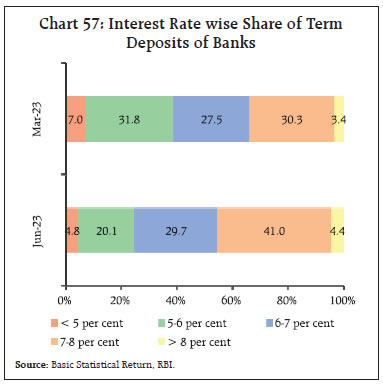
 In response to the 250 bps hike in the policy repo rate since May 2022, 32 domestic banks have revised their repo-linked external benchmark-based lending rates (EBLRs) upwards by a similar magnitude. The 1-year median marginal cost of funds-based lending rates (MCLRs) of SCBs increased by 155 bps during May 2022 – August 2023 (Chart 59). Concomitantly, the weighted average lending rates (WALRs) on fresh and outstanding rupee loans increased by 193 bps and 112 bps, respectively, during the period May 2022 – July 2023. On the deposit side, the weighted average domestic term deposit rates (WADTDR) on fresh and outstanding deposits increased to 232 bps and 151 bps, respectively, during the same period. During July 2023, the SCBs increased their WALR on fresh rupee loans by 24 bps, whereas the WADTDR on fresh deposits remained broadly unchanged. Transmission across bank groups from May 2022 to July 2023 indicates that the increases in the WADTDR on fresh rupee deposits and WALR on fresh rupee loans were higher in the case of public sector banks, while the increases in WADTDR on outstanding deposits and WALR on outstanding loans were higher for private banks (Chart 60). 
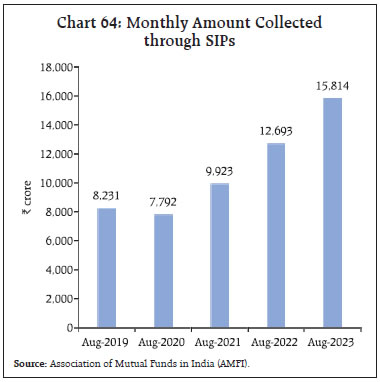
 Domestic equity markets declined in the second half of August 2023 amidst rising concerns of a prolonged period of high global interest rates to control inflation as markets digested hawkish indications in the Federal Open Market Committee (FOMC) minutes from the July 2023 meeting and the Jackson Hole address of the Federal Reserve Chairman. However, markets recovered in early September following the release of strong domestic Q1:2023-24 GDP data and robust manufacturing and services PMIs. Equities gained further with the moderation in headline inflation in August, and a surge in industrial output also boosted investor sentiments. Overall, the BSE Sensex increased by 3.7 per cent since August 14, 2023 to close at an all-time high of 67,839 on September 15, 2023. The broader indices (BSE MidCap and BSE SmallCap) have outperformed the benchmark indices in the recent period (Chart 61). SmallCap and MidCap funds have also recorded significant inflows in 2023-24 so far (up to August 2023) [Chart 62]. In comparison with the cash market, a more pronounced expansion has been recorded in the derivatives segment of the equity market (Chart 63). Furthermore, there has been a renewed surge in fresh demat account openings, with over 1.8 crore additions in 2023 so far (up to August) taking the total number of demat accounts in the country to 12.7 crore. Investments through systematic investment plans (SIPs) crossed ₹15,000 crore for the first time in July 2023 and rose further to ₹15,814 crore in August. The resilience of SIP investments over the last few years amidst volatile market conditions is a testament to the rising financialisation of savings and growing maturity of retail investors (Chart 64). The latter have also taken advantage of the opportunity to invest directly in government securities through the RBI Retail Direct platform amidst attractive interest rates on these securities.32 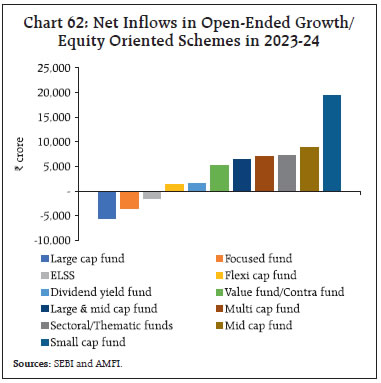

 Gross inward foreign direct investment (FDI) moderated to US$ 22.0 billion during April-July 2023 from US$ 29.6 billion a year ago (Chart 65). Around two-third of the FDI equity flows were directed towards manufacturing, financial services, business services, computer services, and electricity and other energy sectors. Singapore, Japan, the Netherlands, the US and Mauritius were major source countries, accounting for more than two-third of the FDI equity flows during the same period. Net FDI declined to US$ 5.7 billion on account of moderating gross FDI and a rise in repatriation. 
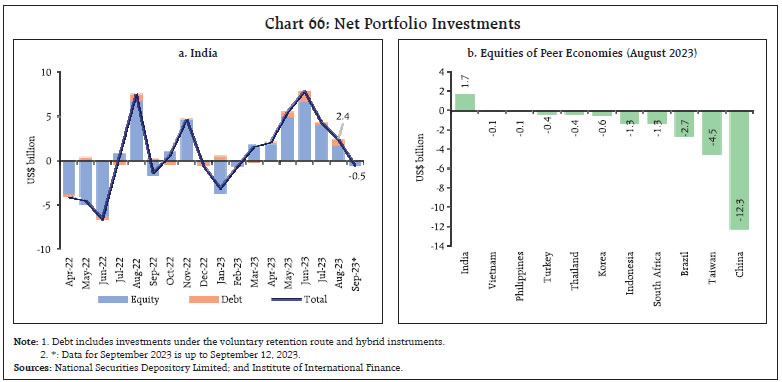 Foreign portfolio investors (FPIs) remained net buyers for the sixth consecutive month in August 2023, with net inflows reaching US$ 2.4 billion (Chart 66a). India attracted the highest equity flows among emerging market peers with several countries facing outflows on account of flight to safety (Chart 66b). Power, capital goods, information technology and consumer services attracted the largest portion of these investments during August 16-30, 2023. During 2023-24, foreign portfolio investment (FPI) flows witnessed a significant turnaround, primarily driven by equity flows. The net FPI inflows stand at US$ 21.7 billion during the current financial year (up to September 12, 2023) as against net outflows in the preceding two years- US$ 15.3 billion in 2021-22 and US$ 5.9 billion in 2022-23. Net accretions to non-resident deposits rose to US$ 3.0 billion during April-July 2023, led by significant accretions in Foreign Currency Non-Resident (FCNR(B)) accounts, as compared with US$ 1.4 billion during the same period a year ago. The amount of external commercial borrowing (ECB) agreement registrations moderated in July 2023 from the surge exhibited during the preceding four months (Chart 67).
During April-July 2023, both gross and net ECB inflows were higher than during the corresponding period of the previous year (Chart 68). Nearly two-third of new ECBs were raised for capital expenditure (Chart 69). The foreign exchange reserves at US$ 593.9 billion on September 8, 2023 stood cover for about 10 months of imports projected for 2023-24 or 95 per cent of total external debt outstanding at end-March 2023 (Chart 70a). During the calendar year 2023, Indian foreign exchange reserves increased by US$ 31.2 billion, which is the second highest among major foreign exchange reserves holding countries (Chart 70b). The Indian rupee (INR) depreciated by 0.8 per cent (m-o-m) vis-à-vis the US dollar in August 2023, reflecting the strong US dollar and high bond yields in the US. Among the major currencies, the INR remained the least volatile during the month (Chart 71).
The INR depreciated by 0.6 per cent (m-o-m) in terms of the 40-currency real effective exchange rate (REER) in August 2023 as negative relative price differentials more than offset the appreciation of the INR in nominal effective terms (Chart 72). Payment Systems Digital payments maintained a strong growth trajectory in volume and value terms across payment modes during August 2023 (Table 5). As a significant milestone for the retail segment, the Unified Payments Interface (UPI) recorded 10 billion transactions (volume), accounting for around 81 per cent of the total digital transactions (Box 2). Since its inception in 2016, the UPI has exhibited exponential growth (Chart 73). With a near doubling of the transactions under the person-to-merchant (P2M) category, the UPI facilitates the transaction needs of over 330 million estimated unique users and 70 million merchants.33 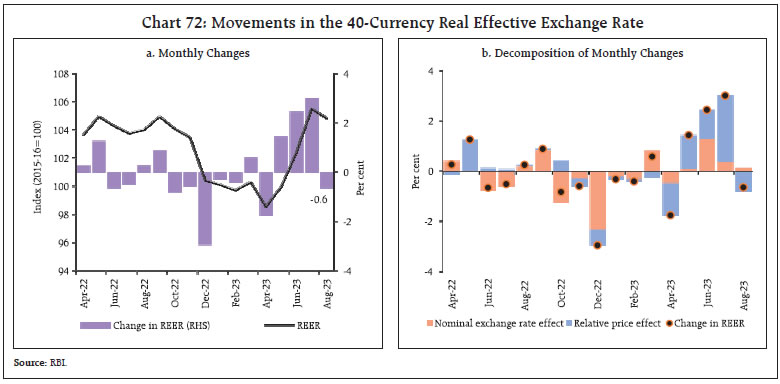
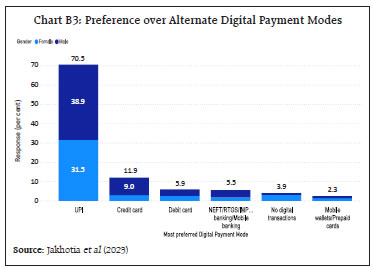
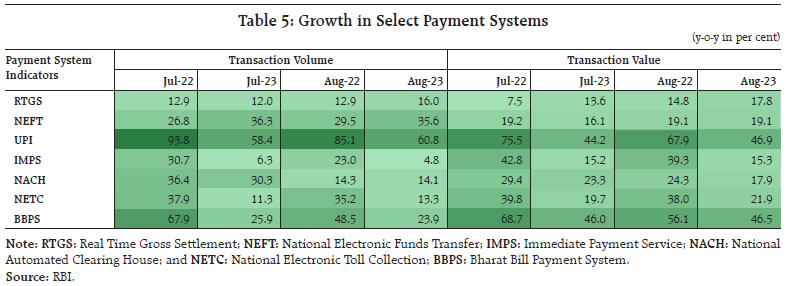 In the cards segment, credit card transactions continued to gather steam, with the average value of transactions growing by nearly 14 per cent34 (y-o-y) in August 2023 buoyed by growth in the tier 2 and tier 3 cities.35 The BBPS exhibited an increase in its usage, driven by loan repayment, payments for liquefied petroleum gas (LPG) and piped gas, and FASTag recharges. Moving forward, as tier 2 and tier 3 cities offer a large e-commerce market estimated at over US$ 240 billion by 203036, retail digital payments will accelerate further over time. 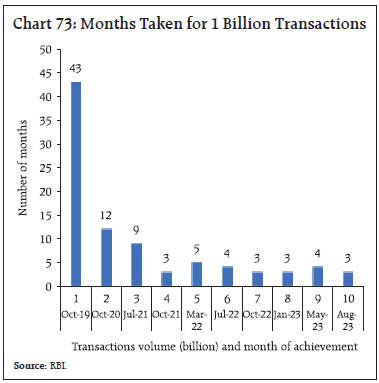 On September 6, 2023, Governor Shri Shaktikanta Das unveiled a suite of payment products developed by the National Payments Corporation of India (NPCI) at the Global FinTech Festival 202337, and stated that “Technological innovation has unprecedented potential to make finance more inclusive, competitive and robust.”38 The scope of UPI is now being expanded by inclusion of credit lines as a funding account for transactions using the UPI.39 To bolster digital payment literacy, the NPCI launched the third edition of UPI Adoption and Safety Awareness Campaign, “UPI Chalega”.40 Box 2: Unified Payments Interface (UPI) – Journey to 10 Billion Transactions In August 2023, the UPI reached the milestone of 10 billion transactions in a month, owing to rapid merchant onboarding, increasing digital awareness, and continuous policy support. With features like free instant fund transfers, single-click two-factor authentication, quick-response (QR) code support, interoperability among payment apps and e-mandates for recurring transactions, the UPI has created an ecosystem that integrates multiple operations such as bill payments, e-commerce, IPO transaction, etc., making payments seamless and secure. The journey of the UPI has been spectacular – evolving from a minimalistic feature-oriented platform to a more sophisticated product that caters to frictionless credit disbursals, aided by an enabling policy environment (Chart B1). A primary survey was conducted in June 2023 to understand adoption and user preferences across various payment modes. 511 responses were received from diverse age-education-professional-regional groups. While some of the respondents had begun using the UPI before 2019, the pace of adoption increased rapidly during 2019-2021 (Chart B2). The majority of respondents (70 per cent) preferred UPI to other digital modes of transactions, citing ease of use, swift transaction time, non-availability of cash, and zero transaction costs (Chart B3 and B4). For transactions below ₹50,000, the UPI remains the top choice, with over 50 per cent of respondents preferring it. Even for higher value transactions, the UPI maintains its edge with 29 per cent of respondents preferring it. 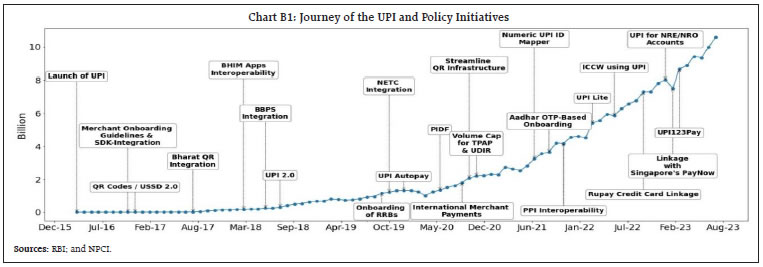

 Riding on the success of the UPI, India has emerged as a global payment powerhouse, contributing nearly 50 per cent of global real-time transactions (volume).41 Recent developments like the linkages with the fast payment systems of other nations, UPI Lite, UPI123Pay, and UPI Autopay are set to further bolster the adoption of the UPI. Reference: Jakhotia, Shreya, Subhadhra Sankaran, Shashi Kant, and G. V. Nadhanael (2023). “Exploring India’s Payments Landscape: Consumer Preferences and Macroeconomic Implications”, RBI Mimeo | Additionally, the Reserve Bank and the Bank for International Settlements Innovation Hub (BISIH) announced the winners of the fourth edition of the G20 TechSprint, this month, showcasing how technology solutions can address illicit financing risk, provide settlement solutions in other currencies, and achieve interoperability in multi-lateral CBDC platforms. Conclusion To conclude, small steps became a giant leap in a moonshot serenaded around the world when Chandrayaan-3 touched down on the south pole of the moon on August 23. This is an area of intense interest for space scientists because of the presence of water ice in craters, after NASA’s instruments carried aboard India’s first moon mission in 2008 confirmed the presence of ice in 2018. India became the first country in the world to land a space craft on the moon’s lower pole as also on the most frugal budget relative to other moon landing countries (USA, Russia and China). NASA’s Laser Retroreflector Array (LRA), the fourth payload on its lander Vikram, will use reflected laser light from orbiting spacecraft to determine its location even after it has gone to sleep after 14 days. This achievement scripts a new chapter in human space odyssey amidst renewed global interest in lunar exploration. It is expected that it would provide strong momentum to India’s space collaboration with other countries, especially in the developing world, that aspire to develop their own moon missions. The impetus from India’s successful landing on the moon spurred the Indian Space Research Organisation (ISRO) to launch its first mission on September 02 to study the sun. In a perfect launch, the Aditya-L142 satellite was successfully injected into an elliptical orbit around the Earth after 63 minutes of the lift-off of the ISRO’s workhorse Polar Satellite Launch Vehicle (PSLV). Aditya will commence its journey to its position observing the sun after several earth manoeuvres over 16 days to gain the necessary velocity – a long travel of 125 days. Aditya will stay approximately 1.5 million kilometres away from the earth, directed towards the sun. It has seven distinct indigenously developed payloads. Aditya L1 it will study the solar atmosphere, solar magnetic storms, and their impact on the environment around the earth. India’s space efforts are significant for the country’s socio-economic development. The space industry plays a key role across several application areas, including weather forecasting, geological and oceanographic studies, disaster management and agriculture, to name a few. It has also played a crucial role in the country’s defence and security. Currently, India accounts for about 2 per cent of the global space economy, but this share is set to grow exponentially with rising private participation. Chandrayaan-3 and Aditya L1 will boost India’s capability to undertake complex space missions that contribute to the advancement of space technology for the betterment of humanity.
|