by Rachit Solanki^, Somnath Sharma^, R. K. Sinha#, Samir Ranjan Behera^ and Atri Mukherjee^ As part of the pension reforms initiated in India during the first decade of this century, most of the State governments adopted the National Pension System (NPS) which is a defined contribution scheme. Against the backdrop of the recent decision by some of the States to revert to the Old Pension Scheme (OPS), this article estimates the associated fiscal costs. Results indicate that the cumulative fiscal burden in case of OPS could be as high as 4.5 times that of NPS, with the additional burden reaching 0.9 per cent of GDP annually by 2060. Thus, short-run reduction in States’ pension outgo which may be driving decisions to restore OPS, would be eclipsed by the huge rise in future unfunded pension liabilities in the long-run. States’ reverting to the OPS would be a major step backwards and can increase their fiscal stress to unsustainable levels in the medium to long-term. Introduction In India, ballooning unfunded pension liabilities under the defined benefit (DB) system had spurred much-needed pension reforms starting in 2004. The Central government introduced the National Pension System (NPS) in 2004, which is a defined contribution (DC) scheme. It replaced the Old Pension Scheme (OPS), a DB plan. Since then, most of the State governments in India have also implemented the NPS for their employees. Under the DB scheme, the pensions are paid out from the current revenue of the government rather than the accumulated funds (Barr and Diamond, 2009). As a result, several developed economies with DB schemes in the past have faced rising public expenditure due to the rising life expectancy of its citizens (Palacios and Whitehouse, 2006; Holzmann and Hinz, 2005; Auwera, 2006). With the average global life expectancy projected to reach 77.2 years in 2050 from 72.9 years in 2022 (United Nations, 2022), the share of the global population aged 65 years or above is projected to rise from 10 per cent in 2022 to 16 per cent in 2050. The changing demographic profile and rising fiscal costs have compelled several economies around the world to re-examine their pension schemes and undertake pension reforms with the objective of preserving sustainability of their social security and pension systems. As a committed expenditure,1 pension related outgo is highly inelastic to the economic cycles. A burgeoning pension outgo may compel the States to cut down their capital expenditure, affecting long-term growth prospects of the economy (Mukherjee et al., 2022). While pension reforms which took place across the States during the first decade of this century were much needed to assist fiscal consolidation and enhance fiscal flexibility (viz., reallocation of their budget towards growth enhancing expenditures), the recent decisions and announcements by some of the States to revert to the OPS (with a few others contemplating the same), pose significant fiscal risks for the States which could have distortionary effects on the labour market, savings and investments as well as capital market development and dampen the country’s medium-term macroeconomic outlook. The objective of this Study is to use the NPS contribution data of the State government employees to generate projections of pension outgo for the States under two different scenarios, viz., if they choose to continue with the NPS and the counterfactual scenario of them shifting from NPS to OPS. Based on the projections, this paper estimates the likely fiscal costs of States reverting to OPS. Section II describes the merits and demerits of different public pension plans. The cross-country practices relating to public pension plans are analysed in Section III. The pension system followed by the State governments in India is discussed in Section IV. The fiscal costs of reversal to the OPS are estimated in Section V. Section VI puts forth the concluding observations. II. Classification of Pension Plans The pension plans of the governments are generally classified into defined benefit, defined contribution and hybrid pension arrangements. In a DB plan, benefits are defined in advance based on the employee’s final or average salary and those benefits are guaranteed by the government as the sponsor. In contrast, DC plans do not have a guarantee component. The pension benefits depend upon the market performance of the pension fund and the government’s cost is limited to a prespecified rate of contribution. In addition to the DB and DC pensions, hybrid pension arrangements offer a minimum return or benefit guarantee and may also offer a variable (DC-like) benefit over and above the minimum return or benefit guarantee. In case of Combination schemes, the employee may accumulate two types of benefits simultaneously with a DB element for a portion of income and a DC element on any earnings over that amount. Self-annuitising DC schemes are those which operate identically to DC schemes until retirement, after which the accumulated fund is converted to pension income, not at the market rate for pension costs (i.e., annuity rates), but in accordance with a process set out in the rules of the scheme. The pension is then paid from the scheme. Underpin scheme, are those in which there is both a DB and DC basis for benefits. At retirement, the employee receives a benefit based on whichever calculation provides the better result. In Cash balance scheme, the employee is entitled to a lump sum at retirement, in a similar fashion to a traditional DC scheme, which is then converted into an annuity. The difference is that the amount in the employee’s account is not directly related to the returns achieved on the underlying investments. The returns may be guaranteed or smoothed (to offset any high or low peaks) or subject to some form of underwriting by the scheme. As a result, employee benefits may be slightly more predictable. Fixed benefit/benefit unit schemes are DB in nature but without any link to the earnings – an employee usually accumulates a fixed monetary amount of annual pension yearly. From a sponsor’s perspective, the DC plans have several advantages over the DB plans. First, in DC plans, the pension burden is shared by the sponsor and the employee, whereas under the DB plans, the entire pension burden is generally borne by the sponsor. Second, in DC plans, the investment risk – the risk emanating from the poor performance of the assets – is borne by the pension plan member in contrast to the DB plans, where the plan sponsor (i.e., the government) assumes this risk. Third, the longevity risk – the risk of outliving one’s assets – is also borne by DC plan members, while in DB plans, the sponsor has to shoulder it. Fourth, in case of DC plans, it is much simpler for the employer to calculate the financial burden, which is limited to the defined contributions to the plan. In contrast, under DB plans, the employers’ pension liabilities suffer from significant uncertainties in circumstances where capital market developments turn out worse than expected, or retired employees live longer than foreseen. An alternative to DB and DC is the ‘Collective Defined Contribution’ (CDC) or ‘Defined-Ambition’ plan. These plans seek to achieve defined benefit outcomes but with the flexibility of not having to provide an absolute guarantee. Under them, instead of allocating assets to individuals, assets and risks are managed on a pooled basis. The main advantage of CDC plan is that it smooths out mortality and longevity risks. For instance, those who die early in their retirement subsidise those who live longer. Moreover, due to defined benefit outcomes, those generations who are ‘lucky’ enough to retire when markets are rising may not get that benefit, however generations who are ‘unlucky’ enough to retire when markets are poor may not suffer that risk. The need for transition from DB-type schemes to DC-type schemes has been felt globally and accordingly, many employers across the economies have implemented this change at suitable/feasible time points. IMF (2019) indicated that the employers could be transiting increasingly from DB plans to DC plans, although its pace and extent may vary across the advanced economies. III. International Experience With the share of elderly population (i.e., those aged 65 and above) in the world expected to rise to 16 per cent in 2050 (from 8 per cent in 2015), the average public sector pension cost-to-GDP ratio could rise from 9.5 per cent in 2015 to 12 per cent by 2050 (Citi, 2016; United Nations, 2022). In the public sector, large unfunded pension promises, relying on a ‘pay-as-you-go’ (PAYG) model, may become unsustainable with rising age dependency ratios and as a result may lead to either drastic cuts in benefits or eventual complete collapse (Citi, 2016). The public sector pension burden, however, will vary across countries based on large divergences in life expectancy and age dependency ratio. Public Pension System in the OECD Economies In most Organisation for Economic Co-operation and Development (OECD) economies, the public sector workers are covered by the national social security arrangement. In addition, in many of these OECD economies, there are special pension arrangements for the public sector employees which are substitutes or complementary to the general social security system. These special pension plans for public sector workers are generally like pay-as-you-go (PAYG), and these special DB plans create a pension liability for governments much beyond that, which is already reported in the national social security arrangements. In the OECD economies, the Government workers’ pension plans can be classified as (i) funded; (ii) unfunded; (iii) partially funded; and (iv) book reserved arrangements. Funded arrangements are those where an independent legal entity is established to hold the pension plan assets on behalf of the plan members. Unfunded, or pay-as-you-go arrangements are financed directly out of the government coffers, though there may be reserves built up which are the legal assets of the employer (i.e., the government). Some plans are partially funded, wherein the sponsor targets a funding level of less than 100 per cent of the total pension burden. The remainder could be unfunded (pay-as-you-go), or it could be book reserved. Under the book reserved arrangement, the sponsoring government recognises a liability (debt) on its balance sheet, which reflects the accrued pensions of its members. However, there are no legally separated pension assets. The total value of unfunded or underfunded government pension liabilities for 20 OECD economies – a group of predominantly wealthy countries – is US$78 trillion (Citi, 2016). While unfunded schemes are most common at the federal level, at the local government level, funded schemes are more popular than unfunded PAYG (Table 1). Some federal and local government schemes are book-reserved, whereas a small number of schemes target partial funding (OECD, 2011). With the objective of limiting pension liabilities, public sector workers have been transferred to the main public pension system in some countries (e.g., Austria, Chile, Czech Republic, Greece, Hungary, Mexico, Poland, Spain, and the United States (US)), which in some cases includes a fully funded defined contribution component (e.g., Chile, Denmark, Hungary, Mexico, and Poland). In addition, initiatives have also been taken to introduce some degree of pre-funding of public sector pensions via the establishment of reserve funds (e.g., Australia, Belgium, Finland, Germany, Ireland, and Sweden). | Table 1: Pension Plans for Public Sector Workers in select OECD Countries | | Country | Public Sector Workers Covered by the General Social Security System | Pension Plan for Central/Federal Government Workers | Pension Plan for State/Provincial/Local Government Workers | | Australia | No | The Public-Sector Superannuation Accumulation Plan (PSSap), designed exclusively for current and former Australian Public Service employees, is a DC Plan. | Each State has its own plan for its employees, most of which are funded and based on either DB or hybrid pension formulas. | | Canada | Yes | Funded, DB pension plan. | Provincial governments offer specific, DB plans to their personnel. These plans are usually funded, though some are run under the book reserved system. | | Chile | Yes | No specific arrangement for public sector workers, except military personnel who are covered under an unfunded, DB pension system. | No specific arrangement for public sector workers. | | Finland | No | Unfunded DB pension plan for central government workers. However, a buffer fund has been established and the target funding level is 25 per cent of the pension liabilities. | Unfunded DB plan for local government workers. A fund has been established to cover the plan’s annual costs on a short-term basis. | | Hungary | Yes | No specific arrangement for public sector workers. | No specific arrangement for public sector workers. | | Netherlands | Yes | Funded DB pension plan. | Funded DB pension plan. | | Norway | Yes | Partially funded, partially book-reserved DB pension plan. | Funded DB pension plans. | | Poland | Yes | No specific arrangement for public sector workers. | No specific arrangement for public sector workers. | | Spain | Yes | Central government workers have both an unfunded DB and a funded DC plan. | Some regional governments sponsor funded DB plans. | | Sweden | Yes | Pension arrangements for federal employees are funded and include both DB and DC elements. | For local government workers, arrangements are partially funded or book-reserved and partially pay-as-you-go. | | Switzerland | Yes | Funded DB pension plan. | Funded DB pension plan. | | United Kingdom | Yes | Book-reserved DB plan for civil servants of the central government and separate book-reserved DB plans for employees of the National Health Service, teachers, fire department, armed forces and police. | Funded DB plans for employees of local authorities. | | United States | Yes | New U.S. federal civilian employees, hired after 1983, are automatically covered by Federal Employees Retirement System (FERS), a three-tiered system that consists of: (i) social security, (ii) a specific, unfunded DB plan, and (iii) the Thrift Savings Plan, which is a funded, DC plan. | States and local governments offer mainly DB plans, which are often funded. | | Source: OECD (2011). “Funding in Public Sector Pension Plans: International Evidence”. OECD Working Papers on Finance, Insurance and Private Pensions, No. 8, OECD Publishing. | Sub-National Public Pension Plans in the United States In the US, most State and local government employees (83 per cent of those working full time) participated in a DB pension plan in 2018. These public pension plans typically provide pension based on the members’ years of service and average salary over a specified number of years of employment. Many members also receive cost-of-living adjustments that help to maintain the purchasing power of their benefits in retirement. Public pension plans of State and local governments currently receive most of their annual income from investment rather than contribution. In 2017, 69 per cent of total pension plan revenue came from net investment earnings, 22 per cent from employer contribution, and 8 per cent from employee contribution. As investment returns are volatile, these shares vary widely over time (Urban Institute, 2018). In the US, State and local government pensions have attracted considerable attention in recent years as inadequate contributions have left pension plans underfunded. The US States owed a total of $1.25 trillion in unfunded pension benefits during 2019, which is equivalent to 6.8 per cent of all states’ personal income, up from 3.0 per cent in 2007 (Biernacka-Lievestro and Fleming, 2022). The magnitude of pension challenges has varied widely across the US, with New Jersey’s unfunded pension liability being the largest at 20.2 per cent in 2019. With the objective of reducing their pension liabilities, the US States have enacted major changes to their public pension systems in recent years in the form of: (i) reduced benefit levels; (ii) more extended vesting periods; (iii) increased age and service requirements; (iv) limited cost-of-living adjustments; and (v) increased employer and employee contributions. Some governments have also moved new employees into DC plans or hybrid plans combining aspects of both DB and DC plans, partly because DC plans shift risk from employers to employees. Public Pension System in Asian Countries Coverage of formal pension systems in Asia is much lower vis-à-vis OECD countries. Further, the national pension provision in Asia is very diverse. While Philippines, Thailand, Vietnam and Pakistan have DB schemes, countries like China, Indonesia, Malaysia, Singapore, India and Sri Lanka have operationalised DC schemes (OECD, 2008). In China, the Public Employees Scheme (PES) was launched in 2015 as part of the public service reform and it provides coverage to an estimated 40 million employees working in the government and public institutions (State Council, 2015). This is a DC scheme, with the contribution rate of 20 per cent from the employer (i.e., the government) and 8 per cent from the employee. Before the PES was launched, public pensions were funded on a pay-as-you-go basis from the current operating budgets of government agencies and public institutions. Without a formal scheme, public employees did not pay contributions and enjoyed generous retirement benefits that were 80-100 per cent of final salary, with adjustments pegged to current civil service pay (Wong and Yuan, 2020). In Thailand, until 1997, all the public sector employees were covered by the old civil service scheme, a non-contributory defined benefit plan. With the introduction of the Government Pension Fund in 1997, the public sector pension landscape became more heterogeneous. Currently, different schemes apply for central government officials, central government regular employees, local government officials and employees of state-owned enterprises. However, most of the current public pension schemes have a defined contribution element supplementing the former defined benefit plans. For instance, the central government officials in Thailand are presently covered by the Government Pension Fund (GPF), a DC scheme, under which the contributing members pay 3 per cent of their salary and the employer matches this amount. Moreover, in order to compensate for the benefit losses arising from the switch to the new DC scheme from the old DB scheme, the employer contributes an additional 2 per cent of the salary of the employees. In Taiwan, public sector employees are covered by two pension schemes that complement each other. The Government Employees’ and School Staffs’ Insurance provides disability, death and retirement benefits. It is a defined benefit scheme with a current contribution rate of 7.15 per cent – employees pay 35 per cent of that contribution, while the government and employers share the remaining 65 per cent. The Public Service Pension Fund (PSPF), which dates back to 1943, is a mandatory defined benefit scheme for civil servants, teachers and military personnel. The contribution rate for this scheme is 12 per cent – employees pay 35 per cent of the share, while the government and employers cover the remaining 65 per cent. Overall, the international experience reveals a distinct shift towards DC plans from DB plans across countries with the objective of reducing the pension burden of the governments. Apart from this, countries have also taken recourse to measures like cutting benefits, increasing contribution rates, as well as raising the retirement age in order to restore long-term solvency of public pension systems (Bosworth & Burtless, 1997; Citi, 2016). IV. Pension System in Indian States State Governments’ Expenditure on Pension Payments The Indian States’ expenditure on pensions has increased from 0.6 per cent of GDP in the early 1990s to 1.7 per cent of GDP in 2022-23 (BE), outstripping the growth of revenue receipts (Chart 1a)2. As a result, the ratio of pension payments to revenue receipts has increased (Chart 1b). The pension burden of the States has remained higher than that of the Centre both in absolute terms as well as a per cent to their revenue receipts (Chart 1c). At the disaggregated level, there exist significant variations in the pension burden across the States (Chart 2). Apart from the north-eastern and hilly States, the pension outgo exceeds 25 per cent of own revenue receipts in States like Bihar, Kerala, Punjab, Uttar Pradesh and West Bengal. Transition from OPS to NPS Pensions provided by State governments in India at present can be categorized under the OPS and the NPS. The OPS is a DB scheme under which, after retirement, State government employees get a pension fixed at 50 per cent of the last drawn salary3. They also get the benefit of the dearness relief revisions. The pay-out is fixed and there is no deduction from the salary. Thus, the OPS is an unfunded, ‘pay-as-you-go’ system in which current taxpayers continuously finance retirees’ pensions (Aiyar, 2022). While OPS may be more attractive from the employee’s perspective, it puts an enormous financial burden on the government. Moreover, as future salary is not known in advance, the OPS may result in significant uncertainty regarding the quantum of State governments’ pension liabilities for future years. 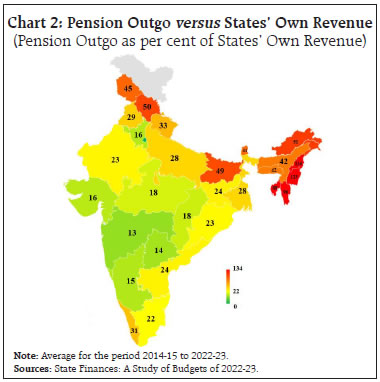 The financial challenges imposed by the OPS had prompted most of the States to switch to the NPS (Table 2). Only West Bengal and Tamil Nadu continued with the OPS. The NPS is a DC scheme under which the employees’ defined contribution is 10 per cent of basic salary and dearness allowances, with a matching contribution from the State government4. By investing a part of this contribution in equity and debt markets, the NPS aims to ensure a good pension for retiring employees, while reducing the budgetary burden (Aiyar, 2022). At the time of retirement, the employee gets a lumpsum amount from the accumulated fund and the rest is converted to an annuity by a third-party annuity provider. The NPS does not pose a pension obligation risk to the employer at the time of retirement, as the payments are made from the pension fund created through contributions from the employee and the employer during the service period. | Table 2: Transitions of State Governments from OPS to NPS | | Year of Adoption | State (Date of NPS Adoption) | | 2003 | Himachal Pradesh (May 15, 2003) | | 2004 | Punjab (January 1, 2004) | | Rajasthan (January 1, 2004) | | Andhra Pradesh (September 1, 2004) | | Chhattisgarh (November 1, 2004) | | Jharkhand (December 1, 2004) | | 2005 | Madhya Pradesh (January 1, 2005) | | Manipur (January 1, 2005) | | Odisha (January 1, 2005) | | Assam (February 1, 2005) | | Gujarat (April 1, 2005) | | Uttar Pradesh (April 1, 2005) | | Goa (August 5, 2005) | | Bihar (September 1, 2005) | | Uttarakhand (October 1, 2005) | | Maharashtra (November 1, 2005) | | 2006 | Haryana (January 1, 2006) | | Karnataka (April 1, 2006) | | Sikkim (April 1, 2006) | | 2008 | Arunachal Pradesh (January 1, 2008) | | 2010 | Jammu and Kashmir (January 1, 2010) | | Nagaland (January 1, 2010) | | Meghalaya (April 1, 2010) | | Mizoram (September 1, 2010) | | 2013 | Kerala (April 1, 2013) | | Source: National Pension System Trust. |
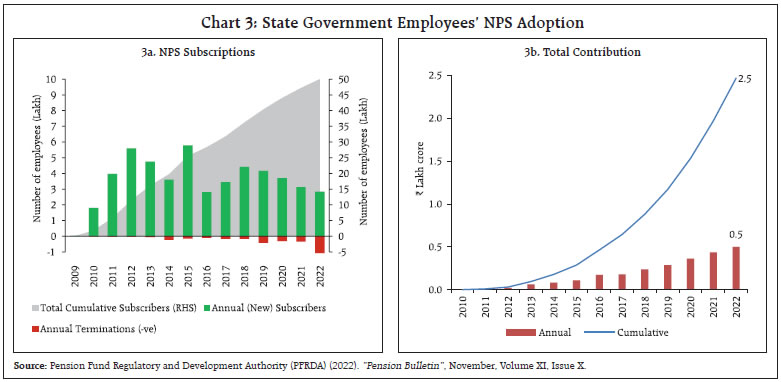 As at end-November 2022, the cumulative number of State government employees subscribing to NPS rose to around 50 lakhs with their cumulative contribution in NPS corpus amounting to `2.5 lakh crore (Chart 3a and 3b). The six large States viz., Uttar Pradesh, Rajasthan, Madhya Pradesh, Maharashtra, Chhattisgarh, and Karnataka account for around half of all the subscribers to NPS (Chart 4). Uttar Pradesh and Rajasthan are the only two States, which have more than five lakh subscribers (as on November 30, 2022). The age-wise distribution of States’ NPS subscribers follows a typical bell curve, with the bulk of the employees centred around the 30-40-year age bracket (Chart 5). As most of the current subscribers joined during the early 2010s, the subscriber base is relatively young and has an average residual service of around 20 years. The new entrants in the States’ workforce have the highest proportion in the 26-30-year age bracket. On the other hand, NPS terminations are mostly centred around the 56-60-year age group, reflective of the relatively low attrition rate and voluntary retirements. The yearly entrants were around 6 per cent of the total NPS subscribers, while the annual retirees were less than one per cent in 2021. Reversal to OPS from NPS Since subscription to NPS has started in 2009, the current pension outgo of the State governments includes both – pension payment to the retirees who joined under OPS and the pension contribution to the employees covered under the NPS. This has contributed to an increase in the annual pension outgo, whereas the benefits of the NPS would start accruing only when the employees who joined under the NPS begin to retire. 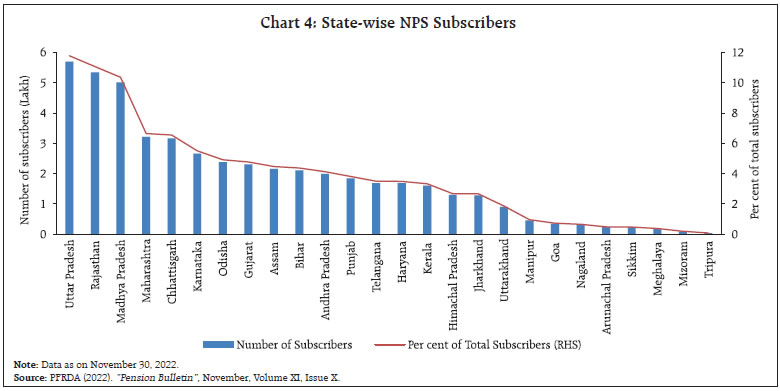 Recently, a few States like Rajasthan, Chhattisgarh, Jharkhand, Punjab and Himachal Pradesh have announced reversal to the OPS from NPS. The immediate gain is that they will not have to spend on NPS contribution of the current employees. In future, however, the unfunded OPS is likely to exert severe pressures on their finances, especially with increasing longevity. For instance, if the current NPS subscribers stay in government service till 60 years of age, in the next 15-year period, i.e., during 2023-37, around 20 per cent of the current NPS subscribers will retire. However, in the succeeding 15-year period i.e., 2038-52, 60 per cent of the current NPS subscribers (numbering around 30 lakh) will retire. Consequently, any switchback to a defined benefit pension system by the State governments will impose a huge fiscal burden on their finances during this period. V. Estimating Fiscal Cost of Reversal to OPS: Methodology and Results In order to estimate the fiscal cost of reversal from NPS to OPS, this study utilizes year-wise and State-wise incremental NPS contributions of the State government employees up till 2022.5 Based on the number of employees in different age groups, age-wise new employees joining the government service and the imputed salary outgo of the government till 2022, this study projects the future number of new employees joining, total employees and the associated salary outgo for the government. Based on these projections, the study then projects the States’ pension outgo under two different scenarios i.e., 1) States continuing with the existing NPS system; and 2) States reverting to OPS beginning 2023 (Box I). The following baseline assumptions are used in estimation: Assumptions6: (i) Annual salary growth (increments plus merit) of 12 per cent (g) and annual pension growth of 6 per cent (p)7.
(ii) Annual discount rate of 8 per cent is used for accumulating past cashflows and discounting future cashflows. (iii) State government’s contribution to NPS is 10 per cent of the salary (basic plus dearness allowance). (iv) Minimum age of joining is taken as 18 years and retirement age is taken as 60 years. Life expectancy is uniformly taken to be 80 years for all employees8. (v) The NPS data shows that premature retirements are miniscule, accounting for less than one per cent of total subscribers. Hence, attrition on account of premature terminations, deaths etc., is assumed to be zero. (vi) Till 2040, the existing trend of yearly recruitment (i.e., 2012 to 2022) will continue, post which the annual intake will be equal to the number of retirees in the previous year9. States’ Projected Yearly Pension Outgo Currently there are two groups of employees in the State government service i) OPS subscribers, who joined prior to the adoption of NPS by their State, and ii) NPS subscribers, who joined after the adoption of NPS. For the first group i.e., the OPS subscribers, current pension outgo is around 1.7 per cent of GDP and is expected grow further. The last batch of these employees are projected to retire by the early 2040s and will continue to draw pension under OPS for the remainder of their lives i.e., till 2060s. As for the second group, i.e., the current NPS subscribers, State governments’ yearly contribution to their retirement corpus fund is expected to increase from 0.1 per cent of GDP presently to around 0.2 per cent of GDP by 2039 and will slowly start declining after that. In the counterfactual scenario of these NPS subscribers being allowed to revert to OPS beginning 2023, the State governments’ save upon the employer’s contribution they were earlier making towards these employees’ retirement corpus fund. Consequently, States’ immediate outgo towards these employees will drop to zero. However, as these employees gradually retire, the States’ outgo will begin to increase again as these employees will now draw pension in line with the older OPS beneficiaries. By the mid-2030s the outgo would compare sizably to what it would have been under the NPS and eventually exceed it by 2040. Thereafter, the burden will increase rapidly, reaching around 0.9 per cent of GDP by the early 2060s (Chart 6a and b). This additional burden will be on top of the pension burden of older OPS retirees (the first group mentioned earlier) who will also continue to receive pension until the 2060s. 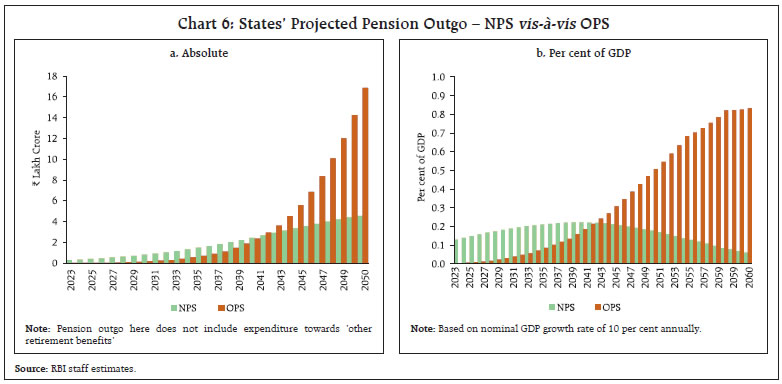 For the States, while reverting to OPS may look lucrative in the short-run, the future burden of OPS outgo will eclipse the short-run gains. By reverting to OPS, the States’ will only save 0.1 per cent of GDP on an average in yearly pension outgo till 2040 but would be required to incur an average additional increase in pension expenditure by 0.5 per cent of yearly GDP post 2040 (Chart 7). The projected outgo of 0.9 per cent of GDP by 2060 is only a scenario with an assumed nominal GDP growth of 10 per cent. The burden will rise even further in case of moderation in future growth. For instance, a 1 percentage point fall in average growth rate raises the outgo from 0.9 per cent to 1.3 per cent of GDP by early 2060s (Chart 8). A two percentage point fall will raise it further to 1.9 per cent of GDP. Quantifying States’ Cumulative Fiscal Burden: OPS vis-à-vis NPS Projected yearly pension outgo in case of NPS vis-à-vis OPS show significantly higher outgo in case of the latter although the pay-outs are timed differently. In order to arrive at a cumulative fiscal burden, the ratio of discounted present values of pension outgo is estimated in case of NPS and OPS. The cohort of employees on payroll as at end-March 2022 are taken and it is assumed that no new employee join post that date (Chart 9).10
The ratio of present value of total OPS burden to the present value of total NPS burden reveals that the overall pension burden of the States over the period end-March 2023 to end-March 2084 will increase on an average by around 4.5 times if they choose to shift from NPS to OPS (Chart 10). These findings are in line with the findings of Vaidyanathan (2022) that the pension burden of the States may be 4 to 5 times higher in OPS than in NPS. Under different alternative scenarios, it was found that the OPS burden remains above 3 times the NPS burden even after varying the salary growth rate and discount rate assumptions by ± 2 per cent (Chart 11). VI. Conclusion This Study examines the relative fiscal burden of the States in a counterfactual scenario of all of them shifting from the NPS to the OPS by using their age-wise incremental contributions to NPS. It validates the findings of the earlier as well as recent studies that the expected cumulative pension burden for the States over the period from 2023 to 2084 due to the OPS, is substantially higher than that of the NPS. The Study finds that if there is a shift to the OPS scheme in 2023, the additional pension burden will start mounting in the subsequent years and outpace the NPS contribution for most of the States by the 2030s. Eventually, the fiscal cost of reverting to OPS will be enormous as the actual pension burden will increase by around 4.5 times than that of the NPS. The actual future pension outgo could also be difficult to assess due to changes in the underlying interest rate, longevity and salary/ pension growth which could raise risk premium and cost of capital in the economy. To sum up, any reversion to OPS by the States would be fiscally unsustainable, though it may result in an immediate fall in their pension outgo. At a time when most of the countries are moving from DB to DC plans, reverting to OPS from NPS by the Indian States will be a major step backwards undermining the benefits of past fiscal reforms and compromising the interest of future generations. References Aiyar, S. (2022). “Fund-mentally disastrous: Why a return to Old Pension Scheme is a giant freebie”. The Economic Times, November 30, 2022. Auwera, V. (2006). “Pension reforms and ADB Interventions”. Asian Development Bank. Technical Note. Barr, N. and Diamond, P. (2009). “Reforming Pensions: Principles, Analytical Errors and Policy Directions”. International Social Security Review, 62(2), 5-29. Biernacka-Lievestro, J. and Fleming, J. (2022). “States’ Unfunded Pension Liabilities Persist as Major Long-Term Challenge”. July 7, 2022. URL: https://www.pewtrusts.org/en/research-and-analysis/articles/2022/07/07/states-unfunded-pension-liabilities-persist-as-major-long-term-challenge. Bosworth, B. and Burtless, G. (1997). “Social Security Reform in a Global Context”. Conference Series – Federal Reserve Bank of Boston, Vol. 41, pp. 243-274, Federal Reserve Bank of Boston. Citi (2016). “The Coming Pensions Crisis - Recommendations for Keeping the Global Pensions System Afloat”. Citi GPS: Global Perspectives & Solutions, March. Holzmann, R. and Hinz, R. (2005) “Old Age Income Support in the 21st century: An International Perspective on Pension Systems and Reform”. IMF (2019). “Paving the Way to Sustained Growth and Prosperity in Central America, Panama, and the Dominican Republic”. International Monetary Fund. Mukherjee A., Behera S. R., Sharma S., Seth B., Agarwal R., Solanki R. and Khandelwal A. (2022). “State Finances: A Risk Analysis”. RBI Bulletin, June. Palacios, R. and Whitehouse. E. (2006). “Civil Service Pension Schemes Around the World”. SP Discussion Paper No. 0602. The World Bank, Washington D.C. OECD (2008). “Pensions at a Glance: Asia/Pacific Edition”. Organization for Economic Cooperation and Development, Paris. OECD (2011). “Funding in Public Sector Pension Plans: International Evidence”. OECD Working Papers on Finance, Insurance and Private Pensions, No. 8, OECD Publishing. Sinha, R. K. (2022). “Sensitivity of Pension Liability of Banks to Various Actuarial Assumptions”. Reserve Bank of India Occasional Papers, Vol. 43, No. 1. State Council (2015). “Decision of the State Council on the Reform of the Old-Age Insurance System for Civil Servants and Public Institutions Employees”. Urban Institute (2018). “State and Local Government Pensions - State and Local Backgrounders”. Available at: https://www.urban.org/policy-centers/cross-center-initiatives/state-and-local-finance-initiative/projects/state-and-local-backgrounders/state-and-local-government-pensions. United Nations (2022). “World Population Prospects 2022”. United Nations Department of Economic and Social Affairs, Population Division. Vaidyanathan, T. S. (2022). “Pension System: The old versus the New”. The Hindu Business Line, May 30. Available at: https://www.thehindubusinessline.com/opinion/pension-system-the-old-versus-the-new/article65476009.ece. Vaidyanathan, T. S. (2022). “OPS, NPS and the Alternative”. The Hindu Business Line, June 01. Available at: https://www.thehindubusinessline.com/opinion/ops-nps-and-the-ap-alternative/article65481198.ece. Wong, C. and Yuan, R. (2020). “Managing across levels of government: The challenge of pension reform in China”. In “Ageing and Fiscal Challenges across Levels of Government”, OECD Fiscal Federalism Studies, OECD Publishing, Paris.
|