by Radheshyam Verma^ and Rakesh Kumar^ In the backdrop of rising yields in government securities (G-sec) in the recent past, this paper attempts to empirically estimate its impact on bank profitability. We found that short-term yields and the slope of the yield curve had a negative impact on trading income for the period Q1:2015-16 to Q1:2022-23. The impact of movements in yields on net interest margins (NIMs) and operating profit, however, was found to be positive. The impact was found to vary across the size of banks. Overall, the banking sector appears to be well prepared in the current phase of hardening of yields as the timely creation of investment fluctuation reserve (IFR) provides adequate buffers to withstand trading losses. I. Introduction In the current rising interest rate environment, when banks are key conduits of financial intermediation, it is very pertinent to examine its impact on bank profitability. Interest rate plays a major role in shaping bank profitability. The hardening of G-sec yield is one such market risk that banks confront in an environment of rising inflation and monetary policy normalisation process. There may be some disproportionate impact of the reversal of the monetary policy stance on bank profitability. Bigger banks1, by harnessing their economies of scale, are in a better position to withstand changing policy environment. On the other hand, smaller banks are more vulnerable as compared to bigger banks and their lending behaviour respond more significantly to changes in monetary policy (Naqvi and Pungaliya, 2023). Also, the impact of monetary policy is larger on smaller banks who are generally liquidity constraint (Kashyap and Stein, 2000). With the significant impact of monetary policy on financial market, the response of bank profits to interest rates is of key importance from the financial stability perspective. However, very limited studies are available on this subject in India which focuses on bank profitability in general while no literature is available which looked at the impact of interest rate on profitability of banks. Against this backdrop, the study attempts to assess the implication of rising yields with the reversal of interest rate cycle on bank profits. Furthermore, the study also empirically tests the impact of rising yields on different components of profits of scheduled commercial banks (SCBs). Finally, impact of treasury yield was separately looked at for the top quartile banks to assess the robustness of the results. The remainder of the paper has been organised in the following fashion. Section II provides key stylized facts about the investment strategy of banks and takes deep dive into earning pattern of SCBs. Section III gives a brief literature review on this subject broadly covering international studies as there is very limited literature available for India. Section IV focuses on data and empirical analysis using bank level panel fixed effects model. Section V sets out the conclusion and way forward. II. Stylised Facts a. Investment Strategy of Banks Investment portfolio in favour of government securities benefits SCBs by providing stability and returns. The government securities are risk free instrument as sovereign may not default as easily as it can happen with private corporates. The G-secs attract zero risk weight and are not constrained by any concentration limit under Basel guidelines. The held for trading (HFT) portfolio of banks are mandated for marked-to-market valuation on a monthly or lesser frequency while available for sale (AFS) portfolio are marked-to-market (MTM) on a quarterly or lesser frequency. Thus, despite holding the safest securities in the investment portfolio, balance sheets are exposed to market risks. As per the regulatory guidelines, the realised gains/losses from the HFT and AFS portfolio are transferred to profit and loss account of banks, thereby reflecting immediately in the profitability of banks in the same quarter. The interlinkages of government securities and banks’ investment portfolio has always been strong due to the Statutory Liquidity Ratio (SLR) prescriptions for banks under Section 24 of Banking Regulation (BR) Act. Accordingly, SCBs remained the largest holders of government securities [including T-Bills and State Development Loans (SDLs)] accounting for 37.5 per cent share as of end-March 2023, followed by insurance companies (25.2 per cent), provident funds (9.8 per cent) and the Reserve Bank (9.2 per cent).2 The investment of SCBs in G-Secs (including T-Bills and SDLs) as a percentage of their total investment was 81.4 per cent as at end-March 2023. The corresponding figure for public sector banks (PSBs) was at 79.5 per cent against 82.9 per cent for private sector banks (PVBs). Historically, PSBs have maintained higher investments in G-Secs as compared to PVBs. However, a reversal in trend is visible since September 2019 due to a decline in credit demand resulting in the deployment of funds towards SDLs by PVBs in pursuit of higher and stable returns (Chart 1). 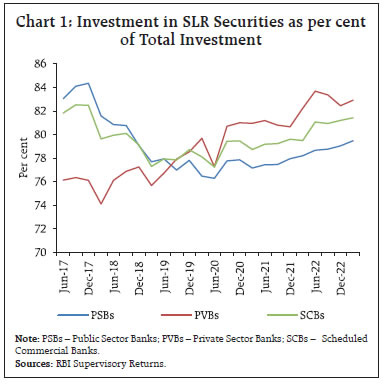 b. Rising Interest Rates and Net Interest Margins (NIMs) of Banks Typically, monetary policy shocks account for a significant fraction of the volatility of the yield curve, especially at shorter maturities, which are in turn transmitted at the longer end. For an emerging market economy like India, synchronised increase in policy rates by the United States (US) and other advanced economies has a spillover impact on domestic financial markets. With large exposure of banks’ balance sheets to Government securities, there exists a direct impact of rising yields on the trading book of banks. Apart from the direct impact on the trading book of banks, the empirical literature suggests that higher yields with steeper yield curve are associated with higher NIMs (Alessandri and Nelson, 2015; Borio et al, 2017; Claessens et al, 2018). Banks are generally reluctant to raise deposit rates as interest rates rise unless they witness shortage of structural liquidity. At the same time, with repricing of loans in the external benchmarking framework3, higher rates are passed to existing and new loans based on contractual repricing such as floating rate loans. However, there is also a practice of elongation of repayment period as per the contractual agreement between the lender and the borrower. Thus, an increase in interest rates contributes to rising NIMs, as interest income increases faster than interest expense (Chart 2). 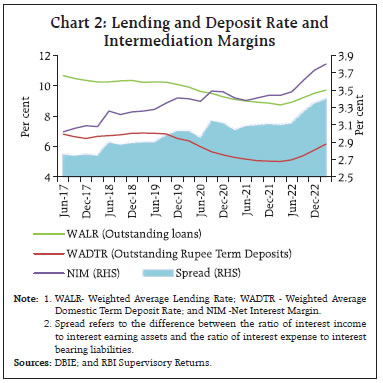 Nonetheless, the effect of changes in market interest rates may significantly vary from bank to bank, depending on their degree of maturity transformation and the use of risk management techniques to hedge interest rate risk in their trading book through derivatives. Further, as banks transform short-term liabilities into longer-term assets, their NIMs are also impacted by slope4 of the yield curve positively. Since, banks usually lend for longer terms than they borrow so part of this profit comes from the difference between long-term and short-term interest rates (i.e. the slope of the yield curve). If the yield curve is normal, a steeper slope will mean a larger margin and higher profits for the banks. Several international studies showed that the level and slope of the yield curve have been found to affect NIM and trading income in the opposite direction, which is consistent with banks hedging interest rate risk through derivatives (Alessandri and Nelson, 2015; Borio et al, 2017). In the Indian context, the yield on both long-term government securities and short-term rates have been rising in recent quarters. The various episodes of rising and falling yields have directly impacted the trading income of the Indian banks (Chart 3). 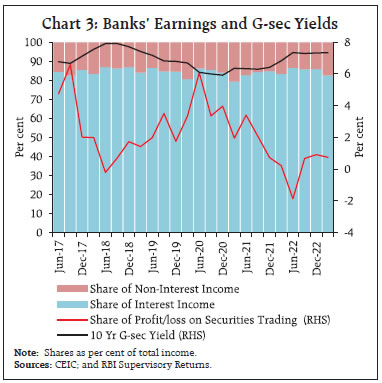 The average share of non-interest income in total income of SCBs during 2015-23 has been 14.9 per cent. Within non-interest income, the average share of profits emanating from securities trading during this period has been 17.0 per cent. Other major sources of non-interest income being fee income, income from para-banking activities, income from forex operations, among others (Chart 4). Hence, despite large swings in trading income on account of changes in interest rate cycle, impact on overall profit of banks has been much less. As at end-March 2023, the market value of investments (i.e. AFS + HFT portfolio) of SCBs stood at ₹20.4 lakh crore. 92.5 per cent of these investments were classified as available for sale (AFS) (Chart 5). More than 45 per cent of the total trading book portfolio of SCBs belonged to PSBs, followed by foreign banks (27.5 per cent) and private sector banks (26.7 per cent) (RBI, 2023).
III. Literature Review The narrative on changes in the interest rate and bank profitability can be traced back to the post-war period when Samuelson (1945) argued that an increase in market interest rates will, ceteris paribus, boost bank profits as banks often attempt to finance a part of their interest-earning assets with non-interest-bearing liabilities. This effect is stronger for banks that rely more on such funding, so a parallel upward shift of the yield curve should boost their net interest income by a greater amount. One strand of literature developed on measuring the inexorable impact of monetary policy on the yields and profitability of banks. Interest rates can also affect bank behaviour through risk-taking channels. Loose monetary policy can stimulate widespread risk-on sentiments wherein banks also indulge in higher risks taking in search of higher yields, which may be reinforced by its effects on asset prices, leverage, and credit standards (Borio and Zhu, 2012; Adrian and Shin 2009; Maddaloni and Peydr, 2011). On the other hand, the tightening of monetary policy by central banks raises the short-term rates and flattens the yield curve, thus depressing banks’ income. This effect is, however, fairly short-lived, and somewhat attenuated by hedging. In the short run, banks might lose/gain in the scenario of rising interest rates. However, higher rates have positive effect on bank profits in the long run (Alessandri and Nelson, 2015; Busch and Memmel, 2015). Higher credit risk is linked to periods of declining economic activity, prompting banks to increase their NIMs to cover their cost of capital due to the increased risk exposure in such conditions (Aliaga-Diaz and Olivero, 2011; Egly et al, 2017). Return on assets (RoAs) of banks is closely tied to longer-term rates and is slower to adjust to changes in market rates, resulting in banks’ NIMs getting higher when the yield curve is steeper for a sustained period because in the event of repricing of assets and liabilities, a steeper yield curve provides higher rates on assets than on liabilities. In addition, for a given yield curve slope, an increase in both short-term and long-term interest rates is expected to temporarily reduce net interest income, reflecting the more rapid adjustment of yields on liabilities than yields on assets (English, 2002). On the other hand, level and slope of the yield curve have been found to affect trading income and NIM in the opposite direction, which is consistent with banks hedging interest rate risk through derivatives (Alessandri and Nelson, 2015; Borio et al, 2015). Bikker and Vervliet (2017) found that the low interest rate environment impaired bank performance and compressed NIMs. Nonetheless, banks were able to maintain their overall level of profits, due to lower provisioning. However, they found that to compensate for their lower interest income banks did not expand high risk trading activities. A steeper yield curve should have a positive effect on banks’ net interest income. This is because if all banks’ liabilities were at market rates, the only lasting component of the gains would be the term premium: over time, surprises aside, market rates would catch up with those implicit in the yield curve and hence in forward rates (Borio et al, 2017). Further, as pointed out by Alessandri and Nelson (2015), a hedging interpretation may be attached to the negative coefficient on slope. The maturity profile of instruments held for hedging will often match that of the underlying exposure intended to be hedged. Against a positive sign on the slope coefficient in the net interest income equation, they found a negative sign on the slope coefficient in the trading equation to the extent that the bank intends to hedge across the maturity spectrum. Higher interest rates also lead to increase in loan loss provisions due to its impact on debt servicing costs and higher default probabilities (Borio et al., 2017). Bikker & Vervliet (2017) also confirm that loan loss provisions are lowered in response to reduction in interest rates due to lower expected loan losses. Literature has also found higher interest rates leading to decrease in non-interest income on account of their negative impact on securities’ valuations (Borio et al., 2017). This issue remains significant for policy makers, however, the literature on this subject is very limited for India. There are a few studies on India discussing drivers of bank profitability (Almaqtari, et al, 2018; Kumar and Bird 2020), however, their discussion from the point of view of impact of interest rates is very scanty. In order to fill this gap, we use bank-wise data to assess the impact of treasury yields on major components of profit of banks in India. IV. Empirical Findings a. Data and Summary Statistics The paper uses quarterly data for the period Q1:2015-16 to Q1:2022-23 covering 42 banks (PSBs and PVBs). We have left out foreign banks from our analysis as they constitute mere 6.3 of total assets of banking system as at end-March 2022. As various bank mergers occurred during the sample period, it resulted in an unbalanced panel. If only currently existing banks are included in the sample to make it a balanced panel, it will lead to survival bias. Given the need for relatively high frequency data to analyse the impact of G-sec yields on bank profitability, the paper uses off-site monitoring and surveillance database (OSMOS)5 for various banking sector indicators, which are available 2015 onwards on quarterly frequency. T-Bill rate, index of industrial production (IIP)6 and consumer price index (CPI) (combined) inflation are sourced from database on Indian economy (DBIE), RBI while bank specific indicators such as trading income, total income, operating profit, NIM, leverage, gross non-performing asset (GNPA) ratio, share of current account and saving account (CASA) deposits in total deposits, cost-income ratio, spread, liquid assets to total assets ratio, non-interest income to total income ratio, credit-deposit ratio and asset size have been sourced from the OSMOS system. To remove the outlier values, banking sector indicators data have been winsorized at 5 and 95 per cent. Three months moving average have been taken to smoothen the data relating to IIP growth. Summary statistics of variables used in the paper are presented in Annex 1. A Table on description of variables used in the paper has been given in Annex 2. Correlation matrix has been provided in Annex 3. b. Methodology and Discussion of Results To assess the impact of yield movements on bank profitability, fixed effect panel regression model has been estimated with four set of regression specifications with dependent variables - trading income/total income, NIM, operating profit/total assets and GNPA ratio. Usage of fixed effects model in case of unbalanced panel is quite common as the mechanics of fixed effects estimation with an unbalanced panel are not much more difficult than with a balanced panel (Wooldridge, 2016). The fixed effects panel model has been defined as per the following regression model: 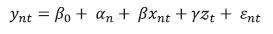 where γnt denotes the dependent variable (bank profitability), β0 is the intercept term on the explanatory variables, αn is fixed effects term, β is a k × 1 vector of parameters of main variables of interest i.e. 91 days T-Bill rate and slope, and otherbank specific control variables, γ is a k × 1 vector of parameters of macro-economic control variables to be estimated, and vector of observations is χnt which is 1 × k, t = 1 …, T; n = 1, …, N (here T=29, N=42). This paper uses short-term treasury yield as main variable of interest as it is considered a good proxy for the monetary policy stance (Alessandri and Nelson, 2015). Robust standard errors clustered by banks was estimated to correct possible serial correlation of the error terms and heteroskedasticity issues. In Table 1, regression results have been presented with trading income/total income and NIM as dependent variables. As expected, the short-term treasury yields (yield on 3-month T-Bills) were found to have negative impact on the trading income. This reflects hardening of yields leading to mark-to-market losses in the trading book of banks particularly their AFS and HFT portfolio as HTM portfolio is not marked-to-market. Trading income is also affected by hedging activities undertaken through derivative instruments intended to manage interest rate risk generated in the banking book. Slope was taken as proxy of hedging activity of banks. It was also found to affect trading income negatively. Interaction of T-bill rate along with dummy of top quartile banks (i.e. banks in terms of largest AFS and HFT portfolio) had a coefficient size much lower as compared to the regression with T-bill rate with total sample of banks. This shows that large banks can take larger interest rate positions and can hedge interest rate risk in a better manner. The maturity profile of instruments held for hedging often matches that of the underlying exposure intended to be hedged. So, against a negative sign on the slope coefficient in the trading equation to the extent that the bank intends to hedge across the maturity spectrum, a positive sign on the slope coefficient on the NIM is expected (Alessandri and Nelson (2015). In our model too both short-term yield and slope were found to have positive impact on net interest margin (NIM) albeit slope was not found to be significant. This suggests that the financial intermediation channel helps banks to attain higher profit even during the upward interest rate cycle as lending rate adjust faster than the deposit rates. Although, external benchmarking of lending rates has somewhat corrected this distortion in the monetary policy transmission. However, favourable interest rates offered on small saving instruments at times compete with deposit rates offered by banks, thereby causing some distortion in the smooth transmission (RBI, 2021). Further, it is argued that increases in rates may initially compress banks’ margins, and it is only in the long term, once repricing becomes possible, that higher interest rates contribute to higher NIMs (Alessandri and Nelson, 2015; Borio et al., 2017 and Cruz-Garcia, et al. (2019). In case of larger banks, the impact of rise in interest rates on NIM was found to be marginally higher, reflecting better management of their asset-liability profile. Inflation was found to have positive and significant impact on NIM which is in line with Bolt et al. (2012). In order to check for persistence, lagged dependent variable of NIM was taken as explanatory variable. Its positive sign showing persistence was found to be in line with literature. From the perspective of cost of funds, variables such as liquid assets to total assets and share of CASA deposits to total deposits were chosen. Cost to income ratio reflects operating efficiency of banks, while spread indicates intermediation margins. Cost to income ratio and liquid assets to total assets ratio were found to affect NIM negatively and found to be significant. Loan delinquencies were also found to be negatively associated with NIM as it leads to higher provisioning. The dummy variable for bank mergers was also found to affect interest margins of banks positively with strengthening of balance sheet of banks and efficiency gains. Other explanatory variables of interest such as share of current and saving account (CASA) deposits in total deposits and spread were also found to have positive impact on NIMs as CASA deposits are low-cost deposits as compared to term deposits and spread being difference between effective interest earned and interest payable.7 | Table 1: Estimation Results: Trading Income/ Total Income and NIM – Various Specifications | | Variables | Dependent Variable: Trading income/total income | Dependent Variable: NIM | | (1) | (2) | (3) | (4) | (5) | | NIMt-1 | | | 0.487***
(0.02) | 0.484***
(0.02) | | T-billt-1 | -1.015***
(0.14) | | 0.019**
(0.01) | | | T-billt-1*top quartile banks | | -0.134***
(0.024) | | 0.021**
(0.01) | | Slope t-1 | -1.968***
(0.18) | -0.194***
(0.079) | 0.015
(0.01) | 0.009
(0.01) | | Leverage | 0.223**
(0.11) | 0.014***
(0.005) | | | | Inflation | -0.017
(0.06) | -0.118**
(0.058) | 0.012**
(0.004) | | | Covid dummy | 1.171***
(0.27) | | | | | GNPA ratio | | | -0.008***
(0.002) | -0.010***
(0.002) | | CASA share | | | 0.008***
(0.002) | 0.006***
(0.002) | | Merger dummy | | | 0.198***
(0.05) | 0.209***
(0.05) | | Cost income ratio | | | -0.004***
(0.001) | -0.004***
(0.001) | | Spread | | | 0.396***
(0.02) | 0.397***
(0.02) | | Liquid assets to total assets | | | -0.007***
(0.002) | -0.008***
(0.002) | | Constant | 9.314***
(1.3) | 3.487***
(0.237) | 0.433***
(0.12) | 0.654***
(0.08) | | R-squared within | 0.164 | 0.079 | 0.818 | 0.817 | | No. of observations | 833 | 880 | 1070 | 1071 | | Bank Fixed Effect | Yes | Yes | Yes | Yes | Note: 1. Figures in parentheses refers to robust standard errors clustered by banks.
2. ***, ** and * indicate level of significance at the 1 per cent, 5 per cent and 10 per cent, respectively.
Source: Authors’ calculations. | In Table 2, operating profit/total assets and GNPA ratio have been taken as dependent variables. At the overall level, operating profit of banks was found to be positively associated with short-term treasury yields. This may be attributable to interest income and other non-interest income (such as fee and commission, income from forex operations, etc.) overwhelming the treasury income. This underscores the importance of interest income in the profitability of Indian banks, as during the last six years (2017-18 to 2022-23) the average share of interest income and trading income in total income was 84.5 per cent and 2.2 per cent, respectively. However, surprisingly coefficient of treasury yield for larger sized banks was found to be comparatively smaller and significant only at 10 per cent level. It may be attributable to higher share of interest income in total income of smaller banks. Control variables having a bearing on operating profits such as GNPA ratio, CASA ratio, cost-income ratio, non-interest income to total income, spread, liquid assets to total assets and Tier I leverage ratio were found to have expected signs. | Table 2: Estimation Results: Operating Profit/Total Assets and GNPA Ratio –Various Specifications | | Variables | Dependent Variable: Operating Profit/ Total Assets | Dependent Variable: GNPA Ratio | | (1) | (2) | (3) | (4) | (5) | | GNPA ratiot-1 | | | 0.935***
(0.011) | 0.927***
(0.011) | | T-billt-1 | 0.013***
(0.004) | | 0.094***
(0.028) | | | T-billt-1*top quartile banks | | 0.006*
(0.003) | | 0.130***
(0.045) | | GNPA Ratio | -0.004***
(0.001) | -0.004***
(0.001) | | | | CASA share | 0.003***
(0.001) | | | | | Cost income ratio | -0.009***
(0.001) | -0.011***
(0.001) | | | | Non-interest income to total income | 0.013***
(0.001) | 0.011***
(0.001) | | | | Spread | 0.057***
(0.008) | 0.064***
(0.006) | | | | Liquid assets to total assets | -0.002
(0.001) | | | | | Inflation | 0.003
(0.002) | | | | | Leverage | 0.009**
(0.004) | | | | | Covid dummy | -0.004
(0.011) | -0.005
(0.006) | | | | Credit-deposit ratio t-1 | | | 0.024***
(0.008) | 0.029***
(0.008) | | Asset size | | | 1.018**
(0.427) | 0.456
(0.358) | | IIP t-2 | | | -0.009
(0.002) | -0.001
(0.002) | | AQR dummy | | | 0.557***
(0.093) | 0.584***
(0.092) | | Observations | 880 | 1,165 | 1,083 | 1,083 | | R-squared within | 0.544 | 0.561 | 0.886 | 0.885 | | Number of banks | 42 | 42 | 42 | 42 | | Bank Fixed Effect | Yes | Yes | Yes | Yes | Note: 1. Figures in parentheses refers to robust standard errors clustered by banks.
2. ***, ** and * indicate level of significance at the 1 per cent, 5 per cent and 10 per cent, respectively.
Source: Authors’ calculations. | Higher interest rates are expected to lead to higher loan losses as with higher interest rates the probability of default on the existing stock of loans rises by increasing debt service burdens. It may also induce less risk-taking on new loans through the so-called risk-taking channel (Borio and Zhu, 2012; Borio et al 2017). Our findings suggest that rise in treasury yields lead to rise in GNPA ratio which is in line with the literature. However, in case of banks placed in top quartile increase in interest rates led to larger rise in GNPA ratio (Table 2). Further, the positive relation between credit-deposit ratio and GNPA ratio shows that excessive credit growth may be associated with high GNPAs. c. Is Banking Sector Better Prepared This Time? Macroprudential measures have provided cushion to banks for dealing with rising yield scenario. In October 2020, Reserve Bank allowed banks to exceed the ceiling up to an overall limit of 22 per cent of the NDTL from 19.5 per cent8 of NDTL to be considered for held to maturity. Furthermore, the limit was extended to 23 per cent of NDTL in April 2022. This dispensation was made available up to March 31, 2024 with the provision to restore to 19.5 per cent from June 30, 2024 in phased manner. The enhanced limit not only provided greater headroom to banks for investment in the SLR securities, but also enabled banks to better manage their investment portfolios by raising limits of SLR securities under the held to maturity (HTM) category. 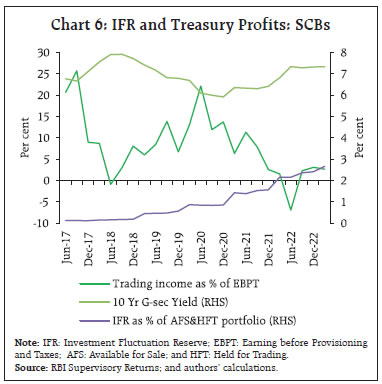 The investment fluctuation reserve (IFR)9 is created by transferring the gains realised on sale of investments. It enables banks to maintain an adequate reserve to protect against increase in yields on their balance sheet in the future. In the wake of the guidelines and with falling yields and resultant higher trading profits resulting in higher transfer of funds to IFR, the IFR has reached 2.2 per cent of HFT and AFS portfolio by end-March 2022 at the system level (Chart 6). However, with sharp rise in G-Sec yields and fall in bond prices in Q1:2022-23, banks recorded treasury losses in their trading book to the tune of 4.9 per cent of their operating profit. However, at the system level, SCBs managed to maintain their IFR above 2 per cent which reached 2.7 per cent by March 2023. As compared to PSBs, PVBs were more proactive in provisioning towards IFR. PVBs crossed 2.0 per cent of their HFT and AFS portfolio in September 2021, while PSBs reached IFR of 2 per cent in March 2022. Despite the hardening of G-Sec yields, PSBs and PVBs were able to manage IFR above 2 per cent (Chart 7a and b). V. Conclusion The current study investigates the impact of changes in domestic treasury yield on the profitability of banks in India. The empirical analysis suggests that the short-term yield and slope have a differentiated impact on trading income (negative) and net interest margin (positive). In the case of larger banks, the impact of short-term yield on trading income was found to be smaller as compared to the full sample of banks. NIM was found to be a bit more responsive to the short-term rate in the case of larger banks. The results suggest that larger banks may have managed the impact of rising yields better. With the systemic impact of interest rates on financial markets, the MTM losses have been a major source of concern for both banks and regulators. The macroprudential measures such as the creation of IFR have provided cushion to the banking sector against the current episode of hardening of yields. Going forward, strengthening of risk management practices and internal controls by banks remains of paramount importance. Deepening of interest rate derivatives market also assumes significance in mitigating the adverse movements in interest rates on bank portfolios by encouraging the participation of banks for hedging and neutralising large changes in yields. References Adrian, T., and H. S. Shin. (2009), “Money, Liquidity and Monetary Policy”, American Economic Review, 99(2): 600–05. Alessandri, P. and B. D. Nelson (2015), “Simple Banking: Profitability and the Yield Curve”, Journal of Money, Credit and Banking, 47(1): 143–175. Aliaga-Diaz, R., and M. P. Olivero (2011), “The cyclicality of price- cost margins in banking: An empirical analysis of its determinants”, Economic Inquiry, 49:26–46. Almaqtari, F.A., E. A. Al-Homaidi, M. I. Tabash and N. H. Farhan (2018), “The Determinants of Profitability of Indian Commercial Banks: A Panel Data Approach”, International Journal of Finance and Economics, https://doi.org/10.1002/ijfe.1655. Bikker, J.A. and T.M. Vervliet (2017), “Bank Profitability and Risk-taking under Low Interest Rates”, International Journal of Finance & Economics. 23:3–18. Bolt, W., De Haan, L., Hoeberichts, M., Van Oordt, M., and Swank, J. (2012), “Bank Profitability during Recession”, Journal of Banking and Finance. 36: 2552– 2564. Borio, C., & Zhu, H. (2012), “Capital Regulation, Risk-taking and Monetary Policy: A Missing Link in the Transmission Mechanism?” Journal of Financial Stability, 8:236–251. Borio, C., L. Gambacorta, and B. Hofmann (2017), “The Influence of Monetary Policy on Bank Profitability”, International Finance, 20(1):48-63. Busch, R. and C. Memmel (2015), “Banks’ Net Interest Margin and the Level of Interest Rates”, Bundesbank Discussion Paper No. 16/2015. Claessens, S, N. Coleman and M. Donnelly (2018), ““Low-For-Long” Interest Rates and Banks’ Interest Margins and Profitability: Cross-country Evidence,” Journal of Financial Intermediation, 35 (2018):1–16. Cruz-García, P., J. F. D. Guevara and J. Maudos (2019), “Determinants of Bank’s Interest Margin in the Aftermath of the Crisis: the Effect of Interest Rates and the Yield Curve Slope,” Empirical Economics, 56(1): 341-365. Egly, P. V., D. W. Johnk and A. V. Mollick (2018), “Bank Net Interest Margins, the Yield Curve, and the 2007– 2009 Financial Crisis”, Review of Financial Economics, 36:12–32. English, W.B. (2002), “Interest Rate Risk and Bank Net Interest Margins”, BIS Quarterly Review, December, pp. 67-82. Kashyap, A.K and J.C. Stein (2000), “What Do a Million Observations on Banks Say about the Transmission of Monetary Policy?” American Economic Review, 90 (3): 407-428. Kumar, V. and R. Bird (2020), “Factors Influencing the Profitability of Banks in India and China”, Applied Economics Letters, DOI: 10.1080/13504851.2020.1869153. Maddaloni, A. and J. L. Peydr (2011), “Bank Risk-Taking, Securitization, Supervision, and Low Interest Rates: Evidence from the Euro-Area and the US Lending Standards”, Review of Financial Studies, 24: 2121–65. Montes, C.P. and Perez, A. F. (2018), “The Impact of the Interest Rate Level on Bank Profitability and Balance Sheet Structure”, Revista de Estabilidad Financiera, Banco de España, November. Naqvi H. and R. Pungaliya (2023), “Bank size and the transmission of monetary policy: Revisiting the lending channel”, Journal of Banking & Finance,146: 1-17. Reserve Bank of India (2021) “Monetary Policy Report”, April. Reserve Bank of India (2023a) “Annual Report 2022- 23”, May. Reserve Bank of India (2023b) “Financial Stability Report”, June. Saini, S., W. Ahmad and S. Bekiros (2021), “Understanding the credit cycle and business cycle dynamics in India”, International Review of Economics & Finance 76(1). Samuelson, P. A. (1945), “The Effect of Interest Rate Increases on the Banking System”, American Economic Review, 35(1):16-27. Wooldridge, J.M. (2016), “Introductory Econometrics – A Modern Approach”, 6th Edition, Cengage Learning, Boston.
| Annex 1: Descriptive Statistics | | Variable | Number of observations | Mean | Std. dev. | Min | Max | | NIM | 1166 | 3.17 | 0.69 | 2.27 | 4.42 | | Trading income | 1163 | 2.72 | 2.24 | 0.15 | 7.12 | | EBPT | 1166 | 0.49 | 0.19 | 0.22 | 0.82 | | GNPA | 1166 | 8.14 | 5.28 | 1.80 | 17.24 | | T-Bill | 1260 | 5.49 | 1.52 | 3.07 | 7.94 | | Slope | 1260 | 1.45 | 1.06 | -0.20 | 3.27 | | Leverage | 881 | 6.54 | 1.92 | 4.26 | 9.84 | | Inflation | 1260 | 4.80 | 1.35 | 2.20 | 7.30 | | CASA | 1166 | 34.98 | 8.25 | 23.24 | 47.74 | | Cost-income ratio | 1165 | 51.67 | 8.65 | 40.11 | 67.75 | | Non-interest income | 1165 | 12.87 | 3.84 | 7.34 | 19.24 | | Spread | 1169 | 2.86 | 0.52 | 2.14 | 3.74 | | Liquid assets ratio | 1166 | 17.30 | 4.01 | 11.82 | 24.58 | | C-D ratio | 1166 | 74.77 | 8.89 | 60.21 | 89.02 | | Asset | 1166 | 5.23 | 0.47 | 4.43 | 5.92 | | IIP | 1260 | 3.87 | 12.80 | -35.56 | 58.31 | | Note: Banking sector indicators after 5 per cent winsorisation from each side. |
| Annex 2: Description of Variables | | NIM | Net interest income as percentage of average assets. | | Slope | Difference between 10-year G-sec yield and 91 days T-Bill rate. | | Leverage | Tier I capital to Total Exposure | | Inflation | CPI (combined) y-o-y inflation | | Covid dummy | Periods strongly affected by covid-19 i.e. Q1:2020-21 to Q4:2021-22 has been taken as 1; otherwise, zero | | GNPA Ratio | Gross NPAs to Gross Advances | | CASA share | Share of Current Account and Saving Account (CASA) deposits in total deposits | | Merger dummy | The period in which a bank was merged with bank under consideration 1; otherwise, zero | | Cost-income ratio | Non-Interest Expense / Net Total Income | | Spread | Interest Income / Interest Earning Assets - Interest Expense / Interest Bearing Liabilities | | Liquid assets to total assets | (Cash funds + Dues from banks and financial institutions (FIs) in India + Dues from overseas banks and FIs)/ Total Assets | | Non-interest income to total income | Non-interest income / total income | | Credit deposit ratio | Loan and advances/Deposit | | IIP | y-o-y IIP growth | | Trading Income | Profit/(loss) on securities trading | | Operating Profit/ Assets | Earnings before provision and taxes / Total Assets | | Assets | Total Assets of a bank | | AQR Dummy | Asset quality review (AQR) of banks was undertaken by the Reserve Bank of India in July-September 2015 for improved recognition of NPAs which led to sharp rise in GNPAs. To account of its impact, AQR dummy was used with Q3:2015-16 to Q2:2016-17 as 1; otherwise, zero. |
| Annex 3: Correlation Matrix | | | NIM | Trading income | EBPT | GNPA | T-Bill | Slope | Leverage | Inflation | CASA | Cost- income ratio | Non- interest income | Spread | Liquid assets ratio | C-D ratio | Asset | IIP | | NIM | 1.00 | | | | | | | | | | | | | | | 1.00 | | Trading income | -0.34*** | 1.00 | | | | | | | | | | | | | | | EBPT | 0.74*** | -0.04 | 1.00 | | | | | | | | | | | | | | GNPA | -0.63*** | 0.24*** | -0.53*** | 1.00 | | | | | | | | | | | | | T-Bill | -0.19*** | 0.02* | -0.13*** | 0.03 | 1.00 | | | | | | | | | | | | Slope | 0.20*** | -0.22*** | 0.09*** | -0.04 | -0.92*** | 1.00 | | | | | | | | | | | Leverage | 0.79*** | -0.23*** | 0.68*** | -0.71*** | -0.16*** | 0.15*** | 1.00 | | | | | | | | | | Inflation | 0.11*** | -0.16 | 0.04** | -0.12*** | -0.39 | 0.52*** | 0.08*** | 1.00 | | | | | | | | | CASA | 0.17*** | 0.03*** | 0.14*** | 0.29*** | -0.29*** | 0.29*** | -0.02*** | 0.08*** | 1.00 | | | | | | | | Cost- income ratio | -0.36*** | -0.06 | -0.75*** | 0.28*** | 0.03*** | 0.00*** | -0.41*** | 0.02** | -0.06** | 1.00 | | | | | | | Non- interest income | 0.31*** | 0.21*** | 0.59*** | -0.16*** | -0.35*** | 0.28*** | 0.33*** | 0.06*** | 0.36*** | -0.46*** | 1.00 | | | | | | Spread | 0.74*** | -0.25 | 0.49*** | -0.25*** | -0.20*** | 0.21*** | 0.41*** | 0.08*** | 0.26*** | -0.22*** | 0.23*** | 1.00 | | | | | Liquid assets ratio | -0.19** | 0.20*** | -0.19 | 0.26 | -0.01*** | -0.04 | -0.12*** | -0.11 | 0.21*** | 0.20*** | 0.04*** | -0.08*** | 1.00 | | | | C-D ratio | 0.59*** | -0.26*** | 0.57*** | -0.58*** | 0.05*** | -0.02*** | 0.74*** | 0.01** | -0.12*** | -0.39*** | 0.29 | 0.22 | -0.42*** | 1.00 | | | Asset | -0.13** | 0.14*** | 0.12 | 0.30*** | -0.14*** | 0.13*** | -0.16*** | 0.06*** | 0.62 | -0.28*** | 0.38*** | 0.00*** | 0.02*** | 0.00 | 1.00 | | IIP | 0.06 | 0.12*** | 0.06 | -0.03 | -0.34 | 0.37*** | 0.06* | 0.26** | 0.08 | -0.04*** | 0.12 | 0.07 | 0.02 | -0.06 | 0.03 | | Note: ***, ** and * indicate level of significance at the 1 per cent, 5 per cent and 10 per cent, respectively. |
|