The global economy shows signs of slowing down in the final quarter of 2023 as manufacturing languishes while services sector activity appears to have reached the end of its post-pandemic expansion. Going forward, tightening financial conditions is a significant risk to the global outlook. In India, the momentum of the change in GDP is sequentially expected to be higher in Q3:2023-24, with festival demand remaining ebullient. Investment demand appears to be resilient with the government’s infrastructure spending, an uptick in private capex, automation, digitalisation, and indigenisation providing a boost. Headline inflation came down to 4.9 per cent in October from the average of 6.7 per cent in 2022-23 and 7.1 per cent in July-August 2023. Introduction Intensifying geopolitical strife has flung a pall of uncertainty around the global economy as it slows in the final quarter of 2023, albeit with considerable cross-country variations. Europe appears to be on the edge of recession, China is stalling. The US has emerged as a key driver of global growth although its outlook is more uncertain now than before as it swings from hard landing to soft landing to no landing. Several parts of Asia remain bright spots but in Latin America, activity is losing steam. In this context, it has been pointed out that instead of resembling a bell-shaped distribution of potential outcomes with a single peak and slender tails, the global outlook looks like a multi-modal distribution with fat tails suggesting a higher likelihood of extreme events1. Globally, manufacturing is languishing while services sector activity appears to have reached the end of its post-pandemic expansion. Labour markets are exhibiting signs of weakening and consumer and business confidence is dented by the recent deep sense of insecurity as wars rage. The tightening of financial conditions is a major risk to the global outlook, with the recent spike in bond yields indicative of further impending pass-through to borrowing costs. The across-the-board and across the world retreat of bond yields from October highs on the announcement of a slower pace of longer dated issuances in the US suggests that fiscal risks have overtaken higher-for-longer risks in elevating bond yields. With average gross debt levels in advanced economies (AEs) projected by the International Monetary Fund (IMF) to rise from 112 per cent of GDP in 2023 to 116 per cent by 2028 – as against a rise from 68 per cent to 78 per cent among emerging market economies (EMEs) – the fiscal risk to bond yields is likely to linger. Factors like quantitative tightening expectations and leveraging have steepened yield curves, but the root cause is fiscal risk that is driving up term premia, amidst heightened uncertainty. By contrast, monetary policy risk is on the ebb in market expectations as bets accumulate about who will blink first and when rate cuts will take over from pauses, irrespective of how hawkish central banks sound now. Inflation has been abating, but at a slow, stubborn pace and is likely to remain uncomfortably above targets in many countries for the third year in succession. Unlike in AEs, core inflation is steadily easing in EMEs but food and energy price shocks keep imparting upticks to the headline. The recent volatility in crude prices amidst geopolitical tensions in the Middle East threatens the inflation outlook across the world, especially if hostilities prolong and widen. On November 8, however, crude prices slipped to their lowest in more than three months on concerns over waning demand, including from the US where the US Energy Information Administration (EIA) expects petroleum consumption to fall by 300,000 barrels per day while stocks rise. With these prospects, interest rate expectations remain firm, bringing in their train two fears: recession and financial instability. Financial markets are undergoing a broad repricing, posing another risk to the global outlook. After a brief easing on flight to safety when tensions flared in the Middle East, benchmark bond yields in the US crossed 5 per cent in the later part of October before the announcement of a slower pace of long dated issuances in the US referred to earlier, cheered bond markets. Other parts of the world also saw less sharp surges in bond yields, and sovereign spreads widened for countries with relatively higher fiscal pressures. Overall, investors worry about shrinking fiscal space, given soaring deficits and debt levels as well as higher debt servicing costs in a high interest rate environment. Elevated bond yields have driven corrections in equity markets. Credit spreads have widened. The US dollar has largely stabilised at elevated levels relative to March 2022 when the US Fed started raising rates, indicative of other factors such as safe haven demand that are imparting an upside. Net portfolio capital flows have been exiting EMEs since August, with net outflows of US$ 3.4 billion in October before slender net inflows occurred in the first week of November. International trade is weighed down by the strong US dollar and the post-pandemic rebalancing of consumption. Weak exports are a drag on growth across the world. As stated in the October edition of the State of the Economy, the World Trade Organisation (WTO) downgraded its forecast for world merchandise trade volume growth for 2023 to just 0.8 per cent, with risks mostly to the downside as the global outlook deteriorates, and conflict weighs on prospects. The slowdown in international trade is encompassing a broad swathe of countries and a wide array of goods, specifically manufactures such as iron and steel, office and telecom equipment, textiles and clothing. Although trade in services has remained resilient so far, the growth of global trade in goods and services in 2023 is going to be significantly below world output and lower than its average growth during the last decade. Uncertainty about the global outlook is also being driven by the inadequate response to climate change. The world is on track to produce 100 per cent more fossil fuels by 2030, according to the UN, despite net zero emission pledges and the expectation that fossil fuel demand will peak in this decade. October 2023 was the warmest October on record globally, with average surface air temperature of 15.3 degrees Celsius, 0.85 degrees above the 1991-2020 average and 0.4 degrees higher than in the previous warmest October in 2019. Even the sea surface temperature for the month of October was the warmest on record. For January to October, the global mean surface temperature for 2023 is the highest too, 1.43 degrees above the 1850-1900 pre-industrial average. The US National Center for Environmental Information assigns a 99 per cent probability to 2023 ranking as the warmest year on record globally. Antarctic sea ice extent is at record low levels. With El Nino conditions continuing, climate change is fuelling increasingly destructive outcomes, with drought, floods, severe heatwaves and wildfires threatening several parts of the world. On a positive note, however, heading towards COP28, climate negotiators reached an agreement in Abu Dhabi on November 4 on a framework for a fund to be hosted by the World Bank to help vulnerable nations deal with loss and damage from extreme weather events. In India, estimates of gross domestic product (GDP) for the second quarter (Q2) of 2023-24 will be released at the end of this month. There is wide consensus supported by nowcasts that real GDP growth will outperform the projections of the Reserve Bank of India (RBI) pegged at 6.5 per cent for the quarter. The RBI’s projections incorporated a turnaround in the momentum of activity into expansion in Q2 and hence the consensus, if actualised, would imply a stronger pace of activity than projected. This optimism appears to have been corroborated by corporate results for Q2. Bottomline growth was robust and broad-based, with companies in sectors such as oil and gas, automobiles and construction delivering sharp increases in profitability. Information technology (IT) companies, on the other hand, declared weaker earnings results than in the preceding quarter and many of them have lowered their forward revenue guidance in response to global macroeconomic uncertainty and reduction in discretionary expenditure by their clients. Auto companies stood out in posting a strong revenue performance as the main driver of profitability, spurred by volume growth, lower raw material costs and price hikes. Base effects favoured profits growth in the case of oil marketing companies. Cement, construction and transportation companies recorded jumps in profits, aided by volume growth on the back of the government’s spending on infrastructure, and residential demand. Falling input cost pressures also aided the profitability of corporates across the board. Fast moving consumer goods sector companies (FMCG) registered moderate growth, mainly on account of their rural sales. Banks were powered by strong credit demand which pushed up their toplines, although rising interest expenses on account of higher interest rates on deposits exerted some pressure on their margins. Provisioning costs continued to remain low, reflecting stable asset quality which, in turn, improved their profitability. In Q3, the RBI projects real GDP growth at 6 per cent; although the momentum of the change in GDP is sequentially expected to be higher, this advantage may be offset by base effects. Early estimates of kharif output, which would be incorporated into Q2 and Q3 GDP estimates, have been adversely impacted by the uneven spatio-temporal distribution of the south west monsoon across all crops. A strong increase in rabi sowing acreage in spite of lower reservoir levels and deficient north-east monsoon rainfall may, however, compensate and improve agricultural production for the year as a whole. Purchasing managers indices for both manufacturing and services remained in expansion in October, although they moderated somewhat from the sizzling pace recorded over the preceding four months. Festival demand is ebullient. In urban areas, consumer appliances are in strong demand, especially in the mid- and premium segments. Consumer sentiment is upbeat. Close to 80 per cent of purchases of consumer durables are reported to be through consumer financing schemes spiced up with attractive equated monthly instalment (EMI) offers. Entry-level segment demand is relatively subdued as ‘premiumisation’ shows clear signs of developing into a consistent trend. Micro, small, and medium enterprises (MSMEs) supplying to in-demand segments are also experiencing a surge in orders, particularly from businesses selling through platforms and large format stores. In turn, bank loans to MSMEs is strong. In the affordable housing space, sales have declined, deterred by high interest rates, but surging growth is taking hold for houses in the ₹1-2 crore and ₹50 lakh-1crore segments. Festival spending and consumer exuberance are also driving record loan disbursements by non-banking financial companies (NBFCs). Nearly half of the credit demand is originating from tier 3 cities. Rural demand accounts for a third of the revenues of consumer goods companies. Overall rural volume growth is estimated to have risen by 6.4 per cent (versus 10.2 per cent in urban areas). Non-food companies are tracking better in terms of rural volumes than food companies. This is partly attributed to aggressive sales pitches by small and regional players, indicative of the rural consumer becoming increasingly price sensitive and switching to cheaper alternatives and smaller sized packs. Investment demand appears to be resilient, with capital goods equity indices being among the top performing sectoral indices. The government’s infrastructure spending, an uptick in private capex, automation, digitalisation and indigenisation are cited as factors providing a boost to investment activity. Capital expenditure by states has surged alongside that of the centre. Companies are reported to be realigning their production and supply lines to diversify their manufacturing locations beyond China, supported by deleveraged balance sheets. Improvements in supply chain dynamics, a strong order backlog being executed, and lower raw material and freight costs are also supporting profitability in this segment. Meanwhile, inflation continued on its welcome descent in October to its lowest level in three months. Most hearteningly, core inflation fell by close to 200 basis points to a 43-month low from its recent peak in January 2023. Disinflationary monetary policy is working its way through the economy, steadily excoriating underlying inflationary pressures. Alongside, input costs are softening, as reflected in the sustained deflation in wholesale prices. Wage and rental pressures also remain muted. Fuel group prices went into deflation. Clearly, the only risk to the RBI’s resolve to align headline inflation with the target of 4 per cent is food inflation. Several constituent prices are already firming up – onions; tomatoes; cereals; pulses; and sugar – with the potential to disrupt the gains made in the last two months. Accordingly, in the RBI, we are bracing up for upticks in the readings for November and December. Financial markets have been buoyed by positive spillovers from the Fed’s pause and the slower increase planned in longer dated US treasuries. Equity markets rallied, driven by gains in capital goods, metals and industrials. The bull play was supported by the softening of commodity prices, especially crude, as well as improvements in India’s medium-term growth prospects that were cited by rating agencies. In the bond market, the inaugural auction of the ultra-long 50-year government security in early November saw heavy over-subscription, which lifted market sentiment all around. Benchmarks have been trading with a softening bias since then while corporate bond spreads have undergone further compression. Foreign portfolio inflows into the debt market in October were the second highest in the calendar year; there have been net inflows into this segment right from April and this has continued into the first week of November as well. In the credit market, the outlook remains positive, led by retail demand. Orderly conditions prevail in the forex market. Set against this backdrop, the remainder of the article is structured into four sections. Section II covers the rapidly evolving developments in the global economy. An assessment of domestic macroeconomic conditions is set out in Section III. Section IV encapsulates financial conditions in India, while the last Section sets out concluding remarks. II. Global Setting Recent data releases including the better than expected growth in the US have raised hopes of the global economy avoiding a hard landing although growth trajectories are divergent; our model-based nowcast for global GDP growth points to a moderation in Q4:2023 (Chart II.1).
With the onset of a new conflict in the Middle East and lingering Russia-Ukraine war, risks to global growth and commodity prices have risen. Currently, the geopolitical risk index is at a fourteen month high (Chart II.2a). On the other hand, the global supply chain pressures index (GSCPI) eased to (-) 1.7 in October 2023 (Chart II.2b). Consumer sentiments worsened, especially in the US and the euro area in October, amidst multiple sources of uncertainty. China, the US and the EU witnessed further tightening of financial conditions (Chart II.3a and II.3b). The global composite purchasing managers’ index (PMI) ebbed to 50.0 in October from 50.6 in August – its lowest reading since January. The downturn in manufacturing became more pronounced, with the global manufacturing PMI declining to a three-month low of 48.8 in October 2023 – the fourteenth consecutive month in contraction. The growth slowdown in services continued (Chart II.4).
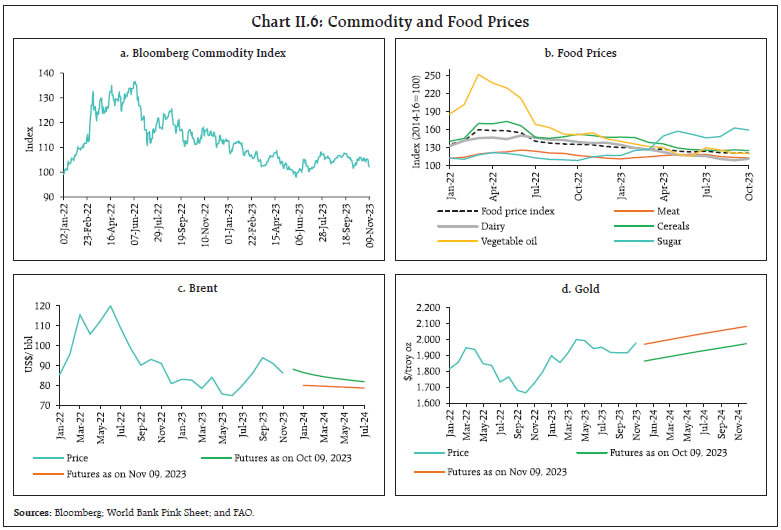
Global trade continues to face significant headwinds. Export orders for manufacturing declined in October, after two months of improvement (Chart II.5). Export orders for services recorded a sequential improvement, reversing the declining trend observed since June 2023. In October, global commodity prices recorded a broad decline, with the Bloomberg Commodity Price Index falling by 0.2 per cent (m-o-m) [Chart II.6a]. The Food and Agriculture Organization’s (FAO’s) food price index also recorded a decline of 0.5 per cent (m-o-m), reflecting the downturn in the price indices for sugar, cereals, vegetable oils and meat, while the index for dairy products rebounded (Chart II.6b). Crude oil prices softened, averaging US$ 91.3 per barrel in October and further to US$ 82.7 per barrel as on November 10, as compared with US$ 94 per barrel a month ago in response to increased output from the OPEC and the US, and easing market concerns about potential supply disruptions due to the middle-east conflict as well as ebbing demand concerns (Chart II.6c). Safe-haven demand is expected to support further gains in gold prices, as evident from the upward shift in the futures following a brief consolidation period (Chart II.6d). 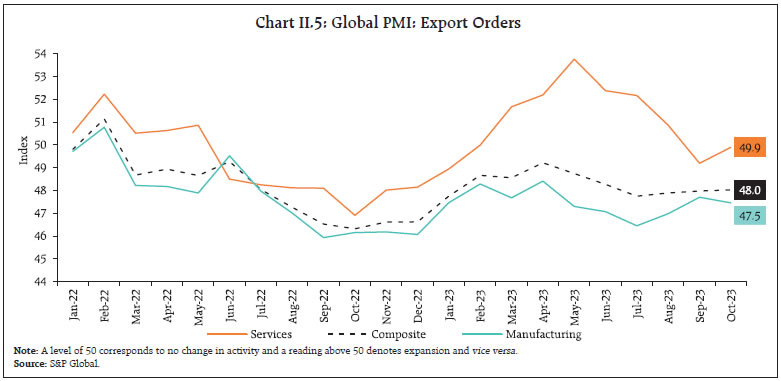
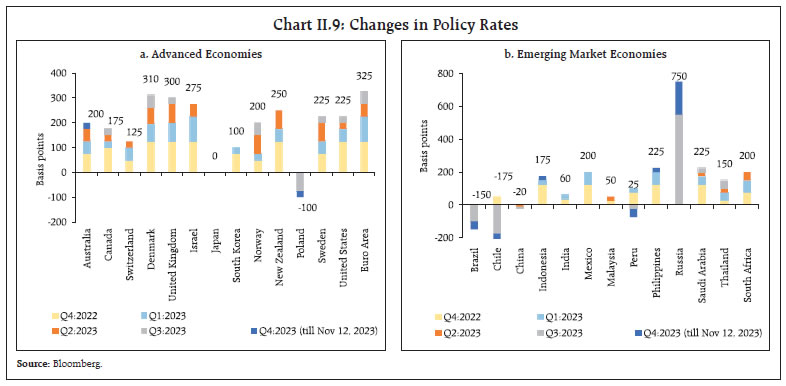
 A very gradual disinflation is underway even though headline inflation is still above the target in most economies. In the US, the headline personal consumption expenditure (PCE) inflation remained steady for the third consecutive month at 3.4 per cent (y-o-y) in September, with core PCE inflation moderating marginally to 3.7 per cent. CPI inflation in the US moderated to 3.2 per cent (y-o-y) in October from 3.7 per cent in September. Euro area inflation fell back to 2.9 per cent (y-o-y) in October from 4.3 per cent in September, reaching its lowest level since July 2021 (Chart II.7a). CPI inflation in the UK moderated to 4.6 per cent in October from 6.7 per cent in September, while Japan’s inflation (CPI excluding fresh food) moderated to 2.8 per cent in September from 3.1 per cent in August. Among emerging market economies (EMEs), inflation edged up further to an eight-month high in Russia in October while China recorded a deflation of 0.2 per cent in October reflecting weak demand and oversupply (Chart II.7b). Core and services inflation have eased in recent months, although they remain much above the headline in most AEs (Chart II.7c and II.7d). 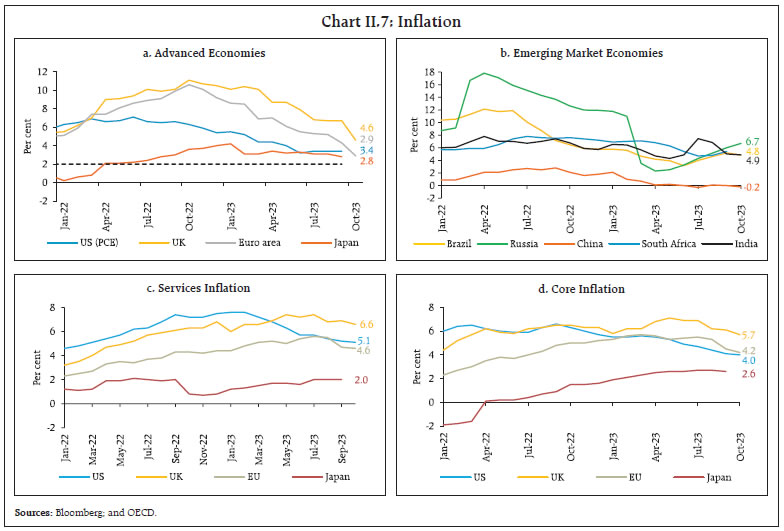 Global equity markets retreated in October due to a surge in the US Treasury yields, heightened Middle East tensions, and elevated oil prices (Chart II.8a). The US government bond yields hardened in anticipation of a “higher for longer” monetary policy stance, reinforced by robust economic data and concerns about increasing bond supply. Meanwhile, the 2-year yield modestly hardened by 4 bps, resulting in a smaller spread averaging (-) 28 bps in October, compared to (-) 67 bps in September (Chart II.8b). The US treasury yields recorded a pullback in early November, on account of reasons alluded to in the introduction. In the currency markets, the US dollar appreciated by 0.5 per cent (m-o-m) in October. The Morgan Stanley Capital International (MSCI) currency index for EMEs remained rangebound in October, but it recorded modest gains in November 2023 so far (up to 14th) as the US dollar pared some of its gains (Chart II.8c and II.8d). AE central banks, in general, opted for a pause (Chart II.9a). In its November policy meeting, the US Fed held the target range of the Federal Funds rate steady at 5.25-5.5 per cent for the second consecutive time, after hiking by 525 basis points cumulatively since March 2022. The ECB decided to halt its tightening cycle for the first time in October. The Bank of Japan (BoJ) decided to further increase flexibility in the conduct of yield curve control and re-defined 1.0 per cent as a loose “upper bound” rather than a rigid cap, while removing the pledge to defend the level of yields with offers to buy an unlimited amount of bonds. Australia raised its policy rate by 25 bps after maintaining it steady in previous four meetings. On the other hand, EMEs have resorted to divergent policy options. Indonesia and the Philippines raised their policy rates by 25 bps each in October, marking the first adjustment after a series of pauses. Russia and Turkey hiked their policy rates by 200 bps and 500 bps, respectively. Sri Lanka, Brazil and Chile opted to reduce their policy rates by 100 bps, 50 bps and 50 bps, respectively while Peru and Poland reduced policy rates by 25 bps each (Chart II.9b). 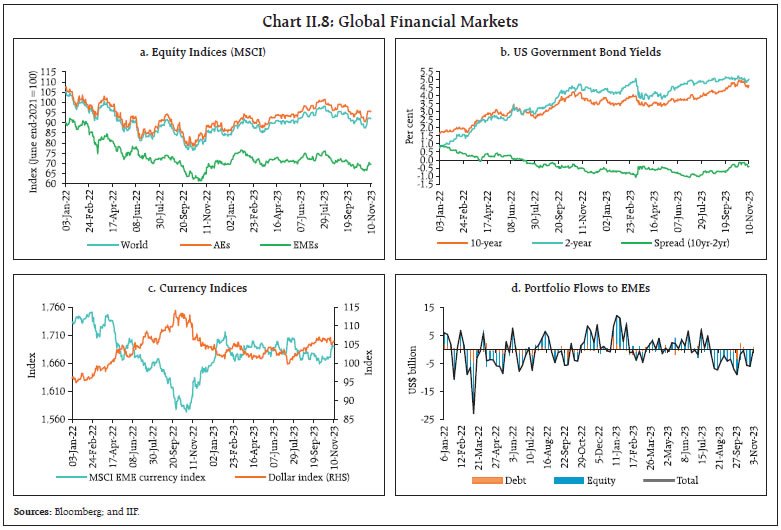
 III. Domestic Developments India is poised to maintain its growth momentum as strong macroeconomic fundamentals impart resilience in the face of global headwinds. Investment in the private sector is beginning to pick-up as funds intended for capital expenditure (capex) raised by corporates through different channels – from banks/ financial institutions (FIs), external commercial borrowings (ECBs), and initial public offerings (IPOs) – during H1:2023-24 were 60 per cent higher than during H2:2022-23 (Chart III.1a) Supply chain pressures in India receded in October (Chart III.1b). Our economic activity index (EAI) nowcasts GDP growth for Q3:2023-24 at 6.3 per cent (Chart III.1c and III.1d). Aggregate Demand Demand conditions, as evident from high frequency indicators, remain firm. E-way bills reached an all-time high of ₹10.3 crores in October 2023 on the back of festival-led consumption and better tax compliance (Chart III.2a). Toll collection receipts expanded by 24 per cent (y-o-y) [Chart III.2b]. Automobile sales registered an expansion of 20.3 per cent (y-o-y) in October 2023, on the back of festival demand (Chart III.3a and III.3b). Both passenger vehicle and three-wheeler recorded highest ever sales in October. Electric vehicles (EV) accounted for 54 per cent of retail three-wheeler sales. Two-wheeler sales grew by 20.1 per cent. Tractor sales increased sequentially, albeit recording a y-o-y decline on a high base (Chart III.3b). Retail sales picked up sequentially in October, as reflected in vehicle registrations, although y-o-y growth remained in negative territory (Chart III.3c). The daily average consumption of petroleum products grew by 2.1 per cent (m-o-m) in October as the festival season drove an increase in fuel demand (Chart III.3d).
Sales growth of manufacturing companies in real terms accelerated to 6.7 per cent (y-o-y), driven by volume growth in Q2:2023-242. In nominal terms, however, sales grew slower by 3.3 per cent (Chart III.4). Net profit margin of fast-moving consumer goods (FMCG) companies3 improved in Q2:2023-24 even as operating profit margin remained at the level of the previous quarter (Chart III.5). Sales also recorded an improvement during the quarter. As per the survey conducted by the Retailers Association of India, retail sales recorded a stable growth of 9.0 per cent in September 2023, indicative of robust consumer demand. The quick service restaurants, sports goods, consumer durables & electronics and food & grocery categories recorded higher growth, whereas the footwear and beauty, wellness & personal care categories moderated (Chart III.6).
The all-India unemployment rate (UR) increased to 10.1 per cent in October, driven by higher UR in rural areas even as urban UR declined (Chart III.7a). The labour force participation rate (LFPR) also recorded an increase in both urban and rural areas (Chart III.7b).
The employment outlook in the organised sector, as polled by the PMIs for manufacturing and services, remained in the expansionary zone (Chart III.8). With the onset of the North-east monsoon and the start of rabi sowing in October, the number of households demanding work under the Mahatma Gandhi National Rural Employment Guarantee Scheme (MGNREGS) continued to decline (Chart III.9).
India’s merchandise exports at US$ 33.6 billion in October 2023 registered a growth of 6.2 per cent (y-o-y) reversing the contraction in September (Chart III.10). More than two-thirds of the export basket (22 out of 30 major commodities) registered y-o-y growth. Drugs and pharmaceuticals, engineering goods, electronic goods, cotton yarn and iron ore were the key drivers of export growth whereas gems and jewellery, petroleum products, rice, readymade garments, and mica, coal and other ores were the major laggards (Chart III.11). Sugar exports from India declined by 50.6 per cent (y-o-y) in April-September 2023 due to the export limit of 6 million tonnes imposed during October-September 2022-23 (Chart III.12a). There is a likelihood of lower sugar production in India and Thailand4 – leading sugar producers – due to El Nino conditions. These two countries, together with Brazil, account for 70 per cent of global sugar exports. In India, yields are expected to be impacted by patchy rains. The Indian Sugar Mills Association (ISMA) estimates sugar production to decline from 36.6 million tonnes in 2022-23 to 33.7 million tonnes in 2023-24 (Oct-Sept). In view of rising prices and to ensure sufficient domestic availability, including for ethanol blending, the Government extended restrictions on sugar exports beyond October 31. Retail prices for sugar in India increased by 5.5 per cent (y-o-y) in October 2023. In September, global sugar prices recorded their highest level since 2012 amid supply concerns before easing marginally in October (Chart III.12b).
Merchandise imports surged to US$ 65 billion in October 2023, registering growth of a 12.3 per cent (y-o-y), after eight consecutive months of contraction (Chart III.13). Two-thirds of the import basket (20 out of 30 major commodities) registered growth on a y-o-y basis. Gold was the leading driver of import growth, followed by electronic goods, petroleum, oil and lubricants (POL), silver and machinery while transport equipment, fertiliser, vegetable oil, pearls, precious and semi-precious stones and cotton contributed negatively in October 2023 (Chart III.14).
Accordingly, the merchandise trade deficit widened to an all-time high of US$ 31.5 billion in October. The oil deficit also rose to US$ 11.7 billion, accounting for 37.1 per cent of the overall merchandise trade deficit (Chart III.15). During April-October 2023, India’s merchandise exports at US$ 244.9 billion contracted by 7.0 per cent (y-o-y). Merchandise imports at US$ 392.0 billion declined by 8.9 per cent (y-o-y). Consequently, the merchandise trade deficit narrowed to US$ 147.1 billion from US$ 167.1 billion during the corresponding period a year ago. Petroleum products were the major source of the cumulative trade deficit, followed by electronic goods (Chart III.16). Country-wise, China and Russia remained the major sources of the trade deficit during this period.
Services exports at US$ 28.4 billion in September 2023 declined by 2.7 per cent (y-o-y), primarily driven by transportation and financial services. On the other hand, services imports declined by 10.3 per cent, resulting in net services earnings of US$ 13.8 billion in September 2023 (Chart III.17).
The gross fiscal deficit (GFD) of the central government stood at 39.3 per cent of the budget estimates (BE) for H1:2023-24, marginally higher than 37.3 per cent of BE a year ago. This is attributable to an increase in capital expenditure by 43.1 per cent (y-o-y) and revenue expenditure by 10.0 per cent (y-o-y) [Chart III.18a]. Capital outlay (i.e., capital expenditure excluding loans and advances) recorded an increase of 30.2 per cent, resulting in a marked improvement in the quality of spending of the central government (Chart III.18b). On the receipts side, direct tax collections grew by 25.2 per cent (y-o-y) during H1:2023-24, with income tax and corporate tax collections growing by 31.1 per cent and 20.2 per cent, respectively. Direct taxes underwent an ebullient upswing in August-September 2023. The robust growth in direct tax collections is attributable to increased compliance, higher advance tax collections and a widening tax base.5,6,7 On the other hand, indirect tax collections grew by 6.6 per cent (y-o-y), with the growth in goods and services tax (GST) and customs revenues outweighing the contraction in excise duties. Higher custom revenues are attributable to, inter alia, higher export and import duties for a few items, counterweighing the contraction in excise duties y-o-y partly due to duty cuts announced last year. Overall, gross tax revenue recorded a growth of 16.3 per cent (y-o-y), led by growth in all major tax heads, except excise collections, which registered a contraction of 10.8 per cent (Chart III.19). 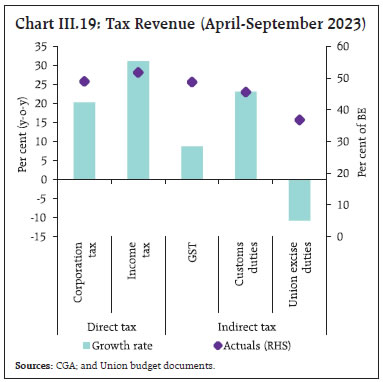
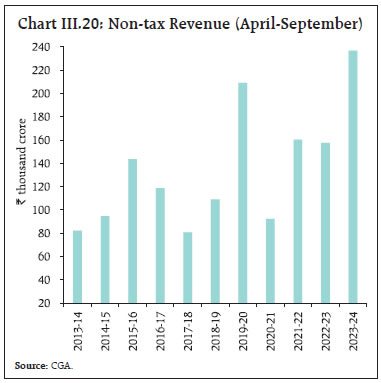 Non-tax revenue collection recorded a y-o-y growth of 50.2 per cent during H1:2023-24, on the back of higher than budgeted surplus transfer from the Reserve Bank,8 while non-debt capital receipts contracted by 41.0 per cent9 (Chart III.20). Total receipts of the central government recorded an expansion of 17.7 per cent on a y-o-y basis. GST collections (Centre plus States) grew by 13.4 per cent (y-o-y) to ₹1.72 lakh crore in October 2023, which is the second highest since its inception (Chart III.21). Gross GST collections for April-October 2023-24 at ₹11.6 lakh crore was 11.4 per cent higher than a year ago (₹10.5 lakh crore). During H1:2023-24, States’ GFD10 stood at 39.7 per cent of BE, higher than in the previous year (Chart III.22a) due to a slower growth in revenue receipts vis-à-vis revenue expenditure (Chart III.22b). Within revenue receipts, growth in tax and non-tax revenues moderated mainly on account of a high base. The grants from the Centre contracted due to the cessation of GST compensation to States and tapering of finance commission grants (Chart III.23a). The thrust on capital spending by States has continued, with a 47.4 per cent growth in capital expenditure on the back of the Union Government’s Scheme for Special Assistance to States for Capital Investment. As of end-October, 2023, the Union government had approved expenditure amounting to ₹96,206 crore (accounting for 74 per cent of the ₹1.3 lakh crore budgeted for 2023-24), out of which ₹58,494 crore has already been disbursed to the States. The focus on capex has improved the quality of expenditure of the States (Chart III.23b). Aggregate Supply The final estimates (FE) of crop production for 2022-23 stood at 329.7 million tonnes, recording a 4.5 per cent increase over its level in the previous year (Chart III.24a). The second advance estimate (AE) of horticultural production at 351.9 million tonnes for 2022-23 was 1.4 per cent higher than 2021-22 (FE), driven by higher production of fruits and vegetables (Chart III.24b).
The first AE11 of the kharif production for 2023-24 at 148.6 million tonnes was 4.6 per cent lower than the FE for 2022-23 (Chart III.25). The decline was largest in the case of oilseeds and pulses. 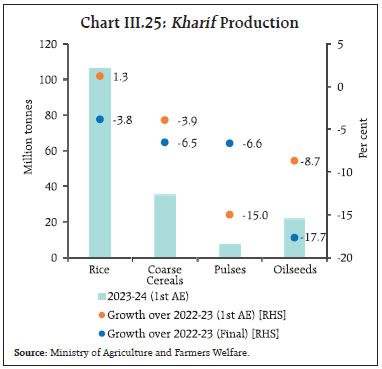 Reflecting the possible impact of the prevailing El Nino conditions in spite of positive Indian Ocean Dipole conditions, the cumulative north-east monsoon rainfall during October 01-November 10, 2023 was 26 per cent below long period average (LPA). Reservoir levels were 8.3 per cent lower than the decadal average (as of November 09, 2023). Notwithstanding these headwinds, the sowing of rabi crops has commenced, and 189.3 lakh hectares12 has been covered (as of November 10, 2023). The overall acreage has declined by 2.1 per cent (y-o-y), even though the acreage recorded under lentil, jowar, field pea, rapeseed and mustard has been higher than the previous year (Chart III.26a). Minimum support prices (MSP) for the rabi marketing season (RMS) [April 2024 to March 2025] were increased in the range of 2.0 per cent (for gram) to 7.1 per cent (for wheat and lentil) [Chart III.26b]. The MSP increase announced for wheat was the highest since the RMS of 2013-14. The headline PMI for the manufacturing sector moderated to 55.5 in October 2023 from 57.5 a month ago on the back of lower new orders and output (Chart III.27a). The PMI for services declined to 58.4 in October, recording the slowest rate of expansion since March, and future activity recorded some slowing (Chart III.27b). Various indicators of transport activity point towards a gathering pace of activity. Cargo traffic at major ports recorded a growth of 18.7 per cent (y-o-y) in October 2023, driven by increased freight traffic of iron ore and coking coal (Chart III.28a). A pick-up in freight movement of containerised cargo and coal also resulted in a higher railway freight revenue growth in y-o-y terms (Chart III.28b). Coincident indicators of the construction sector remained robust in October, with steel consumption increasing by 13.8 per cent (y-o-y). Even though cement production recorded a sequential moderation, it continued to grow by 4.7 per cent (y-o-y) in September 2023 (Chart III.29).
High frequency indicators for the services sector remained robust in October 2023, led by festival demand. Higher y-o-y growth in E-way bills, railway freight, port cargo traffic and air cargo endorsed the uptick (Table III.1). Regarding regional policy initiatives, Delhi’s Motor Vehicle Aggregator and Delivery Service Provider Scheme 2023 seeks to make a time-bound transition of commercial vehicle fleets to zero-emission EVs. Haryana’s Ex-Situ Management of Paddy Straw Policy 2023 seeks to harness paddy straw for sustainable energy and eliminate crop residue burning. To boost tourism, Goa has launched a homestay bed and breakfast (B&B) policy to enhance tourism in the State’s hinterlands.
Inflation Headline inflation, as measured by y-o-y changes in the all-India consumer price index (CPI)13, moderated to 4.9 per cent in October 2023 from 5.0 per cent in September (Chart III.30). The 15 bps softening in inflation came from a favourable base effect of 80 bps which more than offset the positive price momentum of 65 bps during the month. All the three major groups recorded positive momentum with a m-o-m increase of around 95 bps in food prices, 28 bps in fuel prices, and 40 bps in the core group (i.e., excluding food and fuel). Food inflation (y-o-y) dipped to 6.2 per cent in October from 6.3 per cent in September. In terms of sub-groups, inflation in cereals, meat and fish, milk, vegetables, spices, non-alcoholic beverages, and prepared meals softened, while it edged up in eggs, fruits, pulses and sugar. Edible oils remained in deflation (Chart III.31). Deflation in the fuel and light group deepened to (-) 0.4 per cent in October from (-) 0.1 per cent in September, mainly driven by softening of y-o-y growth in prices of electricity and other cooking fuel. Deflation in LPG and kerosene prices continued in October.
Core inflation moderated to 4.3 per cent in October from 4.5 per cent in September. While inflation in clothing and footwear, housing, household goods and services, transportation and communication, education and personal care and effects moderated, it remained steady in pan, tobacco and intoxicants, health, recreation and amusement (Chart III.32). In terms of regional distribution, rural inflation at 5.12 per cent was higher than urban inflation at 4.62 per cent in October 2023. Majority of the states registered inflation in the range of 4-6 per cent. Haryana, Odisha, and Rajasthan experienced inflation between 6 to 8 per cent (Chart III.33). High frequency food price data for November (up to 13th) indicate that cereal and pulse prices have increased further, while edible oil prices continued to decline (Chart III.34). Amongst key vegetables, a sharp increase was observed in onion prices, with tomato prices also showing some firming up. Potato prices remained largely stable. Onion prices have picked up in the latter fortnight of October due to incidences of delayed sowing as well as crop damages in major producing states along with increased demand during the festival season (Chart III.35). In order to contain these prices, the Government has imposed a minimum export price at US$800 per tonne (around ₹67 per kg) valid from October 29 till the end of the year.14 The fresh arrival of kharif onions to be harvested in November could also augment supply. Furthermore, release of onion stocks in high price regions and additional procurement (of 2 lakh tonnes) have also been started to keep prices under control.
Retail selling prices of petrol and diesel in the four major metros remained steady in November (up to 13th). Kerosene prices recorded a moderate decline in November so far, reversing the upward trend observed over the past four months. LPG prices were kept unchanged in October and November (Table III.2). 
| Table III.2: Petroleum Products Prices | | Item | Unit | Domestic Prices | Month-over-month (per cent) | | Nov-22 | Oct-23 | Nov-23^ | Oct-23 | Nov-23^ | | Petrol | ₹/litre | 102.92 | 102.92 | 102.92 | 0.0 | 0.0 | | Diesel | ₹/litre | 92.72 | 92.72 | 92.72 | 0.0 | 0.0 | | Kerosene (subsidised) | ₹/litre | 59.38 | 57.95 | 55.21 | 5.6 | -4.7 | | LPG (non-subsidised) | ₹/cylinder | 1063.25 | 913.25 | 913.25 | 0.0 | 0.0 | ^: For the period November 1-13, 2023.
Note: Other than kerosene, prices represent the average Indian Oil Corporation Limited (IOCL) prices in four major metros (Delhi, Kolkata, Mumbai and Chennai). For kerosene, prices denote the average of the subsidised prices in Kolkata, Mumbai and Chennai.
Sources: IOCL; Petroleum Planning and Analysis Cell (PPAC); and RBI staff estimates. | The PMIs for October 2023 indicated a moderate uptick in input costs across manufacturing and services. The rate of expansion in selling prices, on the other hand, moderated in the manufacturing sector while it increased in the services sector (Chart III.36). IV. Financial Conditions The build-up in government cash balances in the wake of higher GST collections15 led to a drain of liquidity from the system in October. Subsequent government spending in the beginning of November ameliorated pressures, which was somewhat offset by festive related expansion in currency in circulation. Accordingly, banks took recourse to the marginal standing facility (MSF), which averaged ₹1.1 lakh crore during October 16 – November 14, 2023 as against ₹1.3 lakh crore during September 16 – October 15, 2023. The average total absorption under the liquidity adjustment facility (LAF) moderated to ₹0.7 lakh crore during October 16 – November 14, 2023 from ₹0.8 lakh crore during September 16 to mid-October, with nearly all of the funds being placed under the standing deposit facility (SDF) [Chart IV.1]. Large placement of funds under the SDF alongside simultaneous recourse to the MSF is symptomatic of skewed liquidity distribution in the banking system. 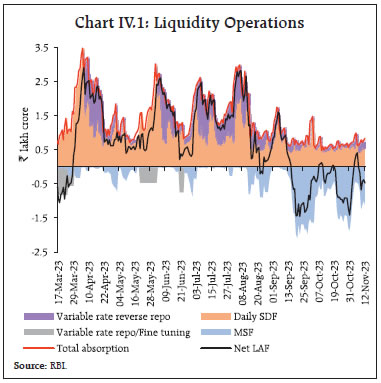 On a net basis, the Reserve Bank injected liquidity averaging about ₹0.5 lakh crore under the LAF during October 16 – November 14, 2023. Reflecting these developments, overnight money market rates — the weighted average call rate (WACR); the triparty repo rate; and market repo rate —hovered close to the ceiling of the LAF corridor (Chart IV.2a). In the term money segment, the yield increased gradually across 3-month treasury bills (T-bills), 3-month certificates of deposit (CDs), and commercial paper (CP) for non-banking financial companies (NBFCs) [Chart IV.2b]. In the primary market, fund mobilisation through issuances of CDs remained robust at ₹3.9 lakh crore during 2023-24 (up to November 3) higher than ₹3.6 lakh crore a year ago, in response to sustained demand for credit. Banks’ reliance on the issuance of CDs has increased after a brief hiatus to bridge the gap between credit offtake and deposit growth (Chart IV.3). CP issuances at ₹7.8 lakh crore (up to October 31) were also robust, albeit marginally lower than ₹8.1 lakh crore during the same period a year ago. Tracking movements in the US treasury yield16, the domestic 10 year G-sec benchmark yield softened to 7.29 per cent on November 13, from a high of 7.38 per cent on October 23 (Chart IV.4a). The yield curve has largely remained flat despite the heavy borrowing calendar, reflecting strong demand for long term bonds (Chart IV.4b). In the primary market, the auction of the debut 50-year G-sec on November 3 saw strong market interest enabling the Government to raise ₹10,000 crore at a cut-off yield of 7.46 per cent.
Corporate bond yields and associated risk premia generally increased during the second half of October to early November 2023 (Table IV.1). Overall, corporate bond issuances during 2023-24 (up to September) were higher at ₹3.9 lakh crore as compared with ₹2.8 lakh crore a year ago.
| Table IV.1: Financial Markets - Rates and Spread | | Instrument | Interest Rates (per cent) | Spread (basis points) (Over Corresponding Risk-free Rate) | | Sept 18, 2023 – Oct 13, 2023 | Oct 16, 2023 – Nov 9, 2023 | Variation | Sept 18, 2023 – Oct 13, 2023 | Oct 16, 2023 – Nov 9, 2023 | Variation | | 1 | 2 | 3 | (4 = 3-2) | 5 | 6 | (7 = 6-5) | | Corporate Bonds | | | | | | | | (i) AAA (1-year) | 7.73 | 7.80 | 7 | 52 | 54 | 2 | | (ii) AAA (3-year) | 7.83 | 8.03 | 20 | 43 | 57 | 14 | | (iii) AAA (5-year) | 7.76 | 7.84 | 8 | 35 | 37 | 2 | | (iv) AA (3-year) | 8.47 | 8.64 | 12 | 106 | 118 | 12 | | (v) BBB-(3-year) | 12.17 | 12.31 | 14 | 476 | 484 | 8 | Note: Yields and spreads are computed as monthly averages.
Sources: FIMMDA; and Bloomberg. | Reserve money (RM), excluding the first-round impact of change in the cash reserve ratio (CRR), recorded a growth of 7.0 per cent (y-o-y) as on November 10, 2023 (8.5 per cent a year ago) [Chart IV.5]. Growth of currency in circulation (CiC), the largest component of RM, decelerated to 4.3 per cent from 7.7 per cent a year ago, reflecting the withdrawal of ₹2000 banknotes.17 As on November 3, money supply (M3) grew by 11.0 per cent (y-o-y) as against 7.8 per cent a year ago (excluding the impact of the merger of HDFC with HDFC Bank with effect from July 1, 2023). Aggregate deposits, the largest component of M3, increased by 12.2 per cent (7.8 per cent a year ago). The growth of scheduled commercial banks’ (SCBs’) deposits, which had increased in the wake of the withdrawal of ₹2000 banknotes, has now stabilised. SCBs’ credit accelerated from 14.7 per cent in early October to 15.9 per cent as on November 3 (Chart IV.6 and IV.7). SCBs mobilised much higher financial resources during H1:2023-24 than a year ago. Funds mobilised through all major sources (deposits, borrowings, and capital & reserves) registered strong growth. SCBs’ incremental credit and investment also increased in tandem (Chart IV.8).
In response to the cumulative 250 bps hike in policy rate since May 2022, banks have revised their repo-linked external benchmark-based lending rates (EBLRs) upward by the same magnitude. The 1-year median MCLR increased by 152 bps during May 2022 to October 2023. The weighted average lending rates (WALRs) on fresh and outstanding loans of SCBs increased by 187 bps and 111 bps, respectively, during May 2022 – September 2023. On the deposit side, the weighted average domestic term deposit rates (WADTDRs) on fresh and outstanding rupee deposits increased by 229 bps and 166 bps, respectively (Chart IV.9).
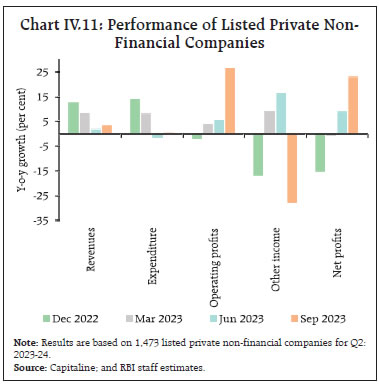
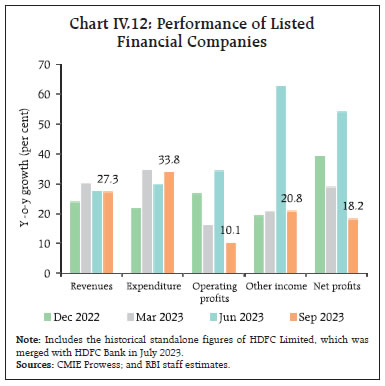
The increase in the WADTDR on fresh and outstanding rupee deposits and WALR on fresh rupee loans were higher for public sector banks than for private banks, while the WALR on outstanding loans was higher for private banks (Chart IV.10). Indian listed private non-financial companies18 witnessed a pick-up in revenue growth (y-o-y) alongside flat expenditure growth during Q2:2023-24, leading to an uptick in operating profits (Chart IV.11). The banking and financial sector reported yet another quarter of resilient performance19, as alluded to in this article’s introduction (Chart IV.12). In line with their global counterparts, Indian equities declined in the second half of October 2023 amid rising geopolitical tensions in the Middle East and elevated US Treasury yields. Overall, the BSE Sensex declined by 3 per cent during October (Chart IV.13). During November (up to 12th), the BSE Sensex increased by 2.2 per cent to close at 65,259, buoyed by robust auto sales and GST collections data, unchanged US Fed policy rates, and positive global cues. 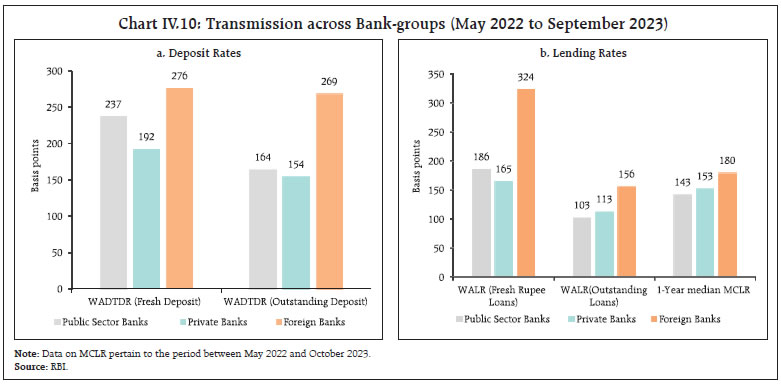
 The broader market indices, as measured by the BSE Midcap and BSE Smallcap index, declined by 3.4 per cent and 1.7 per cent, respectively, in October 2023. They also witnessed greater volatility in comparison with the benchmark. Individual investors’ direct allocation to midcap and smallcap companies roughly account for over two-fifths20 of their overall direct investments in listed companies in India. Besides, the assets under management of midcap and smallcap mutual fund schemes account for over 20 per cent of equity-oriented mutual fund schemes. Empirical evidence suggests that flows into midcap and smallcap mutual fund schemes exert a positive influence on the returns of midcap and smallcap companies (Box 1). 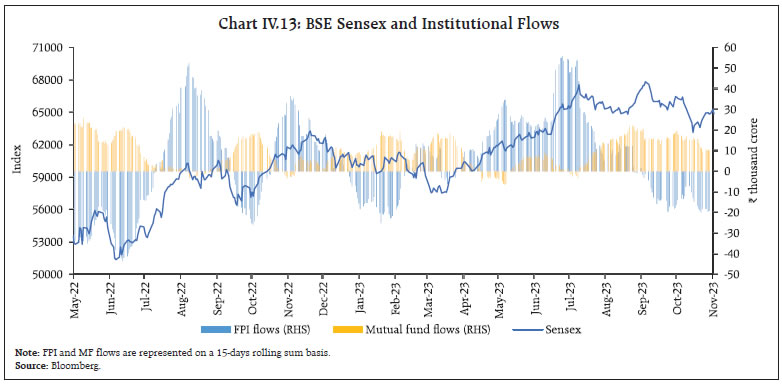 Macroeconomic uncertainty – as measured from the responses of the survey of professional forecasters (SPF)21 – shows a correlation of about 0.5 with the Nifty VIX – volatility index based on Nifty index option prices (Chart IV.14). Historically, uncertainty was high in the post-GFC (global financial crisis) period till 2013-14 but declined thereafter and remained subdued with the adoption of the flexible inflation targeting (FIT) framework in India, till 2019-20. A subsequent rise in uncertainty induced by the COVID-19 pandemic in 2020 ebbed in 2022 and has continued to decline since then. Gross inward foreign direct investment (FDI) moderated to US$ 33.1 billion during April-September 2023 from US$ 39.4 billion during the same period a year ago (Chart IV.15a). More than half of the FDI equity flows were directed towards manufacturing, financial services, transport and computer services. 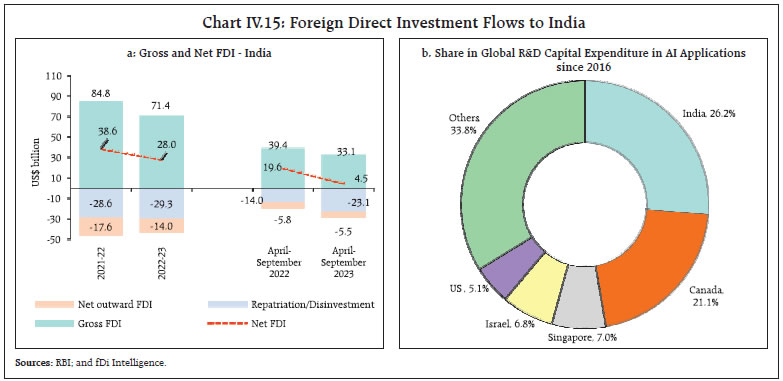 The moderation in flows were majorly witnessed in communication services, retail and wholesale trade and manufacturing sectors. Singapore, Mauritius, Japan, the US and Netherlands were the major source countries, contributing more than two-thirds of the FDI equity flows. Net FDI declined to US$ 4.5 billion during April-September 2023 from US$ 19.6 billion a year ago due to a moderation in gross FDI and a rise in repatriation. Artificial intelligence (AI) has emerged as a major area of interest for FDI investors. Of the 778 projects (total worth of US$ 26.8 billion) related to R&D of Al applications announced globally since 2016, India received the maximum share (26.2 per cent), followed by Canada, Singapore, Israel, and the US (Chart IV.15b).22 Foreign portfolio investors (FPIs) remained net sellers in domestic financial markets in October 2023, with net outflows to the tune of US$ 1.9 billion, led by the equity segment (Chart IV.16a). Financial services recorded the highest FPI outflows, followed by information technology and oil, gas and consumable fuels during the month. EMEs, in general, witnessed outflow pressures in October (Chart IV.16b). FPIs turned net buyers after two months in November 2023 (up to 9th), with a net inflow of US$ 0.1 billion due to inflows in the debt segment (US$ 0.8 billion). Net accretions to non-resident deposits rose to US$ 5.4 billion during April-September 2023 as compared with US$ 2.8 billion a year ago, mainly due to a rise in net accretions to Foreign Currency Non-Resident [FCNR(B)] accounts. External commercial borrowing (ECB) registrations moderated (US$ 8.0 billion) in Q2:2023-24 from a record (US$ 21.0 billion) in the previous quarter. Gross disbursement of ECBs to India at US$ 20.5 billion during H1:2023-24 were nearly double those of US$10.8 billion a year ago (Chart IV.17). More than half of the new ECBs raised during H1:2023-24 were earmarked for capital expenditure (Chart IV.18).
Almost three-fourth of registered ECBs during H1:2023-24 was effectively hedged in terms of explicit hedging, rupee-denominated loans and loans from foreign parents, which considerably offsets the interest and exchange rate sensitivity of such exposures (Chart IV.19). Tighter global monetary conditions led to elevated global benchmark interest rates, such as the secured overnight financing rate (SOFR), which resulted in a rise in the overall cost of ECBs raised during H1:2023-24. The weighted average interest margin (WAIM) over the benchmark rates, however, moderated to 146 bps during H1:2023-24 from 177 bps a year ago due to large value loans by big corporates (Chart IV.20). However, the increase in share of small value loans pushed the WAIM to 182 bps in September from 130 bps in August 2023.
The foreign exchange reserves stood at US$ 590.8 billion on November 3, 2023 covering about 10 months’ of imports projected for 2023-24 (94 per cent of total external debt outstanding at end-June 2023) [Chart IV.21a]. India’s foreign exchange reserves have increased by US$ 28.1 billion during the calendar year 2023 so far, which is the highest among major foreign exchange reserves holding countries (Chart IV.21b).
The Indian rupee (INR) depreciated by 0.2 per cent (m-o-m) vis-à-vis the US dollar in October 2023 as most EMEs witnessed pressures from capital outflows (Chart IV.22). The INR, however, remained as one of the least volatile major currencies during the month. In terms of the 40-currency real effective exchange rate (REER), the INR appreciated by 1.0 per cent (m-o-m) in October 2023 (Chart IV.23).
Payment Systems Buoyed by the festival season, digital payments witnessed a strong expansion in October 2023, with growth (y-o-y) under major payment modes outpacing the increase in the previous month (Table IV.2). The Unified Payments Interface (UPI) added another billion to reach 11 billion transactions in a short span of two months, the quickest addition of a billion, to date. The Initial Public Offering (IPO) facility through UPI exhibited robust adoption, with the number of mandates nearly doubling in October 2023 over the corresponding month in 2022. Credit cards continued their ascent, supported by cashbacks, reward points, contactless cards, and UPI-linked credit cards.23 The extension of the Bharat Bill Payment System (BBPS) to business-to-business (B2B) payments24 is expected to bolster its usage. To foster an orderly development of the cross-border payments domain, the Reserve Bank has decided to regulate entities involved in payment and settlement for cross-border export/import transactions, designating them as “Payment Aggregators – Cross Border (PA-CB)” under the Payment and Settlement Systems Act, 2007. Further, to encourage innovation, the Reserve Bank has introduced the fifth cohort (theme-neutral) under the Regulatory Sandbox (RS), along with the successful exit of all entities from the third RS cohort focused on ‘MSME Lending’. Consistent policy support and the expanding digital payment landscape are anticipated to significantly reduce reliance on usage of cash in the coming years. Most of the growth in digital payments is expected in consumer-to-business payments, followed by consumer-to-consumer and business-to-business transactions.25 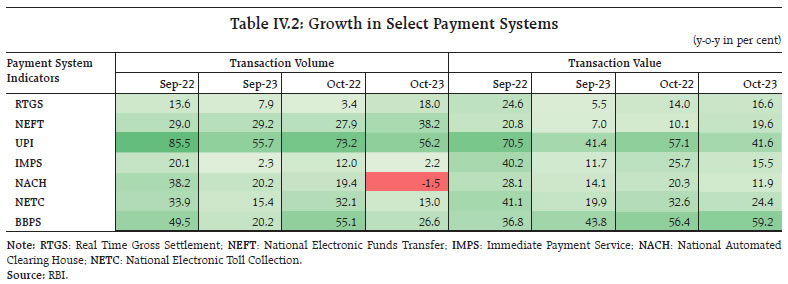
Box 1: Relationship Between Mutual Fund Flows and Broader Market Performance In the equity market, the broad market indices have performed well in 2023-24 so far, with the smallcap and midcap mutual fund (MF) schemes, accounting for almost half of the net inflows into open-ended equity-oriented schemes (Chart IV.B). A surge in inflows through MFs has even created deployment challenges for fund managers, prompting a few fund houses to decline fresh lumpsum investments in these schemes.26 Some financial analysts have identified equity mutual fund flows as a driving force in the sustained run-up in markets.27 Multiple channels link flows from MFs with market returns. The feedback-trader hypothesis holds that investors buy fund shares as a response to rising prices and sell when prices fall, thereby causing a positive co-movement. Under the price-pressure hypothesis, flows cause returns. According to the information-response hypothesis, both stock market returns and fund flows react to new information. It shows that mutual fund flows are forward looking (Warther, 1995; Jank, 2012). Granger causality tests between flows and returns in the midcap/smallcap segments conducted on monthly data on schemes for the period April 2019 to September 2023 show that one-way causation exists between flows and returns, i.e., past values of flows influence current returns but not vice versa which supports the price pressure hypothesis (Table IV.B). | Table IV.B: Test of Causality Between Flows and Return | | | Flows do not Granger Cause Returns | Returns do not Granger Cause Flows | | F statistic | | I: Midcap | 6.07***
(0.01) | 0.02
(0.89) | | II: Smallcap | 7.70***
(0.00) | 1.42
(0.23) | Notes: 1. We use a reduced-form bivariate vector autoregressive (VAR) model. Net flows are normalised by the previous month’s net assets under management to control for the rising trend in flows (Remolona et. al, 1997). Specifically, excess midcap/smallcap returns are calculated as monthly returns on the midcap/ smallcap index minus the annualized three-month T-bill return (Edward and Zhang, 1998). All the series used are stationary.
2. P values are reported in parentheses. * P<.1; **P<.05; ***P<.01.
Source: RBI staff estimates. | References: Edwards, F. R., & Zhang, X. (1998). Mutual funds and stock and bond market stability. Journal of Financial Services Research, 13(3), 257-282. Jank, S. (2012). Mutual fund flows, expected returns, and the real economy. Journal of Banking & Finance, 36(11), 3060-3070. Remolona, E. M., Kleiman, P., & Gruenstein Bocain, D. (1997). Market returns and mutual fund flows. Economic Policy Review, 3(2), 33-52. Warther, V.A. (1995). “Aggregate mutual fund flows and security returns”, Journal of Financial Economics, 39(2-3), 209-235. | Conclusion This 37th edition of the State of the Economy (SoE) article marks the third year of its revival after a long hiatus of 25 years. As we noted in the 25th edition, this article was born in dark times when the pandemic had engulfed the nation. Since the 25th edition in November 2022, this article has been a sentinel to several noteworthy developments. A combination of monetary policy action and supply side interventions guided inflation down from the high reaches to which it had climbed through the first seven months of 2022-23; in fact, November 2022 was the first month when headline inflation dropped back into the RBI’s tolerance band in the whole calendar year. We are not out of the woods yet and have miles to go, but readings of around 5 per cent and 4.9 per cent in September and October, respectively, are a welcome relief from the average of 6.7 per cent in 2022-23 and 7.1 per cent in July-August 2023. India’s external sector has remained viable, with a modest current account deficit (CAD) financed by resilient capital flows, one of the least volatile currencies in the world and a healthy level of foreign exchange reserves. The momentum of growth has picked up, taking GDP well above pre-pandemic levels to becoming the fifth largest economy in the world at market exchange rates. Steadfast policy initiatives are showing results, with the financial sector exhibiting soundness and supporting the credit needs of a resurgent economy. In the payments space, India has made significant strides while offering its digital public infrastructure to the world. This period also witnessed India assuming the presidency of the G20. India’s priorities and deliverables as well as achievements contributed to global public welfare and left a rich legacy of further actionable issues that would help bind the world into one family. The State of the Economy has witnessed the ups and downs of this passage. We decided against many odds that we would try to infuse the light and hope of facts into our readership through difficult challenges that confronted the Indian economy on this journey. We have been both praised and pilloried for our efforts. Yet, as Governor Shri Shaktikanta Das remarked while accepting the Changemaker of the Year award on behalf of the RBI, “It was necessary to give confidence to the markets and the people”. He went on to quote Mahatma Gandhi: When the horizon is dark, it is faith that keeps you going.
|