by Joice John, Bhimappa A. Talwar, Priyanka Sachdeva and Indranil Bhattacharyya^ In a forward-looking monetary policy framework, central banks closely monitor market expectations on the evolving economic outlook as well as on future policy actions. This paper explores the methodology of extracting market expectations on the policy rate from the 2-month Overnight Index Swaps (OIS) rate and finds it effective in decoding near term market expectations. During 2016-2023, monetary policy surprises have been rare suggesting that the RBI’s communication strategy has been successful in anchoring market expectations. Our findings indicate that such policy surprises have an instantaneous impact on interest rates of longer maturities across money and bond markets on the policy day. Introduction In a forward-looking and market-based monetary policy framework, expectations about the future in addition to current economic conditions largely influence the decision making of economic agents viz., the public, market participants and all stakeholders. Since expectations on the economic outlook govern saving and investment decisions in the economy that generate business cycles, monetary authorities – in their stabilisation role – closely monitor market expectations on evolving economic activity as well as on future policy actions. One of the key indicators for monetary policy formulation is the market expectation on the central bank’s policy rate, which reveals useful information about the market’s assessment of current economic developments and its perceptions about the future. Expectations of the future policy rate – including its timing and pace of change – are an important driver of financial asset prices and cost of credit to the wider economy, thus playing a significant role in monetary policy transmission. It is in this context that forward guidance has gained prominence in the communication strategy of central banks to anchor market expectations on future policy rates (Woodford, 2005). Prescient decoding of market expectations on the policy rate can avoid undue financial market volatility that ensues when expectations significantly differ from central bank actions. Unexpected movement in the federal funds rate (FFR) is found to be a key driver of treasury yields (Kuttner, 2001) and stock prices (Bernanke and Kuttner, 2005). Policy rate expectations can also be a key input for the central bank’s projection of growth and inflation. The related literature and cross-country practices suggest that financial market instruments (futures and swaps), surveys and empirical models are the commonly used methods for extracting market expectations. While survey-based measures are directly measurable, subjective, and available with a lag, interest rate expectations embedded in the price of financial instruments are based on financial transactions, information on which are available at a regular frequency. Moreover, high frequency data availability – on a daily or even intra-day basis – for financial indicators enable a more robust identification of monetary policy surprises that are relatively less influenced by other economic news. In contrast, survey or model-based measures are generally available at a lower frequency. Moreover, survey-based measures are highly subjective and suffer from sampling bias while model-based measures rely on certain restrictive assumptions that make them less reliable, particularly during periods of high uncertainty. Nevertheless, it is prudent to use different methods and not be reliant on any single method for drawing policy inputs. Amongst financial market instruments, the closest possible direct measure of expected future policy rates is the interest rate futures, which incorporate expectations of interest rates and are closely linked to the policy rate over the short to medium term horizon. The fed fund futures (FFFs) have been widely used as a measure of monetary policy expectations in the US (Krueger and Kuttner, 1996). For countries without similar interest rate hedging instruments, expectation is measured from the price of the instrument that moves along with the policy rate, e.g., Treasury Bills, unsecured interbank loan, and forward rate agreements (FRAs) (Joyce et al., 2008). Nevertheless, measuring expectations from such instruments is rendered complex because of additional factors that contribute to pricing, such as credit risk, liquidity risk, and term premium. In view of the above, the search for an alternative measure led to the identification of the overnight indexed swap (OIS) rates as a measure of monetary policy expectations that is more generally comparable across different countries (Lloyd, 2018; 2021). An OIS is an interest rate derivative contract in which two entities agree to swap/exchange a fixed vis-à-vis a floating interest rate payment based on a notional principal amount. As against futures which are standardised instrument traded on exchanges, the OIS is traded over the counter (OTC). While the futures settle against the short-term rate (i.e., overnight rate) on a specific future date, the OIS settles against the path of short-term rate prevailing from the inception of the contract till its maturity. Financial agents primarily use OIS contracts to manage their interest rate exposures through hedging and appropriate arbitrage opportunities. As a risk management tool, OIS inter alia provides various benefits such as (i) reduction in credit risk; (ii) flexibility to move to interest rate basis of choice; (iii) converting fixed rate liability into floating or vice versa; and (iv) managing duration of investment portfolio. Subsequent research has proliferated the use of OIS to measure market expectations on the policy rate. In the Indian context, a recent study using Lloyd’s methodology (2018) found that OIS rates of select maturities provide credible measures of market expectations on the future path of the policy rate (Rituraj and Kumar, 2019). We build on this study on several counts. First, we use the 2-month OIS rate, given the bi-monthly policy cycle in India, to gauge only the near-term policy expectations (till the next policy) rather than the long term, focusing on the more recent period (2016-23). Second, while Rituraj and Kumar (op cit.) use the number of calendar days between the inception of the contract till its maturity for calculating the value of the floating leg, this paper estimates the floating leg based on the number of business days (accounting for the holidays in between), which may be more appropriate. Third, using an event study (ES) approach, we empirically evaluate the role of market expectation and policy surprises in determining the immediate impact of policy changes on the money and bond markets in India on the policy day, which helps in identifying how market participants adjust their expectations after a policy announcement. The remaining part of the paper is structured in the following manner: Section II provides a brief snapshot of the relevant literature while the stylised features of the OIS market are discussed in Section III. The empirical methodology, results and implications are presented in Section IV while Section V concludes. II. Related Literature The FFFs is a prime measure of monetary policy expectations in the US which is widely used in the literature (Krueger and Kuttner, 1996; Kuttner, 2001; Faust, Swanson and Wright, 2004; Sack, 2004; Piazzesi and Swanson, 2008; Hamilton and Okimoto, 2011). While comparing the performance of various market-based instruments in the US – including FFFs and Eurodollar futures – as predictors of the future monetary policy stance, it was found that the FFFs predict monetary policy better in horizons up to six months (Gurkaynak et al., 2007). The absence of similar instruments, however, motivated the search for comparable measures in many countries. Using OIS rates as an alternative measure that can be used outside the US and which is more generally comparable across different countries, it was found that one to12-month US OIS rates provide measures of investors’ interest rate expectations that are comparable to that of FFFs (Lloyd, 2018; 2021). Additionally, 1 to 24-month US, euro-zone and Japanese OIS rates and one to 18-month UK OIS rates were found to accurately measure expectations on future short-term interest rates in these countries. The use of OIS contracts as measures of investors’ interest rate expectations offers various advantages.1 First, counterparty risk is minimal in OIS contracts since it involves only an exchange of interest and not notional principal amounts, although such risks along with the risk premia are likely to increase in times of stress (Finlay and Olivan, 2012). Second, OIS contracts do not involve any initial cash flow and only the net payments are exchanged, thus minimising liquidity risk. Taking cognizance of these important features, several studies have used OIS rates to decipher market expectations on future monetary policy (Christensen and Rudebusch, 2012; Woodford, 2012; Kamber and Mohanty, 2018; Altavilla et al., 2019; Lloyd, 2021). As mentioned before, it was found that OIS rates of 1-, 9- and 12-months tenors provide credible measures of market expectations on the future path of the policy rate in the Indian context during normal times (Rituraj and Kumar, op cit). Moreover, unanticipated changes in monetary policy during the global financial crisis (GFC) of 2008 and the taper tantrum of 2013 were found to have a substantial bearing on ‘excess returns’ in the OIS market, unlike normal times. In the same spirit, several recent studies have used excess return derived from OIS rates as a proxy for monetary policy surprises. After controlling for the surprise component of monetary policy changes as reflected in Indian OIS rates, a text-mining analysis of the monetary policy statements of the Reserve Bank of India (RBI) found significant improvement in policy communication since the advent of the inflation targeting regime (Mathur and Sengupta, 2019). Using the 1-month OIS rate to delineate the expected and unexpected components of monetary policy announcements, an ES analysis around announcement days found that Indian G-sec yields generally react to monetary policy surprises (Das et al., 2020). Monetary policy surprises derived from OIS rates are found to significantly impact the stocks of banking, financial services, and the realty sectors (Prabu et al., 2020). Maturity-wise changes in OIS rates in a narrow window around the RBI’s monetary policy announcements are used to capture the unexpected (surprise) component of policy decisions, which are complemented with narrative analysis to investigate the reliability of OIS rates in inferring market expectations (Lakdawala and Sengupta, 2021). Using changes in OIS rates (1-month) as a proxy for monetary policy surprises alongside other short-term OIS rates and longer-term treasury securities, it was found that monetary policy surprises have a positive and statistically significant impact on yields of Indian government and corporate bonds (Ahmed et al., 2022). III. OIS Market in India: Stylised Facts As mentioned earlier, an OIS is an interest rate derivative contract in which two parties agree to swap/exchange a fixed interest rate payment (the OIS rate) vis-à-vis a floating interest rate payment over the tenor of the contract. In an OIS contract, the floating leg interest payment is derived by calculating the accrued interest payments from a strategy of investing the notional principal in a reference rate and repeating this on an overnight basis for the duration of the contract, reinvesting principal plus interest continuously. The floating rate is usually the overnight (unsecured) interbank rate and the reference rate for OIS contracts in India is the Mumbai Interbank Offered Rate (MIBOR). On the other hand, the OIS rate represents the contract’s fixed rate which contains market participants’ expectations about future overnight rates. The notional principal is used to calculate interest payments but is not exchanged; it is only the interest payments that are exchanged at pre-determined intervals over the tenor of the contract, i.e, if the fixed interest rate payment exceeds that of the floating rate, the agent who took on the former payments must pay the other at settlement. More simply, an investor who has taken a long position in an OIS contract will receive payments based on a fixed swap rate and make payments based on the overnight rate that is realised over the contract’s maturity (Figure 1). 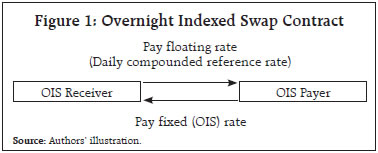 III.1 Evolution Interest rate derivatives (IRDs), which are traded either on organised exchanges or on OTC markets, were permitted in India in July 1999. Within IRD, interest rate swaps (IRS) – which involve swapping of interest rate payments based on notional principal – have the largest market share. Currently, the trading in IRS is dominated by MIBOR-OIS with the MIBOR as the floating interest rate, followed by the Mumbai Inter-bank Forward Offer Rate (MIFOR) counterpart. In the MIBOR segment, the daily average value of transactions, although lower than the levels prior to the GFC, have increased considerably since COVID-19 (Chart 1a), while the outstanding value of transactions has more than doubled since 2020-21 (Chart 1b). Across tenors, the trading is primarily concentrated in 1-year, 2-year, and 5-year maturity segments, with the short-term segment (up to 1 year) comprising more than 50 per cent of total trade (Chart 1c). Market share is dominated by foreign banks followed by primary dealers and private sector banks (Chart 1d). Despite their large interest rate exposure, the participation of nationalised banks in the IRS markets remains thin. In this regard, as the balance sheet of nationalised banks becomes more market linked, particularly in the wake of the adoption of external benchmarks lending rate (EBLR), their demand for hedging is expected to increase, thus contributing further to the development of the IRD market (Acharya, 2020). The share of nationalised banks has improved from 0.5 per cent in April 2020 to 5.9 per cent in April 2023. III.2 OIS rates and Monetary Policy Expectations The no-arbitrage condition requires that the fixed leg of an OIS contract should be equal to the expected overnight rates compounded daily for the period of the contract, plus a term premium. Therefore, if overnight rates are expected to increase (decrease) during the period of the contract, the OIS rate should consequently move up (down). This feature of the OIS is useful in identifying the “surprise” component of any policy announcement that can affect money market rates. 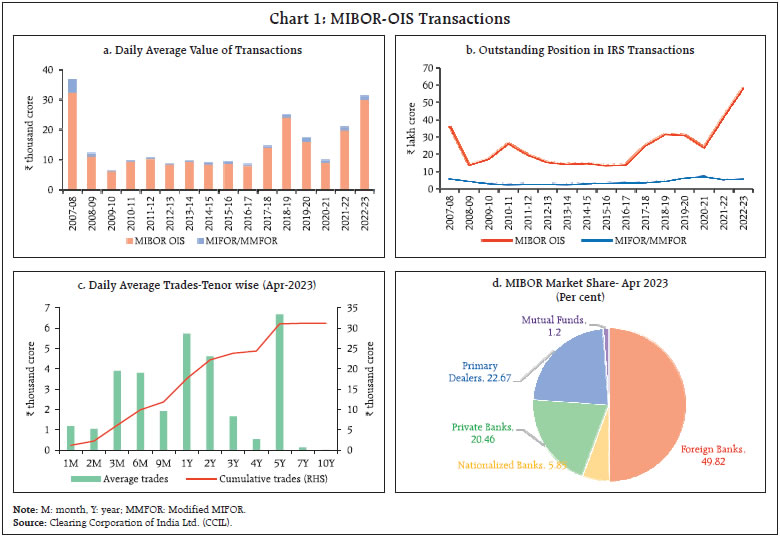 In the context of extracting market expectations, the positioning in the OIS market is based on expectations about the future direction of policy interest rates since overnight MIBOR is traded based on the inter-bank call money rate – the operating target of monetary policy. For instance, market participants expecting an increase in interest rate may choose an OIS contract where they pay the fixed rate and receive the actual (floating) rate over the period of the swap. In this sense, the OIS rates can be used to decipher market expectations of monetary policy. As mentioned before, the liquidity premia and counterparty risks are minimal in an OIS contract; therefore, if the excess return, i.e., the difference between the fixed and the floating leg is, on an average, zero, then the OIS can provide a robust measure of investors’ expectations of future overnight interest rates over the horizon of the contract. The OIS rates start moderating (firming up) towards the expected policy rate over the tenure of the contract. For instance, the 2-month OIS rate – tenor similar to the frequency of the monetary policy cycle – gradually eases over the ensuing two months if the market expects a reduction in the policy repo rate in the upcoming monetary policy meeting and vice versa. For India, the 2-month OIS rates seem to capture well the policy easing cycle during February 2019 to May 2020 and the tightening cycle commencing May 2022 (Chart 2). In contrast, OIS rates of longer maturity reflect expectations on the future path of the policy rate (multiple policy cycles) along with the term premia. This is in accordance with the expectation hypothesis of the term structure – interest rates are expected to move in a way that equalises the expected return on short and long-term investment strategies for comparable investment horizons. IV. Empirical Findings Under the expectations’ hypothesis of the term structure of OIS rates, the interest rates on the fixed leg of the contract equals that of the floating leg. This implies that the ex-post realised excess return (as in 2) should have zero mean. In the Indian context, the average excess return of the 2-month OIS rate over the period from 2010 to 2023, controlled for episodes of market turmoil (e.g., taper tantrum) yields zero mean, indicating that the 2-month OIS rate can provide a good measure of expected (anticipated) policy rate in the forthcoming meeting by market participants (RBI, 2023). The changes in the policy rate can be decomposed into  where ΔPR is the actual change in the policy rate, ΔPRsur is the unanticipated change in policy rate derived from excess return4 and ΔPRexp is the anticipated component of policy.5 Based on the above methodology, the excess return is tabulated for all monetary policy announcements since October 2016 – the first Monetary Policy Committee (MPC) meeting – and up to the financial year 2022-23 (Table 1). Only five out of the 40 policy announcements during this period surprised6 the market, viz., (i) October 5, 2018; (ii) March 27, 2020; (iii) February 10, 2022; (iv) May 4, 2022; and (v) September 30, 2022. In the October 2018 policy, the MPC kept the policy rate unchanged contrary to market expectations of a rate hike. There was an element of “surprise” in the MPC’s decision of March 27, 2020 after the outbreak of the COVID-19 pandemic. Given the world-wide turmoil and spike in uncertainty, a significant reduction in the policy rate was widely anticipated by the market but it was surprised by a larger reduction7 – the surprise being about 25 bps. In most of the subsequent policy announcements, market expectations were broadly in sync with policy decisions. While the RBI kept the policy rate unchanged in February 2022 in contrast to some expectation of a rate hike, the off-cycle policy hike of 40 bps in May 2022 took the market by surprise as evident from the negative excess return of 40 bps. While the next two policies (June and August 2022) were on expected lines, the September 2022 MPC decision entailed a surprise element of 15 bps as the market had priced in a hike of 35 bps as against the actual increase of 50 bps. The February 2023 rate hike of 25 bps, however, was fully anticipated by the market. This analysis suggests that the Reserve Bank’s communication has been effective in anchoring market expectations. Supporting the above findings, a recent study found that innovation in monetary policy communication by the Reserve Bank since the implementation of the flexible inflation targeting (FIT) framework, particularly in the post-COVID period, has increased the predictability of monetary policy in India (Ahmed et al., 2022). | Table 1: Average Excess Return Basis points (bps) | | Policy Date | Δ Policy Rate | Excess Return | Policy Date | Δ Policy Rate | Excess Return | | 2016-17 | 2020-21 | | August 09 | 0 | -9 | March 27* | -75 | 24 | | October 04 | -25 | 10 | May 22 | -40 | 0 | | December 07 | 0 | -7 | August 06 | 0 | -7 | | February 08 | 0 | 1 | October 09 | 0 | 12 | | 2017-18 | December 04 | 0 | 8 | | April 06 | 0 | 7 | February 05 | 0 | 4 | | June 07 | 0 | -2 | 2021-22 | | August 02 | -25 | 6 | April 07 | 0 | 3 | | October 04 | 0 | 2 | June 04 | 0 | 5 | | December 06 | 0 | 2 | August 06 | 0 | 6 | | February 07 | 0 | 5 | October 08 | 0 | 4 | | 2018-19 | December 08 | 0 | 7 | | April 05 | 0 | 4 | February 10 | 0 | 17 | | June 06 | 25 | -3 | 2022-23 | | August 01 | 25 | -5 | April 08** | 0 | 0 | | October 05 | 0 | 15 | May 04 | 40 | -40 | | December 05 | 0 | 5 | June 08 | 50 | 2 | | February 07 | -25 | 8 | August 05 | 50 | -1 | | 2019-20 | September 30 | 50 | -15 | | April 04 | -25 | -1 | December 07 | 35 | 12 | | June 06 | -25 | 0 | February 08 | 25 | 0 | | August 07 | -35 | 1 | | | October 04 | -25 | -6 | | December 05 | 0 | -10 | | February 06 | 0 | 5 | Notes: 1. *: There was an additional 15 bps reduction in the reverse repo rate making the LAF corridor asymmetric.
2. **: Corridor width was restored by introducing the Standing Deposit Facility (SDF) at 25 bps below the policy repo rate.
Sources: RBI, and Authors’ estimates. | Having estimated the unanticipated changes in policy actions from excess returns, we next evaluate their instantaneous impact on long-term money and bond market rates. For this purpose, we first look at select policy announcement days that had a surprise element (the five instances mentioned earlier) along with those policy days in which rate changes were announced during the last three years (Table 2). | Table 2: Changes in Interest Rates across Market Segments and Excess Return in Select Episodes (bps) | | Policy Announcement Days | Change in Repo Rate | Excess Return^ | Government Securities (G-sec) | AAA Corporate Bonds (CBs) | Remarks | | 3-Yr | 5-Yr | 10-Yr | 3-Yr | 5-Yr | 10-Yr | | October 5, 2018 | 0 | 15 | -18 | -8 | -11 | -17 | -16 | -12 | No change in policy rate. Excess return was 15 bps - there was some expectation of an increase in overnight rates. The G-sec and CB rates declined by 8-18 basis points. | | March 27, 2020 | -75 | 24 | -6 | 12 | -1 | -26 | -22 | -7 | Policy rate was reduced by 75 bps along with an additional decline of 15 bps on the reverse repo rate (floor of corridor). Apart from these, host of measures were announced: Targeted Long Term Repo Operations (TLTROs), Cash Reserve Ratio (CRR) reduced by 100 bps, banks’ limit for borrowing overnight under the MSF raised to 3 per cent of NDTL from 2 per cent. Excess return was 24 bps – the decline in overnight rates was higher than expected. The G-sec and CB rates declined in the range of 1-25 basis points. | | May 22, 2020 | -40 | 0 | -6 | 0 | 12 | -5 | -7 | -3 | Policy rate cut by 40 bps. Excess return was 0 bps - the decline in policy rate was in line with market expectations. Moderate changes in long term rates across G-sec and CBs. | | February 10, 2022 | 0 | 17 | -2 | -7 | -8 | -15 | -16 | -8 | Policy rate unchanged. Excess return was 17 bps - there was some expectation of an increase in overnight rates. The G-sec and CB rates declined by 2-16 basis points. | | May 4, 2022 | 40 | -40 | 9 | 29 | 24 | 26 | 29 | 32 | Policy rate increased by 40 bps. Excess return was (-) 40 bps - the increase in policy rate completely surprised the market. The G-sec and CB rates increased by 9-29 basis points. | | June 8, 2022 | 50 | 0 | -2 | 3 | -2 | -10 | -8 | -2 | Policy rate increased by 50 bps. Excess return was 0 bps - rate hike in sync with market expectations. The G-sec and CB rates changed only by 2-10 bps. | | September 30, 2022 | 50 | -15 | -6 | 1 | 5 | -8 | 2 | 7 | Policy rate increased by 50 bps. Excess return was (-) 15 bps – increase in policy rate was largely anticipated although 15 bps higher than market expectations. Long term rates across G-sec and CBs showed mixed response. | | December 7, 2022 | 35 | 12 | 0 | 5 | 4 | 4 | 3 | 2 | Policy rate increased by 25 bps. Excess return was 12 bps – policy rate increase was somewhat anticipated but 12 bps lower than market expectations. Long term rates across G-sec and CB markets mostly remained unchanged. | | February 8, 2023 | 25 | 0 | 5 | 7 | 2 | 8 | 6 | 3 | Policy rate increased by 25 bps. Excess return was 0 bps - the increase in policy rate was completely anticipated. The G-sec and CB rates changed by only 2-8 bps. | ^ Excess return is positive when 2-month OIS rate is higher than its floating leg and vice versa. Hence, a positive excess return is equivalent to a negative policy surprise and vice versa.
Sources: RBI; and Authors’ estimates. | Table 2 suggests that changes in longer-term rates have moved broadly in tandem with the changes in excess return. There were, however, some policy days in which other measures were announced simultaneously along with the policy rate, especially in the aftermath of the COVID-19 pandemic. In the wake of these developments, a perfect identification of the impact of a monetary policy surprise on long term interest rates might not be possible as the impact of several other measures would get reflected in the markets’ reaction. In most instances, however, monetary policy related announcement was the sole event on that day; therefore, we adopted an ES methodology in a regression framework in conformity with the recent literature (Ahmed et al., 2022; Bauer and Swenson, 2023). To assess the impact, changes in interest rate/yields on these instruments on all the monetary policy announcement days during August 2016 to February 2023 are regressed (i) on changes in the policy rate (Model 1) and (ii) on the anticipated and surprise components (Model 2). While most studies based on tick-by-tick data of the US and the euro area use a small window (30-minutes) around the policy announcements to capture the immediate announcement effect (Altavilla et al., 2019; Bauer and Swenson, 2023), our analysis is conducted on daily data due to unavailability of intra-day data for some indicators. In line with the recent literature, it is also assumed that the monetary policy announcement is the major event on the policy days having the most pronounced impact on the market (Kapp and Kristiansen, 2021). Since most of the deals in the call money market are traded in the morning hours before the policy announcement and does not fully reflect repo rate changes on the policy day, the changes in the overnight rate – the weighted average call rate (WACR) – is computed as the difference between the call rate a day after the policy announcement (t+1) and a day prior to the announcement (t-1). Given intra-day data availability on government securities, the changes in yields are computed as the difference between the opening and closing rates on the policy announcement day to exclude the impact of overnight changes in global factors viz., US treasury yields, and crude oil prices, which have a significant bearing on G-sec yields. As per available data, changes in T-bill and corporate bond yields are computed on close-close basis i.e., difference between rate prevailing at the end of the monetary policy day (t) and the closing rate of the previous working day (t-1). Accordingly, the estimated impact of changes in the policy rate – along with its anticipated and surprise components – on changes in interest rates of various instruments and maturities across the money and bond markets is presented in Table 3. | Table 3: Monetary Policy Announcement Impact on Market Rates | | | Model 1 | Model 28 | | Variables | Δ Policy | Δ Anticipated | Δ Surprise | | I. Money Market | | Δ WACR | 0.939*** | 0.933*** | 0.967*** | | Δ T-bill 3M | 0.456*** | 0.404*** | 0.551** | | II. G-sec | | Δ G-sec (3-Yr) | 0.114* | 0.065 | 0.375** | | Δ G-sec (5-Yr) | 0.169** | 0.117 | 0.333* | | Δ G-sec(10-Yr) | 0.049 | -0.007 | 0.484** | | III. Corporate Bonds | | Δ AAA CB (3-Yr) | 0.146* | 0.08 | 0.629*** | | Δ AAA CB (5-Yr) | 0.155* | 0.079 | 0.703*** | | Δ AAA CB (10-Yr) | 0.113 | 0.076 | 0.527** | Note: ***, ** and * represent significance at 1 per cent, 5 per cent and 10 per cent, respectively.
Sources: CCIL; Bloomberg; and Authors’ estimates. | As expected, the instantaneous impact of policy rate changes progressively moderates across the term structure. As expected, the extent of instantaneous pass-through is almost unity in the case of the WACR but is more subdued for longer maturities. In the overnight money market, the policy rate changes, irrespective of whether these are anticipated or not, are almost fully passed on immediately. The anticipated policy changes have no significant instantaneous impact on G-sec and corporate bond yields as market participants already incorporate them in their expectations. In these segments, however, policy surprises are found to have a strong and significant contemporaneous impact across maturities – more so in corporate bonds than G-sec – as market participants immediately adjust their expectations after the surprise announcement. The findings are consistent with some recent studies that suggests policy surprises having a positive and statistically significant impact on G-sec and corporate bond yields in the Indian context (Das et al., 2020; Ahmed et al., 2022). V. Conclusion This paper adopts Lloyd’s methodology for extracting market expectations on RBI’s next policy announcement and identifying the surprise element of policy changes from the 2-month OIS rate. Since the formal adoption of FIT (October 2016) and up to 2022-23, policy surprises have been rare and under exceptional circumstances, suggesting that the RBI’s communication have been effective in guiding market expectations. The empirical analysis indicates that policy rate changes have an instantaneous and full impact at the shorter end of the term structure but are muted at the longer end. The anticipated changes in policy rate are found to have no immediate impact on longer term interest rates as those are already factored in by the markets. In contrast, monetary policy surprises have a positive and significant immediate impact across market segments and maturities. Therefore, major central banks abjure from surprising the market through effective communication strategies in normal times, large exogenous shocks can require central banks to take proactive monetary and liquidity actions to maintain domestic macroeconomic stability which can have an element of surprise for the market. As such, policy surprises are used sparingly under exceptional circumstances. Overall, our findings suggest the potency of the 2-month OIS rate in capturing near term market expectations on the policy rate. References Acharya, V. V. (2020). Improving Monetary Transmission Through the Banking Channel: The Case for External Benchmarks in Bank Loans. Vikalpa, 45(1), 32-41. Altavilla, C., Brugnolini, L., Gürkaynak, R. S., Motto, R., & Ragusa, G. (2019). Measuring euro area monetary policy. Journal of Monetary Economics, 108, 162-179. Bauer, M. D., & Swanson, E. T. (2023). A reassessment of monetary policy surprises & high-frequency identification. NBER Macroeconomics Annual, 37(1), 87-155. Bernanke, B. S., & Kuttner, K. N. (2005). What explains the stock market’s reaction to Federal Reserve policy? The Journal of finance, 60(3), 1221-1257. Christensen, J. H., & Rudebusch, G. D. (2012). The response of interest rates to US & UK quantitative easing. The Economic Journal, 122(564), F385-F414. Das, S., Ghosh, S., & Kamate, V. (2020). Monetary Policy & Financial Markets: Twist & Tango. RBI Bulletin, August 2020, Reserve Bank of India, Mumbai, India. Faust, J., Swanson, E. T., & Wright, J. H. (2004). “Identifying VARS Based on High Frequency Futures Data,” Journal of Monetary Economics 51: 1107-1131. Finlay, R., & Olivan, D. (2012). Extracting Information from Financial Market Instruments. RBA Bulletin, March, 45-54. Gürkaynak, R. S., Sack, B. P., & Swanson, E. T. (2007). Market-based measures of monetary policy expectations. Journal of Business & Economic Statistics, 25(2), 201-212. Güneş, K., & Mohanty, M. (2018) “Do interest rates play a major role in monetary policy transmission in China?,” BIS Working Papers 714, Bank for International Settlements. Hamilton, J. D., & Okimoto, T. (2011). Sources of variation in holding returns for fed funds futures contracts. Journal of Futures Markets, 31(3), 205-229. Joyce, M., Relleen, J., & Sorensen, S. (2008, December). Monetary Policy Expectations from Financial Market Instruments. ECB Working Paper Series No.978. Krueger, J. T., & Kuttner, K. N. (1996). The fed funds futures rate as a predictor of Federal Reserve policy. Journal of Futures Markets, 16, 865–879. Kuttner, K. N. (2001) “Monetary policy surprises & interest rates: Evidence from the Fed funds futures market,” Journal of Monetary Economics, Elsevier, vol. 47(3), pages 523-544, June. Kapp, D., & Kristiansen, K. (2021). “Euro area equity risk premia & monetary policy: a longer-term perspective,” Working Paper Series 2535, European Central Bank. Lakdawala. A.K., & Sengupta, R. (2021). “Measuring monetary policy shocks in India,” Indira Gandhi Institute of Development Research, Mumbai Working Papers 2021-021, Indira Gandhi Institute of Development Research, Mumbai, India. Lloyd, S.P. (2018). “Overnight index swap market-based measures of monetary policy expectations,” Bank of England Working Paper 709. Lloyd, S. P. (2021). Overnight indexed swap-implied interest rate expectations. Finance Research Letters, 38, 101430. Mathur, A., & Sengupta, R. (2019) “Analysing monetary policy statements of the Reserve Bank of India,” IHEID Working Papers 08-2019, Economics Section, The Graduate Institute of International Studies. Piazzesi, M., & Swanson, E. T. (2008). Futures prices as risk-adjusted forecasts of monetary policy. Journal of Monetary Economics, 55(4), 677-691. Prabu, A. E., Bhattacharyya, I., & Ray, P. (2020). Impact of monetary policy on the Indian stock market: Does the devil lie in the detail? Indian Economic Review, 55, 27-50. Rituraj & Kumar, A.V. (2021), ‘Assessing the Markets’ Expectations of Monetary Policy in India from Overnight Indexed Swap Rates’, RBI Bulletin (February). Sack, B.P. (2004). ‘Extracting the expected path of monetary policy from futures rates’, Journal of Futures Markets, vol. 24(8), pp. 733–54. Tabb, R., & Grundfest, J. (2013). “An Alternative to LIBOR,” Capital Markets Law Journal, 8, 229–260. Woodford, M. (2005). “Central bank communication & policy effectiveness,” Proceedings - Economic Policy Symposium - Jackson Hole, Federal Reserve Bank of Kansas City, issue Aug, pages 399-474. Woodford, M (2012), “Methods of policy accommodation at the interest-rate lower bound,” Proceedings - Economic Policy Symposium - Jackson Hole, Federal Reserve Bank of Kansas City, pages 185-288.
|