by Yuvraj Kashyap, Avnish Kumar, Anand Prakash and Shubhangi Latey^ Transmission to banks’ lending and deposit rates has improved in the recent period, facilitated by the introduction of the external benchmark-based lending rate system. Large surplus liquidity and subdued credit demand aided transmission during the pandemic-phase of the easing cycle. The calibrated normalisation of surplus liquidity and robust credit growth strengthened transmission during the current tightening phase although it is still not complete. An empirical bank-level analysis in a panel framework indicates that a higher share of CASA deposits in total deposits has a softening impact on lending rates, while higher capital adequacy ratio has a positive and significant impact. High CD ratio increases the pass-through to deposit and lending rates while excess SLR lowers the pass-through to deposit rates. Introduction Monetary policy in India moved into a tightening mode in May 2022 amidst inflationary pressures emanating from the conflict in Ukraine, the concomitant jump in international commodity prices, disruption of supply chains and volatility in global financial markets. The policy repo rate was increased by 250 basis points (bps) between May 2022 and February 2023 and the policy stance shifted to ‘withdrawal of accommodation’ to align inflation with the target, contain second round effects and keep inflation expectations anchored. Alongside, the Reserve Bank of India (RBI) restored the width of the liquidity adjustment facility (LAF) corridor to 50 bps with the introduction of standing deposit facility (SDF), which replaced the fixed rate reverse repo (FRRR) as the floor of the corridor, in April 2022. The SDF rate was set 40 bps above the FRRR. Additionally, the cash reserve ratio (CRR) was increased by 50 bps in May 2022. In the preceding three years (February 2019-March 2022), monetary policy was in an accommodative mode with cut in the policy repo rate by 250 bps along with large injection of liquidity and other conventional and unconventional measures to mitigate the impact of the COVID-19 pandemic on economic activity. In this backdrop of this shift in the monetary policy cycle, this article undertakes an assessment of the initial leg of monetary transmission, the process through which changes in central bank’s policy rate get transmitted to banks’ deposit and lending rates. Banks in India play an important role in meeting the credit needs of the economy and are thus an important conduit in monetary policy transmission. In order to strengthen the transmission of policy rate changes to banks’ deposit and lending rates as also to enhance transparency of the rate setting mechanism, the Reserve Bank has periodically refined the process of interest rate setting by banks with external benchmark-based lending rate (EBLR) system being the latest endeavour1 in this direction. Previous studies have found some evidence of asymmetry in the response of lending and deposit rates to monetary policy shocks in easy and tight monetary policy cycles, with a relatively faster change in lending rates in response to an increase in policy repo rate as compared to a decrease. For deposits, the pass-through was quicker during the easing phase as compared to the tightening phase (Das, 2015; Singh, 2011). An initial assessment of the EBLR regime, encompassing the accommodative phase of monetary policy, indicated that it helped to accelerate the pass-through to banks’ interest rates (Kumar and Sachdeva, 2021; Kumar et. al., 2022). The appropriate modulation of system liquidity in consonance with the prevailing monetary policy stance also aided monetary transmission. The EBLR system of loan pricing enables quicker and larger transmission to lending rates (Ranjan, 2022). Against this background, this article reviews recent dynamics of monetary policy transmission to lending and deposit rates of banks. The article is structured in the following manner. Section II assesses the transmission of the policy rate changes to banks’ interest rates at aggregate as well as disaggregated levels in the current tightening cycle vis-a-vis the previous easing phase. Section III presents an empirical estimation of the extent of the pass-through to lending and deposit rates of banks and attempts to delineate the potential determinants of the pass-through. The asymmetric impact of monetary policy on transmission has also been analysed in this section. Finally, Section IV concludes with key takeaways. II. Transmission to Banks’ Lending and Deposit Rates Lending and deposit rates of scheduled commercial banks (SCBs) have exhibited co-movement with the policy repo rate (Chart 1). The extent and speed of transmission have varied across monetary policy cycles and benchmark regimes, along with an asymmetry in the transmission to deposit and lending rates. II.1 Lending Rates The transmission to lending rates improved significantly during the easing phase, i.e., February 2019 to March 2022 (Chart 2a). Almost complete transmission to lending rates was witnessed, albeit over time, and this phase coincided with the introduction of the external benchmark regime in October 2019. The weighted average lending rate (WALR) of SCBs on fresh rupee loans touched a decadal low in April 2022. The lending rates have started increasing since May 2022 with the hike in the policy repo rate. The EBLR system, the normalisation of surplus liquidity and robust credit growth aided transmission in the current tightening phase. In response to the cumulative hike in repo rate by 250 bps during May 2022 to October 2023, the SCBs revised their repo-linked benchmark rates upwards by the same magnitude. The 1-year median marginal cost of funds-based lending rate (MCLR) rose by a relatively lower magnitude of 152 bps, reflecting the trends in banks’ cost of borrowings. Consequently, the WALR on fresh rupee loans rose by 187 bps, while that on outstanding loans rose by 111 bps during May 2022 to September 2023 (Chart 2b). 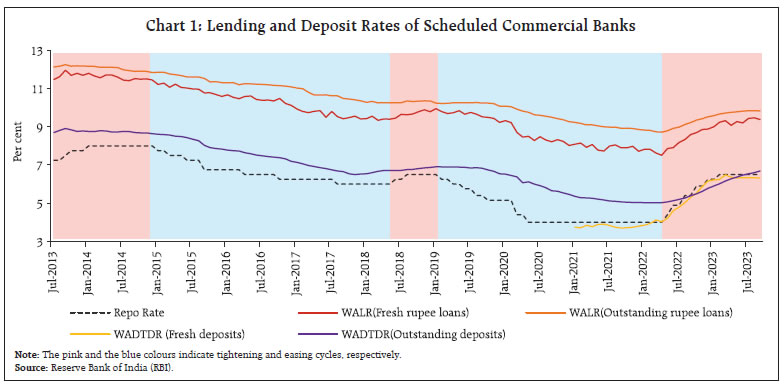
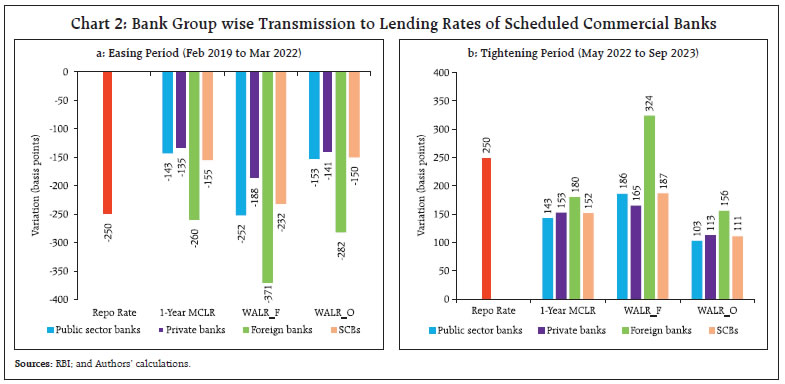 The increase in the share of outstanding floating rate loans linked to external benchmark and a quicker reset of such loans at higher benchmark rates have facilitated the transmission to WALR on outstanding loans in the current tightening period. Among various external benchmarks, most banks have chosen the policy repo rate as their benchmark for the pricing of loans (Chart 3a). The share of loans in the above 8 per cent interest rate range has increased (Chart 3b). At bank group level, the increase in the WALRs on fresh rupee loans was higher in the case of public sector banks (PSBs) relative to private banks (PvBs) during the period May 2022 to September 2023. However, the transmission to WALR on outstanding loans was relatively more for PvBs as compared to PSBs. The proportion of outstanding floating rate loans of the PvBs linked to external benchmark rates is higher than that of the PSBs, and this could have facilitated a greater pass-through to lending rates of PvBs2. The transmission to lending and deposit rates was the maximum in the case of foreign banks, reflecting the preponderance of their loans being EBLR-linked on the lending side and a higher share of low cost and lower duration wholesale deposits on the liabilities side, which facilitate a faster adjustment in interest rates.  The WALRs on fresh as well as outstanding rupee loans to major sectors increased during May 2022 to September 2023 (Chart 4a and 4b). The pass-through has been uneven across sectors reflecting risk profiles and the varied nature of loans extended in each sector. II.1.1 Transmission during Tightening Episodes The pass-through of policy rate changes to lending rates in the tightening cycles over the past decade has varied sizeably, depending upon factors such as the duration of the tightening cycle, the speed of the rate hikes, and the prevailing liquidity conditions apart from episode-specific events. During the taper tantrum tightening episode (July 2013 to December 2014), the RBI raised the marginal standing facility (MSF) rate, which became the de facto policy rate, and undertook liquidity tightening measures including limiting banks’ access to LAF and increase in daily CRR balance maintenance requirement even as the repo rate was left unchanged. Once normalcy was restored in the financial markets, the MSF rate was reduced while the repo rate was increased to contain the inflationary pressures (RBI, 2014). However, amidst surplus liquidity in the system, banks started reducing their lending rates even as the repo rate was unchanged, impeding the degree of transmission in this cycle (Chart 5a). During the June 2018 to January 2019 tightening episode, SCBs increased their lending rate on fresh loans by 55 bps in response to 50 bps change in the repo rate (Chart 5b). The tightening cycle that started in May 2022 has seen a higher magnitude of increase in the policy repo rate relative to the earlier cycles (Chart 5c). The increase in policy repo rate is still working its way through the system in the current tightening cycle (Das, 2023). 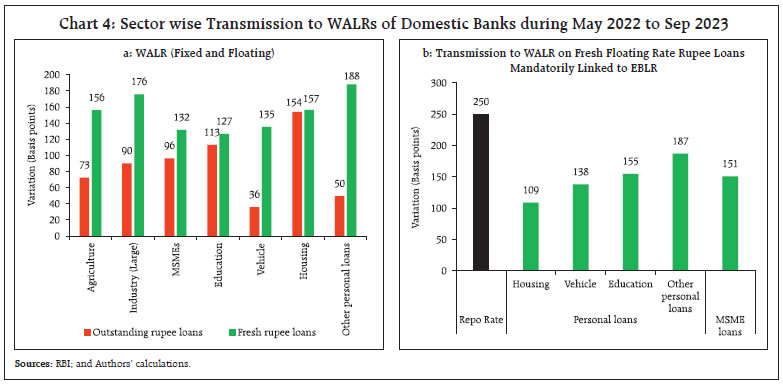
 Banks have reportedly reduced spreads charged on new loans over the past few months, thereby moderating the extent of transmission to actual lending rates on new loans (Table 1). II.2 Deposit Rates On the deposit side, the surplus liquidity conditions coupled with weak credit demand prompted banks to reduce their term deposit rates in the previous easing cycle (2019-22). In the current tightening cycle, with the sustained robust credit demand amidst tepid growth in deposits in the initial phase and moderation in surplus liquidity in the banking system, banks increased their term deposit rates significantly to attract fresh deposits (Chart 6a). | Table 1: Loans linked to External Benchmark – Spread of WALR (Fresh Loans) over the Repo Rate | | (Per cent) | | Sectors | September 2022 | September 2023 | | Public sector banks | Private Banks | Domestic Banks | Public sector banks | Private Banks | Domestic Banks | | MSME Loans | 4.13 | 3.55 | 3.81 | 3.77 | 2.71 | 3.05 | | Personal Loans | | Housing | 2.89 | 2.49 | 2.63 | 2.30 | 1.70 | 1.80 | | Vehicle | 3.09 | 3.48 | 3.13 | 2.36 | 2.90 | 2.42 | | Education | 4.33 | 4.88 | 4.50 | 3.71 | 3.84 | 3.76 | | Other Personal Loans | 4.03 | 6.38 | 4.21 | 3.39 | 3.36 | 3.37 | | Sources: RBI; and Authors’ calculations. |
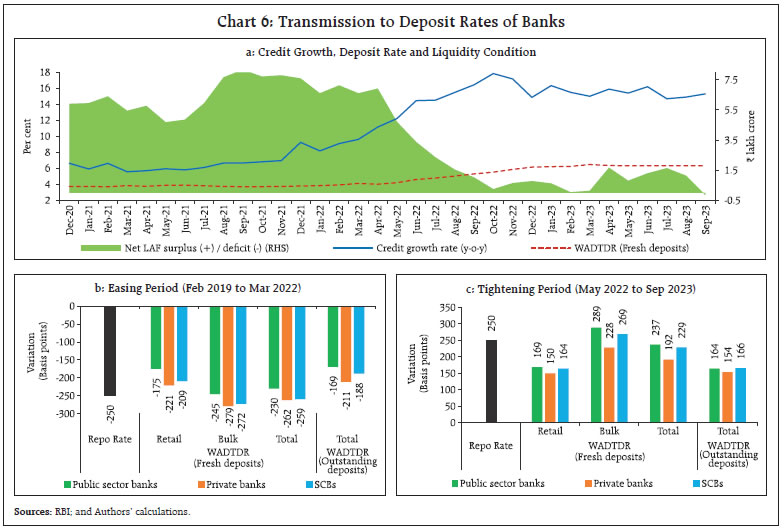 During May 2022 to September 2023, the weighted average domestic term deposit rate (WADTDR) on fresh deposits (bulk and retail combined) increased by 229 bps as against the increase of 250 bps in the repo rate. Banks raised their bulk term deposit rates more than retail term deposit rates in the initial phase of the tightening cycle. The increase in retail deposit rates outpaced increase in bulk deposit rates beginning second half of FY 2022-233. Overall, the WADTDR on fresh retail deposits increased by 164 bps as compared to 269 bps in case of fresh bulk deposits during May 2022 to September 2023. The transmission to WADTDR on outstanding deposits was lower at 166 bps over the same period, reflecting the longer maturity profile of term deposits contracted at fixed rates (Chart 6b & 6c). The EBLR system hastened the adjustments in deposit rates during the 2020-22 easing cycle, as banks were incentivised to reduce their term as well as savings deposit rates to protect their net interest margins (NIMs) in an environment of falling lending rates. On the other hand, during the tightening cycle, the pace of increase in deposit rates (term deposits and savings account deposits taken together) has lagged the pace of increase in lending rates so far. While the increase in term deposit rates in the current tightening cycle has exceeded that in lending rates, the savings deposit rates of banks – which are a third of total deposits – have remained almost unchanged (Chart 7a and 7b). This has moderated the increase in the banks’ overall cost of funds. Accordingly, higher NIMs have been observed during the current tightening phase so far (Chart 7c). II.3 Recent International Experience Multi-decadal high inflation has been a global phenomenon across the world since the beginning of 2022. In response, central banks embarked on the path of monetary tightening, which has been the most synchronised tightening episode in the last five decades (BIS, 2022). Central banks raised policy rates at about twice their historical pace in the 2022-23 cycle (Chart 8).
In response to monetary policy tightening, banks in many jurisdictions have raised their lending rates significantly (Table 2). The pass-through has varied across countries, reflecting inter alia different financial structures. In Euro area, where banks constitute an important segment of financial markets, transmission to term deposit rates has been significant while households’ sight deposits witnessed limited pass-through (François Villeroy de Galhau, 2023). III. Empirical Analysis In this section, an attempt has been made to empirically estimate the drivers of the pass-through of policy rate changes to lending and deposit rates of SCBs in a panel framework using generalised method of moments (GMM) estimator approach. Following Gambacorta (2008), the role of macroeconomic as well as bank specific factors in shaping monetary transmission is analysed. | Table 2: Transmission to Bank Lending Rates in Select Countries | | Country | Recent Tightening Period | Cumulative increase in policy rate | Category of loans | Cumulative increase in lending rates | % increase in lending rates to policy rate | | Australia | May 2022- Sep 2023 | 400 | Housing Loan- All loans | 348 | 87 | | | | | Housing loans- Variable rate | 359 | 90 | | Canada | Mar 2022- Sep 2023 | 475 | Variable Rate Mortgage (Total) | 587 | 124 | | | | | Fixed Rate Loan (5Y and over) | 164 | 35 | | US | Mar 2022- Sep 2023 | 525 | 30Y Fixed Rate Mortgage (Average) | 355 | 68 | | | | | 15Y Fixed Rate Mortgage (Average) | 371 | 71 | | France | July 2022- Sep 2023 | 450 | New Loans to NFCs | 298 | 66 | | | | | New Loans to Households | 201 | 45 | | Germany | July 2022- Sep 2023 | 450 | New Loans to NFCs | 305 | 68 | | | | | New Loans to Households | 155 | 34 | | Italy | July 2022- Sep 2023 | 450 | New Loans to NFCs | 376 | 84 | | | | | New Loans to Households | 216 | 48 | | Netherlands | July 2022- Sep 2023 | 450 | New Loans to NFCs | 307 | 68 | | | | | New Loans to Households | 177 | 39 | | Spain | July 2022- Sep 2023 | 450 | New Loans to NFCs | 330 | 73 | | | | | New Loans to Households | 219 | 49 | | UK | Dec 2021- Sep 2023 | 515 | Secured loans on dwellings, new advances to Individuals and individual trusts | 351 | 68 | | | | | Other loans, new advances to Individuals and individual trusts | 230 | 45 | | India | May 2022- Sep 2023 | 250 | Fresh rupee loans (Total) | 187 | 75 | | | | | Outstanding rupee loans (Total) | 111 | 44 | | Sources: Central bank websites; CEIC. | III.1 Data and Methodology The empirical analysis focuses on the flexible inflation targeting (FIT) period (2016:Q3 to 2022:Q4) and uses quarterly data for 28 major SCBs4 to assess monetary transmission. Additionally, an attempt has also been made to gauge monetary transmission during the EBLR period, i.e., 2019:Q3 to 2022:Q4. In the case of lending rates, the WALR on fresh rupee loans is used as the dependent variable and the policy repo rate (Repo) is considered as the key monetary policy variable along with other macroeconomic and bank-specific control variables. Data on WALR on fresh rupee loans are from returns submitted by banks while the rest of the variables have been sourced from the Database on the Indian Economy, RBI. Based on Gambacorta op. cit., Chattopadhyay and Mitra, 2022; Holton et. al., 2018, the following variables have been identified and used in our model (Table 3). Incorporating these variables in our model, Equation (I) is used to estimate the pass-through of policy rate changes to lending rates: 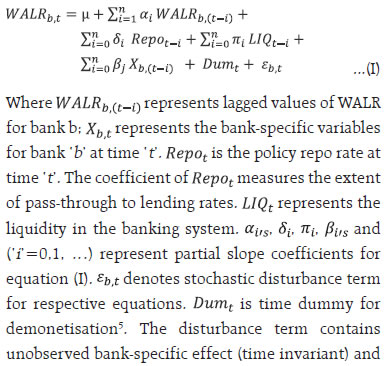 
| Table 3: Dependent and Explanatory Variables used for Model Estimation | | Dependent Variable: WALR on Fresh Rupee Loans | | Explanatory Variables | Expected Sign | Theory | | Policy Repo rate | (+) | Policy rate changes get transmitted to the lending rates of banks through the interest rate channel of monetary transmission. | | Current account savings account (CASA) deposit share in total deposits | (-) | Accretion of CASA deposits is a relatively cheaper source for banks to fund credit growth. An increase in CASA share can lead to lower lending rate if the spread remains constant. | | Gross Non-Performing Assets (GNPA) Ratio | (+) / (-) | A high GNPA may prompt banks to charge higher spread (credit risk premium) to protect their margins. However, high NPAs could also prompt banks to rejig their portfolio towards more creditworthy borrowers, which can lead to lower lending rates. | | Capital to Risk weighted Assets Ratio (CRAR) | (+) / (-) | Higher capital requirements increase the cost of intermediation and banks may pass on the cost to borrowers. On the other hand, banks with higher CRAR may be able to raise funds at a relatively lower cost, thereby reducing their lending rates even if financial conditions are tight. | | Net LAF adjusted for NDTL | (-) | An increase in liquidity in the banking system is expected to have a softening impact on lending rates, as banks’ requirements of funds could be lower resulting in a reduction in deposit rates. | | Incremental Credit to Deposit Ratio | (+) | A measure of bank’s lending capacity given its deposit funding. A high CD ratio, ceteris paribus, could prompt banks to raise their lending rates, and vice versa for a moderation in their CD ratio. | Drawing from Arellano-Bover (1995) and Blundell and Bond (1998), system GMM estimator approach in a dynamic panel framework has been used for empirical estimation for consistent and efficient estimates (Roodman, 2009). In our model, the GMM has been used given the observed persistence in the dependent variable (WALR and WADTDR) and the model has potential heterogeneity arising out of fixed individual bank effects. The robustness of the model was tested using a variety of diagnostics tests: (i) Sargan test of over identifying restrictions for the validity of the instruments; and (ii) Arellano-Bond test (AB test) for serial correlations of the residuals for first order and absence in the subsequent higher orders, i.e., AR(1) should be significant, and AR(2) should be insignificant. III.2 Results At the outset, bin scatter plots6 have been drawn for a preliminary non-parametric analysis of the relationship between the dependent and the explanatory variables. Scatter plots show that the WALR on fresh rupee loans is positively correlated with the repo rate, while liquidity, CASA share and GNPA are negatively correlated during the EBLR period as well as for the whole sample period, i.e., FIT period. CRAR is positively correlated during the EBLR period, while there is a weak correlation in the whole sample period. The correlation between incremental CD ratio and lending rate is ambiguous for the whole sample period (Annex Chart 1 and Chart 2). | Table 4: Pass-through of Repo Rate changes to Lending Rates – A System GMM Approach | | Dependent Variable: WALR | Model I
(FIT Period) | Model II
(Tightening Dummy) | Model III
(EBLR Period) | | Explanatory Variables | | WALR (-1) | 0.554***
(0.10) | 0.582***
(0.04) | 0.690***
(0.01) | | WALR (-2) | 0.112
(0.10) | 0.094***
(0.03) | | | Repo Rate | 0.229***
(0.03) | 0.206***
(0.03) | 0.255***
(0.02) | | CASA (-1) | -0.010**
(0.00) | -0.009**
(0.00) | -0.006**
(0.00) | | CRAR (-1) | 0.040*
(0.02) | 0.037**
(0.02) | 0.024
(0.02) | | GNPA (-1) | | | -0.006
(0.01) | | GNPA (-3) | 0.004
(0.01) | 0.003
(0.01) | | | LIQ | | | -0.019***
(0.01) | | LIQ (-1) | -0.057***
(0.01) | -0.051***
(0.01) | | | ICD (-1) | 0.002***
(0.00) | 0.002***
(0.00) | 0.004***
(0.00) | | Constant | 1.715**
(0.76) | 1.759**
(0.71) | 1.481***
(0.32) | | Demonetisation Dummy | -0.086***
(0.02) | -0.043
(0.04) | | | T_Dummy*Repo | | 0.013**
(0.01) | | | Long run Passthrough | | Repo Rate | 69***
(0.073) | 63***
(0.73) | 82***
(0.058) | | Diagnostics | | AR (1) (p) | 0.013 | 0.001 | 0.011 | | AR (2) (p) | 0.770 | 0.858 | 0.995 | | Sargan (p) | 0.096 | 0.109 | 0.082 | | No. of Banks | 28 | 28 | 28 | | Observations | 728 | 728 | 392 | ‘***’, ‘**’ and ‘*’ represent significance level at 1%, 5% and 10% respectively.
Standard errors in parentheses. | The results of the econometric analysis (for WALR) are reported in Table 4. Three models have been estimated with model I covering the entire sample period, i.e., FIT period, while model II specifically deals with the impact on transmission during the tightening cycles in the whole sample period. Model III covers the EBLR sub-period. The results suggest that a 100 bps increase in the policy repo rate has a contemporaneous significant positive impact of 20-25 bps on the lending rates of banks across the models and the long-run impact is higher at 82 bps during the EBLR period, and 69 bps during the overall period (63 bps in model II). Systemic liquidity in the banking system and the share of CASA deposits in total deposits have the expected negative and significant impact on lending rates. It may be mentioned that the share of CASA deposits in total deposits increased from 41.2 per cent in September 2019 to 44.8 per cent in March 2022. An increase in credit/deposit ratio has positive impact on lending rates and thus expected to strengthen the pass-through to lending rates during the tightening phase. While capital adequacy ratio has a positive and significant impact on lending rates over the full sample period, the asset quality of banks has an insignificant impact on the lending rates. To assess the asymmetric impact of monetary policy, an interaction dummy (T_Dumt * Repot) that captures the differential pass-through to lending rates during the tightening cycles vis-à-vis easing cycles is introduced as: The coefficient of the interaction dummy (T_Dumt * Repot) is positive and significant (Model II), implying that the pass-through to lending rates is higher during the tightening cycle. In the case of deposit rates, as noted earlier, the analysis pertains to a shorter period 2020:Q1 to 2022:Q4. The results indicate that a 100 bps change in the policy repo rate pushes term deposit rates by around 70 bps contemporaneously (Table 5). The surplus liquidity and the credit/deposit ratio have the expected negative and positive signs, respectively. High investment ratio dampens transmission to deposit rates as banks can meet higher credit demand by drawing down on their excess investments rather than mobilising fresh deposits. Bank size is found to have a negative impact on deposit rates suggesting big banks offer lower rates on term deposits. | Table 5: Pass-through of Repo Rate changes to Deposit Rates | | Dependent Variable: WADTDR- Fresh deposits | | Explanatory Variables | Model I
(Baseline) | Model II | | WADTDR(-1) | 0.409***
(0.018) | 0.396***
(0.021) | | Repo Rate | 0.681***
(0.020) | 0.705***
(0.023) | | Liquidity(-1) | -0.015***
(0.004) | -0.023***
(0.004) | | CD Ratio (-1) | 0.015***
(0.001) | 0.007***
(0.002) | | Investment_ratio (-1) | | -2.797***
(0.214) | | Bank size | | -0.053*
(0.018) | | Constant | -1.287***
(0.099) | 0.684**
(0.292) | | Long Run pass-through | | Repo Rate | 1.15***
(0.021) | 1.16***
(0.026) | | Diagnostics | | AR(1) (p) | 0.006 | 0.004 | | AR(2) (p) | 0.183 | 0.120 | | J-Hansen Test (p) | 0.300 | 0.431 | | No. of Banks | 28 | 28 | | Observations | 336 | 336 | Note: This table reports results of estimating Yi,t = α + βXi,t + εi,t; where, Yi,t denotes WADTDR- fresh deposits during 2020:Q1 to 2022:Q4. The Xi,t variables include repo rate, and other control variables, viz., liquidity, credit ratio, investment ratio and bank size. Investment ratio is calculated as ratio of SLR approved securities to total deposits. Bank size is taken as log of total assets of banks.
'***’, ‘**’ and ‘*’ represent significance level at 1%, 5% and 10% respectively. Standard errors are in parentheses. | IV. Conclusion This article has attempted to analyse recent dynamics in monetary transmission to banks’ lending and deposit rates. The transmission to banks’ interest rates has improved in the recent period, facilitated by the introduction of the EBLR system. Large surplus liquidity and subdued credit demand aided transmission during the pandemic-phase of the easing cycle, while the calibrated normalisation of surplus liquidity and robust credit growth strengthened transmission during the current tightening phase. The transmission to term deposit rates has been robust while savings deposit rates have exhibited rigidity. An empirical bank-level analysis in a panel framework indicates that surplus liquidity in the banking system and a higher share of CASA deposits in total deposits has a negative and significant impact on lending rates, while higher capital adequacy ratio has a positive and significant impact on lending rates. High credit/deposit ratio strengthens the transmission to deposit and lending rates while excess SLR lowers the pass-through to deposit rates. The pass-through to lending rates is found to be higher during the tightening cycle. The extent of transmission has improved after the introduction of EBLR system in October 2019. With the MCLR-linked loans still a sizeable part of the lending portfolio, the transmission of the policy rate actions to deposit and lending rates is ongoing at the current juncture. References: Arellano, M., & Bover, O. (1995). Another look at the instrumental variable estimation of error-components models, Journal of Econometrics, 68(1), 29-51. Blundell, R., & Bond, S. (1998). Initial conditions and moment restrictions in dynamic panel data models. Journal of econometrics, 87(1), 115-143. Cavallino, P., Cornelli, G., Hördahl, P., and Zakrajšek, E. (2022), “Front-loading monetary tightening: pros and cons”, BIS Bulletin No. 63, December 9, 2022. https://www.bis.org/publ/bisbull63.htm Chattopadhyay, S.K., and Mitra, A.K., (2022), “Monetary Policy Tansmission in India under the Base rate and MCLR regimes: a Comparative Study”, RBI Working Paper Series 10 (2022). Das, S. (2015), “Monetary Policy in India: Transmission to Bank Interest Rates”, Working Paper No. WP/15/129, International Monetary Fund. Das, S. (2023), Governor’s Statement, June 8, 2023. https://www.rbi.org.in/Scripts/BS_PressReleaseDisplay.aspx?prid=55816 François Villeroy de Galhau (2023), “Monetary policy transmission: where do we stand?” Speech delivered in International Symposium, National Association for Business Economics – Paris, 22 May 2023. https://www.banque-france.fr/en/governors-interventions/monetary-policy-transmission-where-do-we-stand Gambacorta, L. (2008), “How do Banks Set Interest Rates?”, European Economic Review 52(5):792–819. Holton, S., & d’Acri, C. R. (2018). Interest Rate Pass-through since the Euro Area Crisis. Journal of Banking & Finance, 96, 277-291. Kumar, A. & Sachdeva, P. (2021). Monetary Policy Transmission in India: Recent Developments. Reserve Bank of India Bulletin, LXXV(7), 35–47 https://rbidocs.rbi.org.in/rdocs/Bulletin/PDFs/0BUL150720219C7B0C687FA4491390D7D29A7328778D.PDF Kumar, A., Prakash, A., Latey, S. (2022). Monetary Transmission to Banks’ Interest Rates: Implications of External Benchmark Regime. Reserve Bank of India Bulletin, LXXVI (4), 185–204 https://www.rbi.org.in/Scripts/BS_ViewBulletin.aspx?Id=20939 Ranjan, R. (2022), Minutes of the Monetary Policy Committee Meeting, June 6 to 8, 2022. https://www.rbi.org.in/scripts/FS_PressRelease.aspx?prid=53904&fn=2752 Reserve Bank of India (2014), Annual Report, 2014. Roodman, D. (2009). How to do xtabond2: An Introduction to Difference and System GMM in Stata. The Stata Journal, 9(1), 86-136. Singh, B. (2011), “How Asymmetric is Monetary Policy Transmission to Financial Markets in India”, RBI Occasional Paper Volume 32, No, 2.
Annex
|