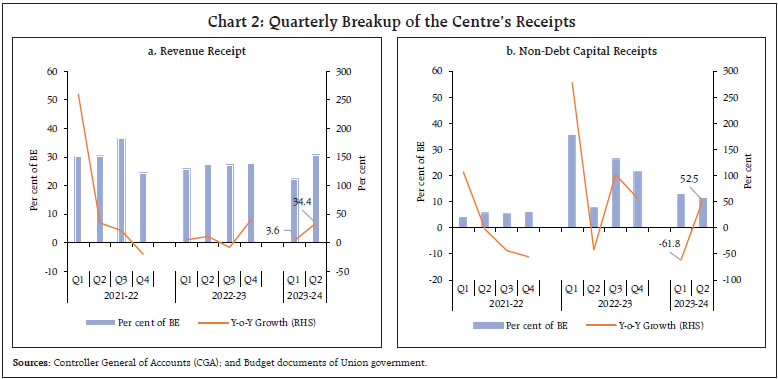
by Harshita Yadav, Kovuri Akash Yadav, Rachit Solanki, Saksham Sood, Anoop K Suresh, Samir Ranjan Behera and Atri Mukherjee^ The fiscal position of the Centre and States remained resilient during H1:2023-24. Their receipts were broadly in line with budget estimates and the containment of revenue expenditure while preserving capital expenditure demonstrated commitment to prudent fiscal management. The improvement in the quality of government expenditure bodes well for medium-term growth prospects and fiscal consolidation. I. Introduction The Union Budget 2023-24 was announced at a time when the Indian economy was being hailed as a ‘bright spot’ in terms of high growth aided by strong macroeconomic fundamentals. The Union Budget 2023-24 prioritised enhancing citizens’ opportunities, accelerating growth, job creation, and macroeconomic stability. Towards fulfilment of these objectives, the Union government continued its thrust on infrastructure development with the allocation of a record level of capital expenditure. Likewise, to incentivise States’ capital spending, allocation for the scheme providing financial assistance to States for capital expenditure, introduced in 2021-22, was enhanced by 30 per cent and extended into 2023-24. Furthermore, the government has curtailed its revenue expenditure, prioritising capital spending to enhance the overall quality of government expenditure. The Centre aimed for a feasible order of fiscal consolidation for 2023-24, in line with the medium-term gross fiscal deficit (GFD) target of 4.5 per cent of the GDP by 2025-26. The States too have endeavoured for fiscal consolidation in 2023-24, budgeting a consolidated GFD of 3.1 per cent of the GDP, down from 3.4 per cent in 2022-23 (RE).1,2 The government finances for the Centre and States, as evident from the half yearly review for the financial year 2023-24 (viz., H1:2023-24) was robust, notwithstanding the prevailing geo-political tensions as well as the elevated likelihood of a recession in several advanced economies. The Centre’s major direct and indirect tax heads such as income tax, corporation tax, and goods and services tax (GST) recorded impressive growth in H1:2023-24. On the expenditure side, the Centre has ensured front-loading of its capital expenditure which would catalyse economic recovery from the scars left behind by the pandemic. On the other hand, the Centre has successfully contained its revenue expenditure to below 50 per cent of the BE for 2023-24 in H1:2023-24. States’ tax revenues remained buoyant during H1:2023-24, with a noticeable increase in their own tax revenue (OTR). Additionally, they have benefitted from a substantial increase, exceeding 20 per cent, in the transfer of tax revenue (viz., assignment to States) under the devolution formula. States have also sustained the pace of their total expenditure with notable increase in capital spending during H1:2023-24 on the back of the Union government’s Scheme for Special Assistance to States for Capital Investment.3 The rest of the article is structured as follows: Section II analyses the receipt and expenditure of the Centre and States (at a quarterly frequency) for H1:2023-24. Section III deals with the outcomes in terms of key deficit indicators and their financing for the Centre as well as States. Section IV presents estimates on general government (Centre plus States) finances for Q1 and Q2 of 2023-24 along with projections for the second half (H2) of 2023-24. Section V sets out the concluding observations and the near-term fiscal outlook. II. Fiscal Outcomes in Q1 and Q2 of 2023-24 In line with the trend witnessed during H1:2021-22 and H1:2022-23, more than 50 per cent of the budgeted total receipts of the Central government was realised during H1:2023-24. On the other hand, the Centre’s total expenditure remained contained below 50 per cent of the BE in H1:2023-24, in line with the pattern observed during the past three years. For States, both receipts and expenditure recorded robust growth. However, States’ GFD stood at 39.8 per cent of the BE in H1:2023-24, higher than in the previous year, attributable to growth in total expenditure outpacing growth in total receipts. Nevertheless, the States’ total receipts remained resilient, with the proportion of budgeted receipts in H1:2023-24 (39.7 per cent) close to H1:2022-23 (41.2 per cent). On the expenditure side, the States have expended 39.7 per cent of their budgeted total expenditure during H1:2023-24, broadly in line with the past spending patterns (Chart 1 a and b). a. Receipts Revenue receipts of the Central government registered a growth of 3.6 per cent in Q1:2023-24, attributable to a high growth in non-tax revenue, on the back of more than budgeted surplus transfer by the Reserve Bank.4 However, it was partly offset by sub-par tax collections and non-debt capital receipts.5 With a pick-up in tax revenues in Q2:2023-24, the growth in revenue receipts improved to 34.4 per cent (Chart 2 a and b). 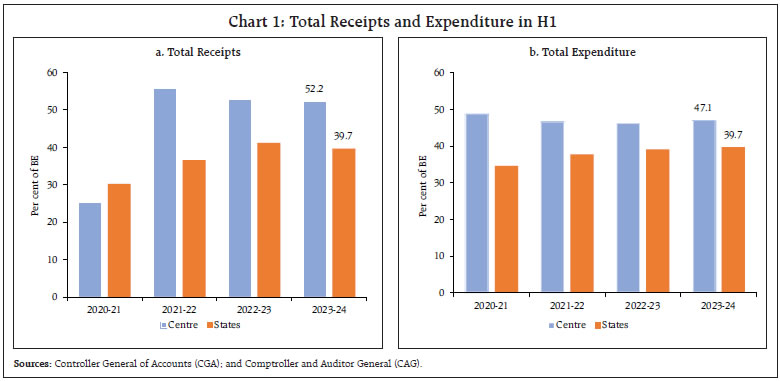
 States’ revenue receipts clocked a y-o-y growth of 8.3 per cent in H1:2023-24 (over the appreciable y-o-y growth of 26.2 per cent in H1:2022-23). This growth was spread over Q1:2023-24 and Q2:2023-24, at 15.3 per cent and 2.0 per cent, respectively. Tax revenue, which accounted for 81 per cent of the revenue receipts during H1:2023-24, exhibited a growth of 22.4 per cent and 8.1 per cent in Q1:2023-24 and Q2:2023-24, respectively. States’ non-debt capital receipts6, however, witnessed a contraction in Q1:2023-24 but recorded a strong recovery in Q2:2023-24 (Chart 3 a and b). 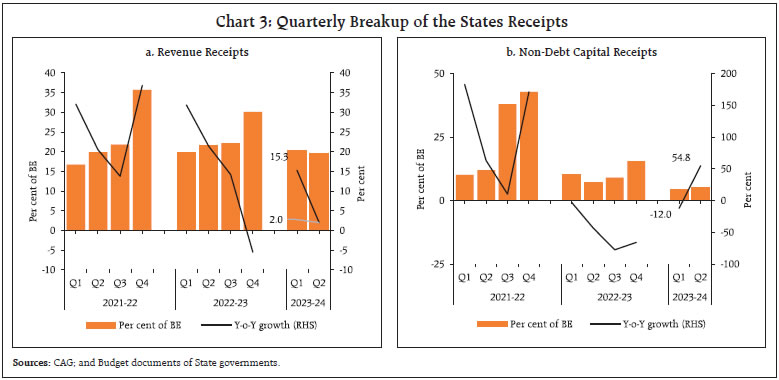
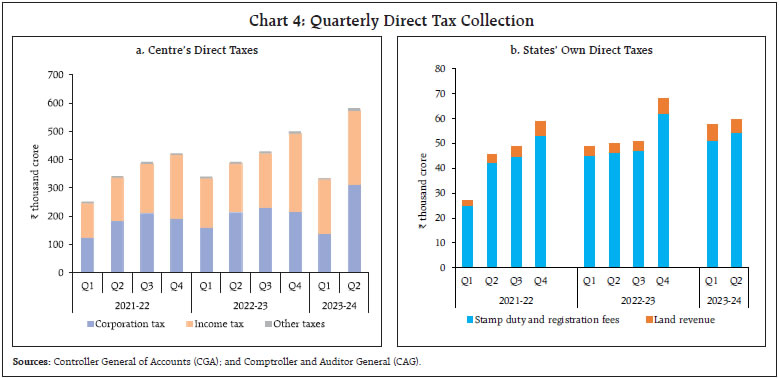 The Centre’s direct tax collections grew by 25.2 per cent (y-o-y) in H1:2023-24, led by growth in corporation tax and income tax collections of 20.2 per cent and 31.1 per cent, respectively. In Q1:2023-24, the Centre’s direct tax collections contracted by 1.8 per cent owing to a 13.9 per cent decline in corporate tax collections whereas in Q2:2023-24 it recorded a robust growth of 48.7 per cent on a y-o-y basis owing to both income tax and corporate tax collections. Direct taxes experienced an upswing in August-September 2023-24, which helped to shed off the sluggishness observed during April-July. Direct tax collections in H1:2023-24 benefitted from increased compliance, higher advance tax collections and widening of tax base (Chart 4a).7,8,9 On the other hand, the Centre’s indirect tax collections increased by 6.5 per cent (y-o-y) in H1:2023-24, with robust growth in major heads except union excise duty collections which experienced contraction, partly on account of the slashing of the excise duty on petrol and diesel in May 2022.10 States’ own direct tax collection (comprising land revenue and receipts from stamp duty and registration fees) performed well during H1:2023-24. It recorded a growth of 18.1 per cent in Q1:2023-24 followed by a growth of 19.2 per cent in Q2:2023-24 over the corresponding quarters of the previous year (Chart 4b). The GST collections (Centre plus States) have remained buoyant, recording a y-o-y growth of 11.1 per cent and averaging ₹1.7 lakh crore during H1:2023-24, as against an average of ₹1.5 lakh crore during H1:2022-23 on the back of improved economic activity as well as increased compliance. GST collections recorded a growth of 11.6 per cent in Q1:2023-24 and 10.6 per cent in Q2:2023-24 on a y-o-y basis (Chart 5). For States, higher and stable collection of States GST [viz., SGST] (on account of rising demand and greater compliance), and tax devolution from the Centre (on account of higher buoyancy) contributed to the growth in revenues. In H1:2023-24, the assignment to States (i.e., regular instalment to the States) recorded a growth of 20.9 per cent over the corresponding period of the previous year, on top of the record y-o-y growth of around 45 percent attained in H1:2022-23. Notably, in June 2023, the government had released one advance instalment of tax devolution in addition to the assignment to States to enable them to speed up capital spending, finance their development related expenditure and to make available resources for priority projects (Chart 6 a and b).11 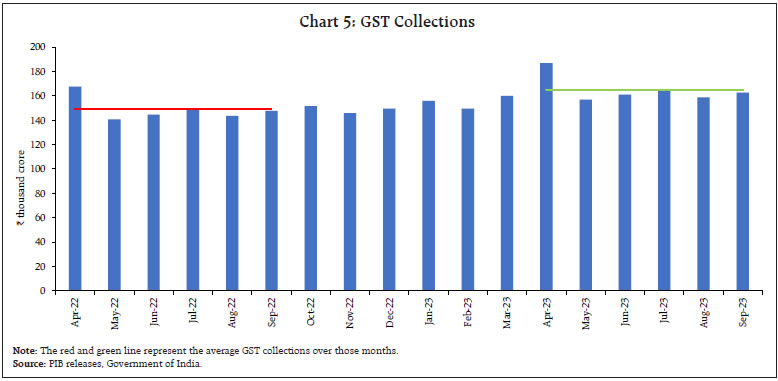 As per cent of BE, the tax devolution to States in H1:2023-24 from the Centre was 44.6 per cent of the budgeted amount for 2023-24 (as against 46.1 per cent in H1:2022-23). Greater and timely tax devolution by the Centre enable States to plan better spending of resources, especially capex, as well as address the issue of horizontal fiscal imbalance12 inherent among the Indian States (Box 1). 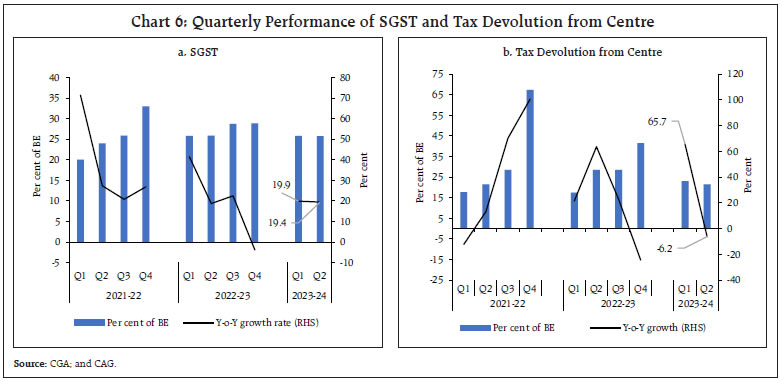 Box 1: Horizontal Imbalances: Club Convergence Analysis of States’ Own Tax Revenues Due to the heterogeneity amongst the States, horizontal fiscal imbalances among the subnational units are expected. Equalisation transfers are designed to overcome the horizontal fiscal imbalances. In this context, measuring the fiscal gap and mapping the trajectory of the imbalances is vital for designing fiscal transfers. Convergence analysis can be useful in measuring horizontal inequities and understanding the dynamics of disparities over time. The convergence hypothesis says that poorer regions grow faster than the richer regions and eventually catch up. Club convergence analysis can reveal distinct convergence patterns within and among regions. It recognizes that regions may not all converge to a single common level but may converge to different stable groups or ‘clubs’ based on their characteristics and development trajectories. It helps in identifying the specific factors and characteristics that led regions to follow different paths and reach different stable income or growth levels. The club convergence hypothesis for the per capita States’ Own Tax Revenues (SOTR) across 16 Indian States from 2001-2022 was investigated using the ‘log T-test’ following Phillips and Sul (2007, 2009). The results indicated that, for all the 16 Indian States, there is divergence at the aggregate level. However, clustering algorithm13 suggests that the States form into two distinct clubs each constituting 8 States. The average per capita SOTR of Club 1 is higher that of Club 2 (Chart B1 and Table B1.a). The speed of convergence, as indicated by the coefficient, is faster for Club 1 compared to Club 2 indicating that the richer States are converging faster than the poorer States. For exploring the determinants of club formation, a binary probit model was estimated with the following variables: initial social, economic and structural factors such as initial per capita income, initial literacy rate, share of agriculture in GSDP and growth in GSDP per capita. Overall, the estimates suggest that States having low share of agriculture in GSDP have more probability to be in a club with higher average own tax revenues (Table B1.b). Initial level of per capita income, and social factors as represented by literacy rate also significantly impact the membership of a club. | Table B1.a: Club Convergence of States’ Own Tax Revenues | | | All States | Club 1 | Club 2 | | Number of States | 16 | 8 | 8 | | Coefficient | -0.18 | 0.24 | 0.06 | | T-stat | -5.85 | 4.45 | 1.40 |
In sum, club convergence analysis suggests a widening gap between States. The poorer States are impaired by both structural and initial social and economic conditions. However, equalisation transfers can improve the fiscal capacity of States as well as address horizontal fiscal imbalances. | Table B1.b: Factors Determining Club Formation | | Explanatory Variables | Coefficient | Standard Error | | Ln share of agriculture | -2.65*** | 0.40 | | Ln initial per capita income | 1.63*** | 0.40 | | Ln growth in per capita income | 0.28** | 0.12 | | Ln initial literacy rate | 3.01** | 1.45 | | Constant | -21.49*** | 4.90 | No. of Observations = 306, t=21, n=16.
LR chi2 (4) = 214.27, Prob > chi2 = 0.0
Pseudo R2 = 0.5052
Note: ***: p < 0.01, **: p<0.05. | Reference: Phillips, P. C., & Sul, D. (2007). Transition Modeling and Econometric Convergence Tests. Econometrica, 75(6), 1771-1855. |
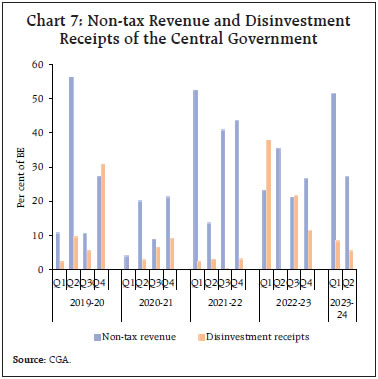 Centre’s non-tax revenues increased in Q1:2023-24 on the back of more than budgeted surplus transfer by the Reserve Bank but witnessed a contraction of 14.3 per cent in Q2:2023-24, as growth in revenue from dividends and profits14 was offset by contraction in revenue from economic services.15 On the disinvestment front, around 14 per cent of the budgeted disinvestment target of ₹51,000 crore was raised in H1:2023-24 as against 38 per cent in H1:2022-23 (Chart 7).16 b. Expenditure In 2023-24 (BE), the total expenditure of the Central government was budgeted to grow by 7.5 per cent17, lower than 10.4 per cent growth in 2022-23 (RE). Revenue expenditure growth was budgeted to grow at a modest rate of 1.3 per cent whereas capital expenditure growth was pegged at 37.4 per cent.18 In H1:2023-24, total expenditure of the Centre stood at 47.1 per cent of the budget estimates for 2023-24 (46.7 and 46.2 per cent of the budget estimates in 2021-22 and 2022-23, respectively). Revenue expenditure attained 46.5 per cent of 2023-24 BE (as compared with 47.7 and 46.3 per cent in 2021-22 and 2022-23, respectively) while capital expenditure was 49.0 per cent of 2023-24 BE (41.4 and 45.7 per cent of the BE was observed during 2021-22 and 2022-23, respectively). The capital expenditure has been front-loaded in H1:2023-24 by the Central government which bodes well for the medium-term growth prospects of the economy. In H1:2023-24, key ministries such as the Ministry of Road Transport and Highways, the Ministry of Defence and the Ministry of Railways accounted for more than 75 per cent of the total capital expenditure (Chart 8).
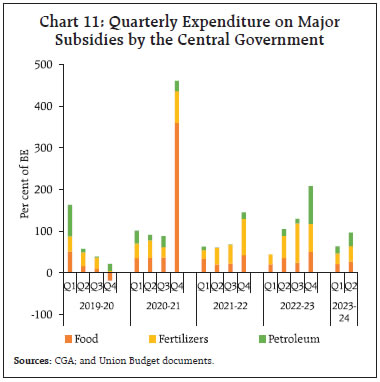
The Union government had placed before the Parliament the first batch of supplementary demand for grants (SDG-I) for 2023-24 during the winter session of the Parliament19 which involved an additional cash outgo of ₹58,378 crore.20 Going forward, in H2:2023-24, total expenditure growth is likely to increase marginally, primarily on back of robust growth in capital expenditure (Chart 9). Quarterly trends indicate that revenue expenditure increased in Q2:2023-24 after remaining flat in Q1:2023-24. On the other hand, capital expenditure displayed robust growth (y-o-y basis) in both Q1:2023-24 and Q2:2023-24 with growth in the former being higher than the latter (Chart 10 a and b). The major subsidies outgo of the Central government, comprising food, fuel and fertilisers, stood at 55.1 per cent of BE in H1:2023-24 vis-a-vis 62.6 per cent of BE in H1:2022-23. Fertiliser and food subsidies accounted for 53.4 per cent and 46.1 per cent of total outgo on major subsidies in H1:2023-24 vis-à-vis 41.1 per cent and 58.4 per cent, respectively, in the corresponding period of the previous year (Chart 11). 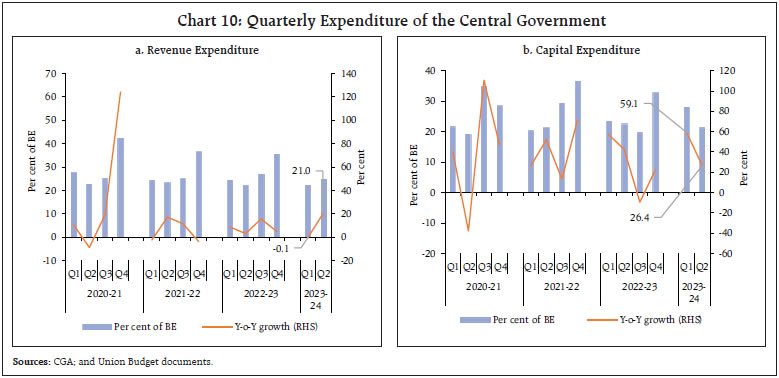
 States’ revenue expenditure growth in Q1 and Q2 of 2023-24, at 7.8 per cent and 10 per cent, respectively, was much lower than the growth registered in the corresponding quarters of 2022-23. Nevertheless, keeping in line with the spending behaviour of the previous year, States have exhausted 41.0 per cent of their budgeted revenue expenditure in H1:2023-24 (as compared with 41.5 per cent in H1:2022-23). On the other hand, capital expenditure was front-loaded by the States resulting in y-o-y growth of 47.3 per cent in H1:2023-24, with Q1:2023-24 and Q2:2023-24 at 72.4 per cent and 33.6 per cent, respectively. More importantly, capital outlay (capital expenditure minus loans and advances) registered an even higher growth of 52.6 per cent in H1:2023-24 vis-a-vis a marginal growth of 2.9 during H1:2022-23 (Chart 12 a and b). III. Fiscal Deficit and its Financing Central Government a. Fiscal Deficit The Union government had budgeted for a GFD of 5.9 per cent of GDP in 2023-24 which is in line with the medium-term GFD target of 4.5 per cent of GDP by 2025-26. During H1:2023-24, GFD of the Union government stood at 39.3 per cent of the BE, marginally higher than the GFD of 37.3 per cent during the corresponding period of the previous year, attributable to front-loading of capital expenditure by the Central government. Robust tax collections in by the Central government. Robust tax collections in Q2:2023:24 contained fiscal deficit at 14.0 per cent of BE during the period (Chart 13 a and b) (Box 2). 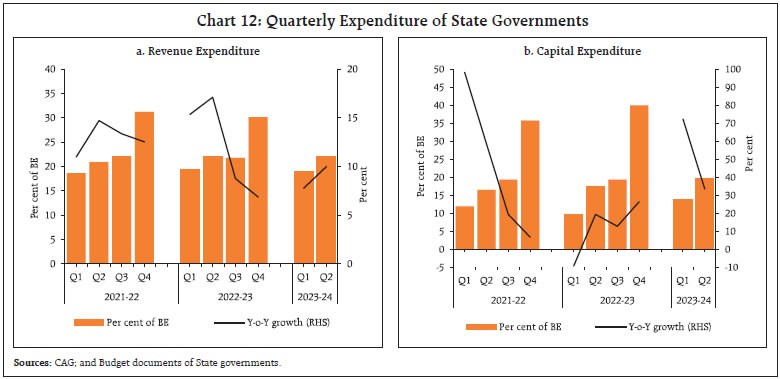
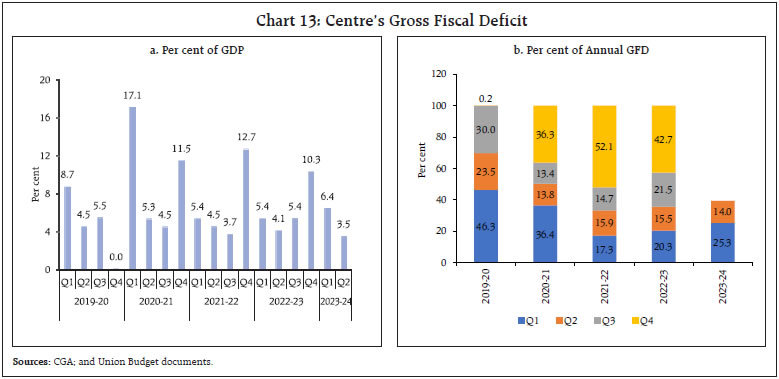
Box 2: Changing Quarterly Trend in the Gross Fiscal Deficit of the Union Government The quarterly trends in GFD of the Union government has undergone a notable transformation in the recent years. Prior to 2020-21, GFD in the first quarter itself usually crossed 50 per cent of the full year amount, even touching as high as 74.7 per cent in 2017-18, while the fourth quarter saw a minimal fiscal deficit or even an occasional fiscal surplus, resulting in higher borrowing requirements in the first half of the year. However, in the last three fiscal years, there has been a reversal in quarterly distribution of GFD, primarily led by a more even distribution of tax and non-tax revenues. With the introduction of Goods and Services Tax (GST) in 2017-18, indirect taxes have become more uniformly distributed across the quarters. The share of direct taxes has also increased in Q1 which may be attributed to better tax compliance measures enforced by the Centre (Chart B2.a). Within non-tax revenue, with the change in accounting year of the Reserve Bank from July-June to April-March with effect from 2021-22, surplus transfer to the Union government is now credited in the month of May instead of August. Thus, 2021-22 onwards, the Union government has been receiving a relatively larger share of non-tax revenue in the first quarter of each financial year (Chart B2.b). At the same time, total expenditure has moved slightly in the opposite direction with more than one-third of the total expenditure incurred in Q4 during 2020-21 to 2022-23 as against the average of 23.5 per cent during 2014-20 (Chart B2.c). Consequently, there has been a sharp reduction in GFD in the first two quarters; GFD in Q4 now accounts for the largest share of the full year GFD (Chart B2.d). The early influx of tax revenue facilitates more accurate budgeting and forecasting as government agencies can plan their expenditures based on a more reliable estimate of available funds, reducing the risk of budgetary shortfalls. This has also allowed the Union government to give advance instalments of tax devolution to States in the last three fiscal years. A more consistent cash flow throughout the year reduces the government’s reliance on short-term borrowings and results in cost savings due to lower interest payments. | b. Financing of GFD In H1:2023-24, the Union government completed 61.8 per cent of the budgeted net market borrowings for 2023-24. The market borrowings were followed by the utilisation of National Small Savings Fund (NSSF) for financing the GFD of the Union government. The Centre’s decision to stick to its borrowing target for H2:2023-24 signals its confidence of attaining the fiscal deficit target of 5.9 per cent of the GDP. This is attributable to the Centre’s tax revenue that has been growing at a robust pace apart from the more than anticipated collections on the non-tax front. State Government a. Fiscal Deficit States had budgeted a consolidated GFD of 3.1 per cent of GDP for 2023-24 (BE), down from 3.4 per cent in 2022-23 (RE). During 2023-24, States have exhausted a lower proportion of their budgeted GFD in Q1, while in Q2, the GFD has been higher. Correspondingly, the fiscal space available to States in the latter half of 2023-24 has been reduced to 60.2 per cent of their budgeted GFD from 69.9 per cent for the corresponding period of the previous year (Chart 14 a and b). The quality of expenditure [as measured by the revenue expenditure to capital outlay (RECO) ratio21] for the Centre improved in H1:2023-24, attributed to the higher thrust placed by the Central government on capital expenditure.22 On similar lines, the expenditure quality of the States has been continuously improving in the post-pandemic period. In Q1 and Q2 of 2023-24, their RECO ratio reduced to 7.3 and 5.6, respectively, from 11.6 and 7.2 in the corresponding period of the previous year (Chart 15 a and b). b. Financing of GFD The net market borrowings of the States during H1:2023-24 witnessed a y-o-y decline of 23.1 per cent and accounted for only 24.8 per cent of their BE (33.7 per cent during H1:2022-23). Eight States had zero or negative net borrowing in H1:2023-24. Gross market borrowings, however, were 9.0 per cent higher than last year (Chart 16 a and b). The financial accommodation availed by the States under various facilities provided by the Reserve Bank increased by 61.1 per cent (y-o-y) during H1:2023-24. The average amount availed by the States under Ways and Means Advances (WMA), and Special Drawing Facility (SDF) increased by 14.9 per cent and 115.4 per cent, respectively, while the Overdraft (OD) availment declined by 15.8 per cent. Himachal Pradesh, Manipur, Mizoram and Nagaland decreased their daily utilisation of WMA in H1:2023-24 over the same period in the previous year (Chart 17 a and b).
IV. General Government Finances The general government GFD for 2023-24 is budgeted at 8.6 per cent of GDP as compared with 9.5 per cent of GDP in 2022-23(RE). In continuation of the effort to provide timely fiscal data on the general government, the quarterly fiscal position of the general government has been compiled till Q2:2023-24. Improved revenue mobilisation by the Centre and States kept the general government GFD in Q1 and Q2 of 2023-24 in line with the previous year’s trends. Going forward, while tax collections are expected to remain buoyant in H2, a pick-up in expenditure by the Centre and States could result in a general government deficit of 8.2 per cent and 11.9 per cent of GDP in Q3 and Q4 (projected), respectively (Chart 18). V. Conclusion The combined finances of the Centre and the States remained robust in H1:2023-24. The Centre recorded robust tax collections, both direct and indirect taxes reflecting sustained recovery of the economy, enhanced tax governance and administration as well as improved profitability of the corporate sector. Lower disinvestment receipts are likely to be offset by sharp gains in non-tax revenues, mainly attributable to higher dividends from the Reserve Bank and other financial institutions. On the expenditure front, the capex thrust has ensured significant improvement in the quality of expenditure of the Central government. By reiterating its GFD target of 4.5 per cent of GDP by 2025-26, the Centre has exhibited its firm commitment to fiscal consolidation while at the same time prioritising capital expenditure to drive the recovery in growth and create a virtuous cycle to crowd in private investment. The Centre achieved more than half of its budgeted revenue in H1:2023-24 while containing its expenditure to less than half of what it had projected for the entire financial year. This would augur well for the Centre to meet its GFD target of 5.9 per cent of GDP for 2023-24. The States too have witnessed strengthening of their fiscal parameters as is evident from their continued buoyancy in tax revenues. Notably, they have also increased their capital spending in line with the Centre’s stance to front-load capex, by using both central funds linked to reforms and their own resources. However, the States grapple with several challenges in sustaining the momentum of their capital expenditure, on both the expenditure and revenue fronts. The reversion to the old pension scheme (OPS) by a few States and reports of some other States moving in the same direction would exert a huge burden on State finances and restrict their capacity to undertake growth enhancing capital expenditures. Given the discontinuation of GST compensation, continued buoyancy of tax revenues is critical alongside fiscal prudence while maintaining the quality of expenditure and concurrently expanding their fiscal capacity. This would augur well for bolstering medium-term growth prospects while maintaining fiscal sustainability.
Appendix Tables | Table I: Budgetary Position of the Central Government during April-September | | Item | (₹ thousand crore) | (Per cent) | | Actuals | Budget Estimates | Percent of BE | Y-o-Y Growth Rate | | 2023-24 | 2022-23 | 2023-24 | 2022-23 | 2023-24 | 2022-23 | 2023-24 | 2022-23 | | (1) | (2) | (3) | (4) | (5) | (6) | (7) | (8) | (9) | | 1. Revenue Receipts | 1397.1 | 1169.6 | 2632.3 | 2204.4 | 53.1 | 53.1 | 19.5 | 8.2 | | 1.1. Net Tax Revenue | 1160.3 | 1012.0 | 2330.6 | 1934.7 | 49.8 | 52.3 | 14.7 | 9.9 | | 1.2. Non-Tax Revenue | 236.8 | 157.6 | 301.7 | 269.7 | 78.5 | 58.4 | 50.2 | -1.7 | | 1.3. Interest Receipts | 17.3 | 12.5 | 24.8 | 18.0 | 69.7 | 69.4 | 38.7 | 21.1 | | 2. Capital Receipts | 20.2 | 34.2 | 84.0 | 79.3 | 24.0 | 43.1 | -41.0 | 88.7 | | 2.1. Recovery of Loans | 13.2 | 9.6 | 23.0 | 14.3 | 57.5 | 67.2 | 37.7 | 6.6 | | 2.2. Other Receipts | 7.0 | 24.6 | 61.0 | 65.0 | 11.4 | 37.8 | -71.7 | 169.8 | | 3. Total Receipts (1+2) | 1417.3 | 1203.7 | 2716.3 | 2283.7 | 52.2 | 52.7 | 17.7 | 9.5 | | 4. Revenue Expenditure | 1628.5 | 1480.7 | 3502.1 | 3194.7 | 46.5 | 46.3 | 10.0 | 6.0 | | of which | | | | | | | | | | (i) Interest Payments | 484.3 | 436.7 | 1080.0 | 940.7 | 44.8 | 46.4 | 10.9 | 19.6 | | 5. Capital Expenditure | 490.6 | 342.9 | 1001.0 | 750.2 | 49.0 | 45.7 | 43.1 | 49.5 | | of which | | | | | | | | | | (i) Loans and Advances | 74.8 | 23.6 | 163.8 | 140.1 | 45.7 | 16.8 | 217.5 | 20.8 | | 6. Total Expenditure (4+5) | 2119.1 | 1823.6 | 4503.1 | 3944.9 | 47.1 | 46.2 | 16.2 | 12.2 | | 7. Revenue Deficit (4-1) | 231.4 | 311.1 | 869.9 | 990.2 | 26.6 | 31.4 | -25.6 | -1.4 | | 8. Fiscal Deficit (6-3) | 701.9 | 619.8 | 1786.8 | 1661.2 | 39.3 | 37.3 | 13.2 | 17.7 | | 9. Gross Primary Deficit {8-4(i)} | 217.5 | 183.2 | 706.8 | 720.5 | 30.8 | 25.4 | 18.8 | 12.3 | | Source: Office of Controller General of Accounts, Ministry of Finance, Government of India. |
| Table II: Quarterly Position of the Central Government Finances | | Item | (₹ thousand crore) | (Per cent) | | Q1 | Q2 | Per cent of BE | Y-o-Y Growth Rate | | Q1 | Q2 | 2023-24 | | 2023-24 | 2022-23 | 2023-24 | 2022-23 | 2023-24 | 2022-23 | 2023-24 | 2022-23 | Q1 | Q2 | | (1) | (2) | (3) | (4) | (5) | (6) | (7) | (8) | (9) | (10) | (11) | | 1. Revenue Receipts | 588.6 | 568.1 | 808.5 | 601.5 | 22.4 | 25.8 | 30.7 | 27.3 | 3.6 | 34.4 | | 1.1. Net Tax Revenue | 433.6 | 505.9 | 726.7 | 506.1 | 18.6 | 26.1 | 31.2 | 26.2 | -14.3 | 43.6 | | 1.2. Non-Tax Revenue | 155.0 | 62.2 | 81.8 | 95.4 | 51.4 | 23.1 | 27.1 | 35.4 | 149.3 | -14.3 | | 1.3. Interest Receipts | 9.5 | 5.1 | 7.8 | 7.4 | 38.5 | 28.1 | 31.3 | 41.3 | 88.8 | 4.5 | | 2. Capital Receipts | 10.7 | 28.0 | 9.5 | 6.2 | 12.7 | 35.3 | 11.3 | 7.8 | -61.8 | 52.5 | | 2.1. Recovery of Loans | 6.5 | 3.4 | 6.7 | 6.2 | 28.1 | 24.0 | 29.3 | 43.2 | 89.0 | 9.3 | | 2.2. Other Receipts | 4.2 | 24.6 | 2.7 | 0.0 | 6.9 | 37.8 | 4.5 | 0.0 | -82.8 | 8658.1 | | 3. Total Receipts | 599.3 | 596.0 | 818.0 | 607.7 | 22.1 | 26.1 | 30.1 | 26.6 | 0.5 | 34.6 | | 4. Revenue Expenditure | 772.2 | 772.8 | 856.3 | 707.9 | 22.0 | 24.2 | 24.5 | 22.2 | -0.1 | 21.0 | | of which | | | | | | | | | | | | (i) Interest Payments | 243.7 | 228.6 | 240.6 | 208.1 | 22.6 | 24.3 | 22.3 | 22.1 | 6.6 | 15.6 | | 5. Capital Expenditure | 278.5 | 175.1 | 212.1 | 167.8 | 27.8 | 23.3 | 21.2 | 22.4 | 59.1 | 26.4 | | of which | | | | | | | | | | | | (i) Loans and Advances | 44.6 | 14.1 | 30.2 | 9.5 | 27.2 | 10.1 | 18.4 | 6.8 | 216.3 | 219.4 | | (ii) Capital Outlay | 233.9 | 161.0 | 181.9 | 158.4 | 27.9 | 26.4 | 21.7 | 26.0 | 45.3 | 14.9 | | 6. Total Expenditure | 1050.7 | 947.9 | 1068.5 | 875.7 | 23.3 | 24.0 | 23.7 | 22.2 | 10.8 | 22.0 | | 7. Revenue Deficit (4-1) | 183.6 | 204.8 | 47.8 | 106.4 | 21.1 | 20.7 | 5.5 | 10.7 | -10.4 | -55.1 | | 8. Fiscal Deficit (6-3) | 451.4 | 351.9 | 250.5 | 268.0 | 25.3 | 21.2 | 14.0 | 16.1 | 28.3 | -6.5 | | 9. Gross Primary Deficit {8-4(i)} | 207.7 | 123.3 | 9.9 | 59.9 | 29.4 | 17.1 | 1.4 | 8.3 | 68.5 | -83.5 | | Source: Office of Controller General of Accounts, Ministry of Finance, Government of India. |
| Table III: Budgetary Position of the State Governments during April-September 2023 | | Item | (₹ thousand crore) | (Per cent) | | Actuals | Budget Estimates | Per cent of BE | Y-o-Y Growth Rate | | 2022-23 | 2023-24 | 2022-23 | 2023-24 | 2022-23 | 2023-24 | 2022-23 | 2023-24 | | 1 | 2 | 3 | 4 | 5 | 6 | 7 | 8 | 9 | | 1. Revenue Receipts | 1,499.9 | 1,625.0 | 3,627.6 | 4,064.2 | 41.3 | 40.0 | 26.2 | 8.3 | | 1.1. Tax Revenue | 1,141.9 | 1,308.7 | 2,514.4 | 3,025.2 | 45.4 | 43.3 | 32.4 | 14.6 | | 1.2. Non-Tax Revenue | 112.5 | 134.5 | 305.8 | 332.3 | 36.8 | 40.5 | 33.5 | 19.6 | | 1.3. Grants-in-aid and Contributions | 245.5 | 181.9 | 807.5 | 706.7 | 30.4 | 25.7 | 1.4 | -25.9 | | 2. Capital Receipts | 3.5 | 4.0 | 19.8 | 42.8 | 17.7 | 9.4 | -25.0 | 15.4 | | 2.1. Recovery of Loans and Advances | 3.4 | 3.7 | 13.8 | 18.9 | 24.7 | 19.4 | -25.3 | 8.2 | | 2.2. Other Receipts | 0.1 | 0.4 | 6.0 | 23.9 | 1.5 | 1.5 | -7.8 | 285.0 | | 3. Total Receipts | 1,503.4 | 1,629.0 | 3,647.4 | 4,107.0 | 41.2 | 39.7 | 26.0 | 8.4 | | 4. Revenue Expenditure | 1,558.0 | 1,697.4 | 3,753.9 | 4,137.0 | 41.5 | 41.0 | 16.3 | 8.9 | | 4.1 Interest Payments | 188.9 | 211.2 | 455.6 | 501.8 | 41.5 | 42.1 | 20.6 | 11.8 | | 5. Capital Expenditure | 201.0 | 296.1 | 742.8 | 885.4 | 27.1 | 33.4 | 7.5 | 47.3 | | 5.1 Capital Outlay | 177.4 | 270.7 | 683.1 | 801.9 | 26.0 | 33.8 | 2.9 | 52.6 | | 6. Total Expenditure | 1,758.9 | 1,993.5 | 4,496.6 | 5,022.4 | 39.1 | 39.7 | 15.2 | 13.3 | | 7. Revenue Deficit (4-1) | 58.1 | 72.4 | 126.2 | 72.8 | 46.0 | 99.4 | -61.5 | 24.6 | | 8. Fiscal Deficit (6-3) | 255.6 | 364.4 | 849.2 | 915.4 | 30.1 | 39.8 | -23.3 | 42.6 | | 9. Gross Primary Deficit (8 - 4.1) | 66.6 | 153.2 | 393.6 | 413.6 | 16.9 | 37.0 | -62.3 | 129.9 | Note: Data pertains to 25 States.
Sources: Comptroller and Auditor General of India; and Budget documents of the States. |
| Table IV: Quarterly Position of State Government Finances | | Item | (₹ thousand crore) | (Per cent) | | Actuals | Per cent of BE | Y-o-Y Growth Rate | | Q1 | Q2 | Q1 | Q2 | 2023-24 | | 2022-23 | 2023-24 | 2022-23 | 2023-24 | 2022-23 | 2023-24 | 2022-23 | 2023-24 | Q1 | Q2 | | 1. Revenue Receipts | 715.8 | 825.2 | 784.1 | 799.8 | 19.7 | 20.3 | 21.6 | 19.7 | 15.3 | 2.0 | | 1.1. Tax Revenue | 523.2 | 640.2 | 618.7 | 668.5 | 20.8 | 21.2 | 24.6 | 22.1 | 22.4 | 8.1 | | 1.2. Non-Tax Revenue | 59.8 | 53.9 | 52.7 | 80.6 | 19.5 | 16.2 | 17.2 | 24.3 | -9.9 | 52.9 | | 1.3. Grants-in-aid and Contributions | 132.8 | 131.1 | 112.7 | 50.8 | 16.4 | 18.6 | 14.0 | 7.2 | -1.3 | -55.0 | | 2. Capital Receipts | 2.1 | 1.8 | 1.4 | 2.2 | 10.4 | 4.2 | 7.3 | 5.2 | -12.0 | 54.8 | | 2.1. Recovery of Loans and Advances | 2.0 | 1.7 | 1.4 | 1.9 | 14.8 | 9.2 | 9.9 | 10.2 | -14.2 | 41.6 | | 2.2. Other Receipts | 0.0 | 0.1 | 0.1 | 0.3 | 0.3 | 0.3 | 1.2 | 1.2 | 208.1 | 306.6 | | 3. Total Receipts | 717.9 | 827.0 | 785.5 | 802.0 | 19.7 | 20.1 | 21.5 | 19.5 | 15.2 | 2.1 | | 4. Revenue Expenditure | 728.7 | 785.4 | 829.2 | 912.0 | 19.4 | 19.0 | 22.1 | 22.0 | 7.8 | 10.0 | | 4.1 Interest Payments | 83.0 | 87.9 | 105.9 | 123.4 | 18.2 | 17.5 | 23.3 | 24.6 | 5.9 | 16.4 | | 5. Capital Expenditure | 71.1 | 122.6 | 129.9 | 173.5 | 9.6 | 13.8 | 17.5 | 19.6 | 72.4 | 33.6 | | 5.1. Capital Outlay | 62.6 | 108.1 | 114.8 | 162.5 | 9.2 | 13.5 | 16.8 | 20.3 | 72.9 | 41.5 | | 6. Total Expenditure | 799.8 | 907.9 | 959.1 | 1,085.5 | 17.8 | 18.1 | 21.3 | 21.6 | 13.5 | 13.2 | | 7. Revenue Deficit | 12.9 | -39.8 | 45.2 | 112.2 | 10.2 | -54.7 | 35.8 | 154.0 | -408.3 | 148.4 | | 8. Fiscal Deficit (6-3) | 82.0 | 80.9 | 173.6 | 283.5 | 9.7 | 8.8 | 20.4 | 31.0 | -1.3 | 63.3 | | 9. Gross Primary Deficit (8 - 4.1) | -1.0 | -6.9 | 67.7 | 160.1 | -0.3 | -1.7 | 17.2 | 38.7 | 588.8 | 136.7 | Note: Data pertains to 25 States.
Sources: Comptroller and Auditor General of India; and Budget documents of the States. |
|