The world economy faces divergent near-term growth prospects. Emerging market economies led by Asia are poised to outperform the rest of the world. The Indian economy recorded stronger than expected growth in 2023-24, un-derpinned by a shift from consumption to investment. The government’s thrust on capex is starting to crowd-in private investment. Headline inflation recorded a marginal uptick in December, driven by higher food inflation due to unfa-vourable base effects. Introduction 2024 marks a leap in time, adjusting for all those seconds that accumulated over the preceding three years due to the revolution of the earth around the sun. With 2023 ending on a high note despite formidable odds, there are several things to cheer about in 2024. First, projections are being consistently proved pessimistic by incoming data. Projections of global growth that are currently converging well below 3 per cent for 2024 may once again be belied on the upside. Second, the global economy has displayed an extraordinary resilience, enduring wars, tight financial conditions and havoc-wreaking climate change. Economies across the world are adapting better than expected and this provides a strong bedrock for the year ahead. Third, with food and energy prices on the ebb – crude prices fell in spite of production cuts, although they are jittery on tensions in the Red Sea through which 12 per cent of seaborne oil trade and 8 per cent of liquified natural gas trade flows - the genie of inflation is being bottled. Central banks are pausing in their unrelenting tightening cycle, signalling to euphoric markets that interest rates have peaked and 2024 may well see cuts sooner than later. Central banks are being anointed once again as saviours of the world. Investors also hope that the winding down of their balance sheets through quantitative tightening may slow down. Economies that are sagging today may look forward to milder outcomes in 2024 as the widely predicted recession has failed to occur. Generative artificial intelligence is the flavour of the times. Global trade growth, which had flatlined in 2023, is expected to recover in 2024, although it will likely remain below its pre-pandemic trend. According to the World Bank, the expected upturn in trade volume will reflect a recovery in the demand for goods.1 International tourism has been showing signs of a robust recovery, particularly in Asia, and is expected to reach pre-pandemic levels by 2024. There is an emerging trend of realignment in international trade relations, with countries seeking to secure supply chains closer to home or from more resilient sources. According to the World Trade Organization, trade measures introduced by G20 economies have become more restrictive in recent months than trade-facilitating, although the value of traded merchandise covered by facilitating measures continued to exceed that covered by restrictions.2 Be that as it may, a structural shift in international trade is underway and supply chains are at its heart. Increasingly, trading nations are focusing on security, be it food, water, energy, cyber, financial or operational security. Consequently, they’re reconfiguring supply chains to avoid concentrating sourcing or production in one part of the world. Increasing resilience is the clear and resounding call. Even as economies diversify, new trade corridors are emerging as also more trade agreements with market access provisions. In the financial markets, the prospects of lower borrowing costs and slower central bank selling of treasuries in order to avoid liquidity stresses is acting like a tail wind for bond markets, bringing yields off their 2023 highs. The US dollar is trading below critical resistance levels, and this has lifted the downward pressures weighing down other currencies through 2023. Markets remain on edge, however, and turn volatile whenever data releases point to abiding strength of economic activity that may push away rate cuts further into 2024 or even beyond. The growing optimism is propelling stock markets to new records, funnelling money into corporate debt, even lower-quality paper, and spreads are getting compressed. While the developing world faces divergent near-term growth prospects, emerging market economies (EMEs) led by Asia are poised to outperform the rest of the world as the US dollar weakens and the outlook for global interest rates turns benign. Many of them are rushing to issue debt, taking advantage of the new risk-on appetite suffusing investors, and the fact that the average emerging market yield has fallen by about 150 basis points.3 Issuances have so far been restricted to investment-grade sovereigns. Global EM debt funds have once again started to attract inflows. On the flip side, still high borrowing costs and accumulated currency depreciations keep debt sustainability risks high in many of them. This is of concern at a time when they need additional external financing to stimulate investment and growth, address climate change related risks and accelerate progress towards sustainable development goals. Countries accounting for more than half of the market capitalisation of the Morgan Stanley Capital International (MSCI) emerging market index will see general elections in 2024. Investors wait to exhale as political winds sweep over the fortunes of EMEs. The world’s hottest year since 1901 is behind us, but the heavy rainfall, disastrous floods and raging wildfires it spawned may well continue in 2024, according to the European Union’s Copernicus Climate Change Service. It is believed that the 1.5 degrees Celsius threshold will be breached again this year. Tighter supplies of food staples are expected amidst El Nino conditions that are forecast to continue in the first half of 2024, putting at risk production of rice, wheat, palm oil and other farm products in some of the world’s top agricultural exporters and importers. It is in this context that the 2024 UN Climate Change Conference (UNFCCC COP 29) that will convene in Baku, Azerbaijan, in November 2024 assumes importance. It will include the 29th session of the Conference of the Parties (COP 29), the 19th meeting of the COP serving as the Meeting of the Parties to the Kyoto Protocol (CMP 19), and the sixth meeting of the COP serving as the Meeting of the Parties to the Paris Agreement (CMA 6). It is expected to complete the first enhanced transparency framework and the new collective quantified goal on finance. In fact, it is not until COP 29 that countries are due to agree to replace the USD 100 billion per year goal for climate finance from developed countries to developing countries. In view of the growing gap estimated at almost US $7.5 trillion up to 2030 between the needs of developing countries facing increasing climate impacts and the help provided for them to achieve their climate goals, setting the stage for finance will become the key issue for 2024. On the National Statistical Office’s (NSO’s) first advance estimates of India’s national income for 2023-24 which are discussed more fully in Section III, it has been presciently pointed out that the upside surprise in the NSO’s estimate is underpinned by a shift from consumption to investment, with the government’s thrust on capex starting to crowd-in private investment4 as high corporate profitability quarter after quarter has begun to induce the creation of fixed assets. The housing market is seeing its highest sales in more than a decade and real estate is exhibiting remarkable resilience and adaptability. Anecdotal evidence points to home renters becoming owners of bigger homes – a development that is widely expected to become a trend. The rate of real fixed investment is at a historic high in 2023-24; this augurs well for enhancing the productive capacity of the economy and hence its potential. With the current account deficit remaining modest, domestic saving is financing growth in India in a world buffeted by daunting headwinds. On the flip side, private consumption, which accounts for 57 per cent of GDP, languished in the backwash of the slow but steady revival of the rural economy. This only serves to underscore our consistently held view that inflation has to be restrained to its target for growth to be inclusive and sustained. In fact, in the fast moving consumer goods space, companies are reporting a faster growth of volumes than of value despite lower than expected festival spending and a higher pass-through of lower raw material costs by producers to consumers. Spillovers to gross value added by trade are also showing up in the NSO’s first advance estimates. The inflation outcome for December 2023 needs to be carefully parsed to gauge the underlying dynamics. First, the increase in headline inflation by 14 basis points over the November reading was due to legacy effects of inflation’s history - an unfavourable base effect of 45 basis points stemming from a commensurate month-on-month decline in December last year that gets automatically incorporated into year-on-year calculation in which India’s inflation is typically expressed. The way around these historical base effects is to calculate inflation as the seasonally adjusted month-on-month annualised rate. Second, December is a time when winter’s bounty causes a seasonal decline in vegetable prices. This year’s dip turned out to be underwhelming, however, because of the delayed correction in onion and tomato prices. Hence seasonal adjustment may not be a panacea if underlying inflation dynamics have to be understood. Not adjusting for seasonality but taking out base effects, the month-on-month annualised CPI inflation rate for December shows a decline of 3.8 per cent from a similarly calculated inflation rate of 6.7 per cent in November. The slowdown in exports has emerged as a drag on growth, but the outlook is lighting up at new frontiers. India is rapidly emerging as a global leader in hosting global capability centres (GCCs). The primary catalyst is the preference global corporations have towards owning their resources and locating them in India which boasts quality real estate, competitive rental rates, an extraordinary talent pool, and a consistently growing economy. The result is worldwide delivery of a range of solutions around back-office support and IT functions, location assessment, recruitment and human resources support. The share of GCCs in the total office real estate transactions rose to 35 per cent in 2023. It is estimated that by 2025, India will have 1900 GCCs with a market size of US $ 60 billion.5 Another comparative advantage for India is the surging data centre capacity, which is poised to exceed one gigawatt by 2024 and position the country as a global data centre hub. This development has positive implications for foreign direct investment which has started turning around in the second half of 2023-24 and is flowing increasingly into business services. Turning to the financial sector, the RBI’s latest assessment of the performance of the banking sector, including co-operative banks, and non-banking financial institutions6 points to a steady expansion in the consolidated balance sheet of the scheduled commercial banks (SCBs), driven by credit to retail and services sectors. Higher net interest income and lower provisioning boosted net interest margins (NIMs) and profitability. The capital to risk weighted assets ratio (CRAR) of SCBs was 16.8 per cent at end-September 2023, with all bank groups meeting the regulatory minimum requirement and the common equity tier 1 (CET1) ratio requirement comfortably. There has been a steady improvement in asset quality, with the gross non-performing assets (GNPA) ratio at 3.2 per cent at end-September 2023. The consolidated balance sheet of non-banking financial companies (NBFCs) also expanded, led by double digit credit growth while profitability and asset quality improved and CRARs remained higher than the regulatory requirement. Looking ahead, the report flagged the increasing interconnectedness between banks and NBFCs, with the latter needing to broad base their funding sources and reduce overdependence on bank funding. Banks and non-banks need to bring in greater empathy in their customer services, while making concerted efforts to protect them and the payments system from the risks of fraud and data breaches emanating from cyber threats. Both banks and NBFCs need to further strengthen their balance sheets through robust governance and risk management practices to meet the growing aspirations of the Indian economy. The RBI’s semi-annual Financial Stability Report (FSR) of December 20237 also assessed the domestic financial system to be resilient, supported by strong macroeconomic fundamentals, healthy balance sheets of financial institutions, moderating inflation, improving external sector position and continuing fiscal consolidation. Macro stress tests for credit risk reveal that SCBs would be able to comply with minimum capital requirements, with the system-level CRAR in September 2024 projected at 14.8 per cent, 13.5 per cent and 12.2 per cent, respectively, under baseline, medium and severe stress scenarios. The consolidated solvency ratio of the insurance sector remains above the minimum threshold limit of 150 per cent. Domestic regulatory initiatives, conditioned by the fast-changing macro-financial environment, have been aimed at improving the robustness and resilience of the financial system. Regulatory measures focussed on stemming systemic risk, reducing regulatory arbitrage, expanding secure digitalisation, improving efficiency of markets, ensuring customer protection and expanding access to finance. Regulators remain vigilant to the rapidly changing economic environment in order to ensure the efficiency and soundness of the financial system. Set against this backdrop, the remainder of the article is structured into four sections. Section II covers the rapidly evolving developments in the global economy. An assessment of domestic macroeconomic conditions is set out in Section III. Section IV encapsulates financial conditions in India, while the last Section sets out concluding remarks. II. Global Setting Global economic activity turned out to be stronger than expected in 2023. It is projected to slow down in 2024 with considerable cross-country heterogeneity. In its latest Global Economic Prospects (GEP), the World Bank has projected global growth to ebb from an estimated 3.0 per cent in 2023 to 2.9 per cent in 2024, marking the third consecutive year of deceleration. The weaker outlook reflects the combined effects of the dampening of demand due to tight monetary policy, restrictive credit conditions, softening labor markets, reduced savings buffers, the waning of the revenge spending on services and lacklustre global trade and investment (Table II.1). Growth in AEs is expected to bottom out at 1.2 per cent in 2024 from 1.5 per cent in 2023 while emerging market and developing economies (EMDEs) are expected grow by 3.9 per cent in 2024. Our model based nowcast points to global growth momentum losing steam in Q4:2023 (Chart II.1). Geopolitical risks remain elevated, posing both upside risks to commodity prices and downside risks to growth (Chart II.2). Freight charges have suddenly come under renewed pressure due to hostilities around the Red Sea8 (Chart II.3a). Nonetheless, the global supply chain pressures index (GSCPI) remained below its historical average in December (Chart II.3b). Festival spending in December lifted consumer sentiments in the US, the UK and the euro area. Financial conditions also eased marginally in the US and the euro area during the month, reflecting expectations of central banks embarking on policy rate cuts sooner than previously anticipated (Chart II.4).
The global composite purchasing managers index (PMI) increased to 51.0 in December 2023 - its highest reading since July 2023 - from 50.5 in November, supported by improved inflows of new work and a surge in business confidence. The services PMI remained in expansion, buoyed by a sequential improvement. Global manufacturing activity remained tepid, with the PMI declining further to 49.0 in December, recording a contraction for the sixteenth consecutive month (Chart II.5). New business intakes declined across consumer, intermediate and investment goods industries. 
 Global trade in goods and services grew at a tardy pace of 0.2 per cent in 2023 – the slowest expansion outside global recessions in the past 50 years. Significant headwinds continue to prevail – PMIs for new export orders remained in the contractionary zone in December as export orders for both services and manufacturing recorded sequential declines (Chart II.6). The World Bank has, however, projected global trade to pick up to 2.3 per cent in 2024. In December, global commodity prices eased, primarily driven by energy prices. The Bloomberg Commodity Price Index fell by 3.1 per cent (m-o-m) [Chart II.7a]. Crude oil prices declined in the first half of December due to record production in the US, although disruptions in the Red Sea vessel traffic, alluded to in the introductory section, imposed uncertainty and upward pressure on prices in the second half. Nonetheless, crude oil prices ended the month with a m-o-m decline of 6 per cent (Chart II.7b). The Food and Agriculture Organization’s (FAO’s) food price index recorded a decline of 1.5 per cent in December, driven down by falling sugar, vegetable oils and meat prices, more than offsetting the increases in prices of dairy products and cereals (Chart II.7c). Gold prices edged up further in December for the fourth consecutive month in sync with rising safe haven demand on a weaker US dollar and lower treasury yields (Chart II.7d). 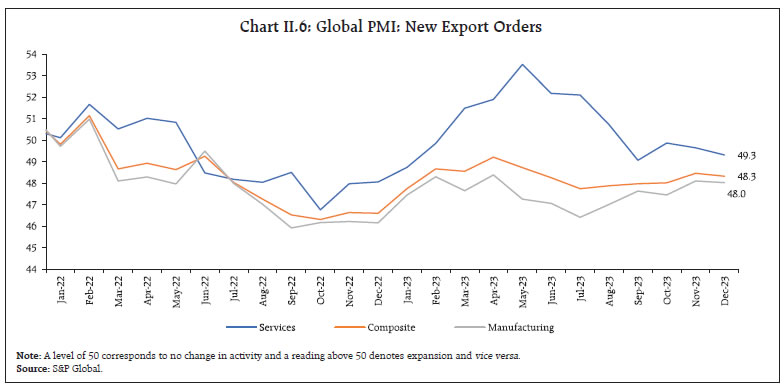 Globally, headline consumer price inflation declined substantially through 2023 but it continues to remain above target in most inflation-targeting AEs and about half of inflation-targeting EMEs. According to the World Bank, global headline inflation is expected to moderate further over 2024-25, with core inflation slowing and commodity prices declining, but it is expected to remain above its pre-pandemic average beyond 2024. December saw a marginal uptick in inflation in major economies such as the US and Euro area. Bucking the declining trajectory over the previous two months, CPI inflation in the US rose to 3.4 per cent in December from 3.1 per cent in November. As per the Fed’s preferred measure - the personal consumption expenditure (PCE) - headline inflation was 2.6 per cent (y-o-y) in November 2023, the lowest since February 2021. Euro area inflation also rose to 2.9 per cent in December (flash estimates) from 2.4 per cent in November with phasing out of energy subsidies (Chart II.8a). In the UK, CPI inflation moderated to 3.9 per cent in November from 4.6 percent in October while Japan’s inflation (CPI excluding fresh food) moderated to 2.5 per cent in November 2023, its lowest reading since July 2022. Among the emerging market economies (EMEs), inflation moderated in Russia and Brazil in November while China recorded a deflation of 0.3 per cent in December (Chart II.8b). Despite the recent moderation in core inflation in AEs, it continues to remain above headline inflation (Chart II.8c and II.8d). 
 Global equity markets ended 2023 on an ebullient note and the MSCI world index surged 4.7 per cent (m-o-m) in December, reflecting gains in both AEs and EMEs as investors bet on systemic central banks embarking on rapid interest rate cuts in 2024 (Chart II.9a). Sovereign bond yields moderated across the globe, with the US 10-year G-sec yield declining by 45 bps in December to below 4 per cent (Chart II.9b). In the currency markets, the dollar index depreciated by 2 per cent (m-o-m) in December. The MSCI currency index for EMEs went up by 1.5 per cent in December as capital inflows, mostly into the equity segment, remained robust (Chart II.9c and II.9d). As inflation pressures wane, several central banks are signalling a pivot towards policy rate cuts in 2024 although the timing and magnitude of rate cuts are subject to considerable uncertainty. In December, most AE central banks kept their policy rates steady, while Israel cut its benchmark rates by 25 bps in January 2024 (Chart II.10a). Among EMEs, Chile and Hungary reduced their policy rates by 75 bps each while Columbia lowered its key rate by 25 bps in December 2023. Peru continued to cut rates by 25 bps in its January 2024 meeting (Chart II.10b).
III. Domestic Developments In India, economic activity remained resilient on the back of robust domestic demand, notwithstanding the external headwinds. Supply chain pressures in India ebbed in December and remained below historical average levels (Chart III.1a). Our economic activity index (EAI) nowcasts GDP growth for Q3:2023-24 at 7 per cent (Chart III.1b and III.1c). Aggregate Demand The first advance estimates (FAE) of national income released by the NSO on January 5, 2024 placed the real gross domestic product (GDP) growth for 2023-24 at 7.3 per cent, up from 7.2 per cent in the preceding year (Chart III.2). Among the components of real GDP, growth in private final consumption expenditure (PFCE) moderated to 4.4 per cent from 7.5 per cent a year ago, primarily due to the drag from rural demand owing to lower kharif production. Urban demand, on the other hand, remained robust on the back of higher disposable income, led by robust growth in salaries and wages. Government final consumption expenditure (GFCE) growth at 4.1 per cent recorded an uptick over the previous year. Gross fixed capital formation (GFCF) remained strong, with growth of 10.3 per cent in 2023-24. The government’s sustained thrust on capital expenditure along with ebullience in residential housing underpinned the strength of investment. Hence, the ratio of real GFCF to GDP increased to 34.9 per cent in 2023-24. India’s export growth, tapered to 1.4 per cent in 2023-24 (April-November), primarily on account of sluggish merchandise exports, while services exports registered steady growth. As the growth in imports far outpaced the growth in exports, external demand dragged down overall growth of the economy. 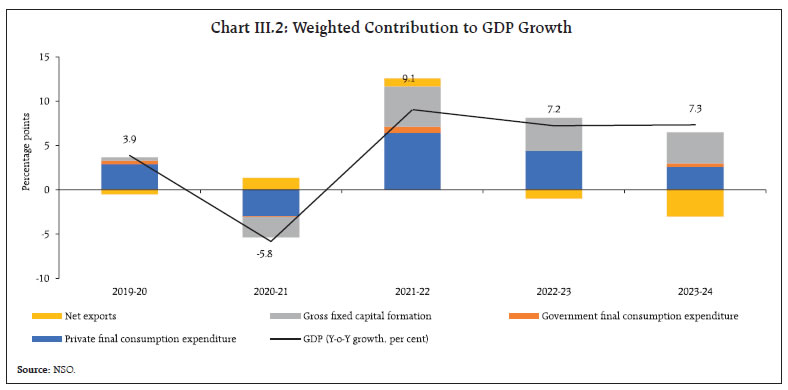
 Evidence from high frequency indicators point towards the sustained strength in demand conditions in Q3: 2023-24 and the first half of January 2024. E-way bills posted a growth of 13.2 per cent in December 2023 (Chart III.3a). Toll collection reached a series high, expanding by 18.6 per cent (y-o-y) in December [Chart III.3b]. Automobile sales albeit moderating sequentially, registered an expansion of 14.1 per cent (y-o-y) in December, while two and three-wheeler sales recorded double digit y-o-y growth (Chart III.4a and III.4b). Tractor sales recorded a two-year low in December, and contracted by 19.8 per cent (y-o-y). Vehicle registrations recorded strong y-o-y growth in December following hefty discounts on high inventory models, although the momentum eased post the festival season (Chart III.4c). The consumption of petroleum products grew by 2.6 per cent y-o-y in December (Chart III.4d). The latest survey conducted by the Retailers Association of India9 shows that the retail sales recorded a growth of 7.0 per cent during the festival months of October-November 2023 over the corresponding period last year (Chart III.5). Annual sales growth moderated across all categories, except personal care. Some sectors such as jewellery, sport goods and footwear recorded double digit growth.
As per the data available from the Centre for Monitoring of Indian Economy (CMIE), the all-India unemployment rate (UR) declined to 8.7 per cent in December, driven by lower UR in rural areas even as urban UR recorded an increase (Chart III.6a). The labour force participation rate (LFPR) and employment rate (ER) increased in both urban and rural areas (Chart III.6b). The employment outlook in the organised sector, as polled by the PMIs for manufacturing and services, remained in the expansionary zone (Chart III.7). For services, it recorded a sequential pick-up in December whereas it recorded a m-o-m moderation for manufacturing.
Households’ work demand under the Mahatma Gandhi National Rural Employment Guarantee Scheme (MGNREGS) rose sequentially by 12.9 per cent in December as rabi sowing neared its completion. Recourse to MGNREGS employment remained lower in December 2023 from a year ago, reflecting improved rural employment prospects (Chart III.8). India’s merchandise exports at US$ 38.5 billion registered a growth of 1.0 per cent (y-o-y) in December 2023, a notably high momentum of 13.5 per cent being largely offset by an unfavourable base effect (Chart III.9). Out of 30 major commodities, 17 commodities accounting for 53.9 per cent of the export basket registered expansion on a y-o-y basis. Engineering goods, iron ore, gems and jewellery, electronic goods and drugs and pharmaceuticals supported overall export growth whereas petroleum products, readymade garments of all textiles, rice, other cereals, and marine products were the major laggards (Chart III.10).
Merchandise imports at US$ 58.3 billion recorded a y-o-y decline of 4.8 per cent in December, a negative base effect more than offsetting the positive momentum (Chart III.11). Among the 30 major commodities, 15 commodities accounting for 55.0 per cent of the import basket contracted. Petroleum, oil and lubricants (POL), transport equipment, vegetable oil, fertilisers and chemicals were the main drags while electronic goods, gold, artificial resin, coal and professional instruments contributed positively to overall import growth (Chart III.12).
The merchandise trade deficit narrowed to a 5-month low of US$ 19.8 billion in December 2023 as the sequential increase in exports outstripped imports. With a fall in petroleum exports and a negligible increase in POL imports sequentially, the share of POL in the total merchandise trade balance rose to 40.7 per cent in December 2023 from 36.3 per cent in November (Chart III.13). During April-December 2023, India’s merchandise exports at US$ 317.1 billion contracted by 5.7 per cent (y-o-y). Merchandise imports at US$ 505.1 billion also declined by 7.9 per cent (y-o-y). Consequently, the merchandise trade deficit narrowed to US$ 188.0 billion from US$ 212.3 billion during the corresponding period a year ago. Petroleum products were the major source of the trade deficit, followed by electronic goods (Chart III.14). Global supply chains have been under pressure due to the recent attacks on commercial ships in the Red Sea trade route, necessitating rerouting via the South African Cape of Good Hope. This is raising transit times, freight costs and war-risk premiums. Reflecting these developments, the daily transit trade volume transiting through the Bab el-Mandeb Strait and the Suez Canal has fallen considerably (Chart III.15). According to the IMF, the impact of this disruption was most felt in petroleum, chemical and non-metallic mineral products; mining and quarrying; and agriculture sectors. These developments impart considerable uncertainty to the near-term outlook for India’s merchandise trade.
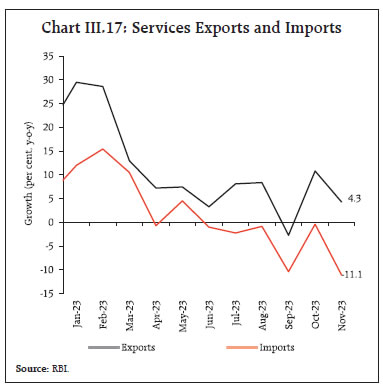
In the context of recent increases in freight costs, it is worth noting that the ratios of transport costs to India’s goods imports and exports stood at 2.8 and 4.8 per cent, respectively, in Q2:2023-24, declining from highs recorded a year ago (Chart III.16). In November 2023, services exports increased by 4.3 per cent on a y-o-y basis to US$ 28.1 billion, led by growth in software services, business services and travel services. On the other hand, services imports declined by 11.1 per cent y-o-y to US$ 13.7 billion, mainly due to a fall in transportation and business services (Chart III.17). As a result, net services earnings improved by 24.8 per cent (y-o-y) to US$ 14.4 billion in November 2023. 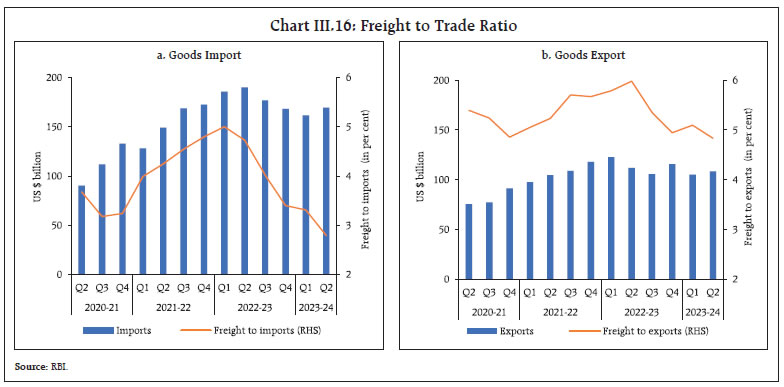
 During April-November 2023-24, the gross fiscal deficit (GFD) of the central government stood at 50.7 per cent of the budget estimates (BE), lower than 58.9 per cent of BE during the corresponding period of the previous year on the back of muted revenue spending and buoyant direct tax revenues. On the expenditure side, capital spending recorded an increase by 31.0 per cent (y-o-y) while revenue expenditure growth was contained at 3.6 per cent (Chart III.18a). Capital outlay (i.e., capital expenditure excluding loans and advances) recorded an increase of 28.6 per cent, resulting in a marked improvement in the quality of spending of the Central government (Chart III.18b). On the receipts side, direct tax collections grew by of 24.6 per cent (y-o-y) during April-November 2023, with income tax and corporate tax collections rising by 29.4 per cent and 20.1 per cent, respectively, reflecting increased compliance, higher advance tax collections and widening of the tax base10,11,12. Indirect tax collections grew by 5.0 per cent (y-o-y), with GST and customs revenues recording a growth of 10.3 per cent and 0.3 per cent, respectively, although excise duties registered a contraction of 7.9 per cent. Overall, gross tax revenue recorded a growth of 14.7 per cent over a year ago (Chart III.19).
Non-tax revenue collection recorded a y-o-y growth of 43.4 per cent during April-November 2023, on the back of higher than budgeted surplus transfer from the Reserve Bank13 while non-debt capital receipts contracted by 38.6 per cent14 (Chart III.20). Total receipts of the Central government recorded a y-o-y expansion of 19.2 per cent. The Union government presented the first batch of supplementary demand for grants in December 2023 for the financial year 2023-24 involving an additional cash outgo of ₹58,378 crore (of which revenue expenditure is ₹53,858 crore and capital expenditure is ₹4,519 crore). However, this additional cash outgo is expected to be compensated by higher revenue collections, limiting its impact on the budgeted fiscal deficit. GST collections (Centre plus States) grew by 10.3 per cent (y-o-y) to ₹1.65 lakh crore in December 2023. The gross GST collection during April-December 2023-24 (₹15.0 lakh crore) was 11.7 percent higher than ₹13.4 lakh crore during the corresponding period of 2022-23 (Chart III.21).
As of November 2023, states’15 gross fiscal deficit reached 50.5 per cent of the BE (Chart III.22a). The revenue deficit widened due to slower growth in revenue receipts relative to revenue expenditures (Chart III.22b). Tax and non-tax revenues also recorded lower growth on a high base. Grants from the Centre contracted following the cessation of GST compensation to States and the tapering of finance commission grants (Chart III.23a). The thrust on capital spending continued with a 42.8 per cent growth in capital expenditure, aided by the Union government’s Scheme for Special Assistance to States for Capital Investment. By November 2023, the Union government had sanctioned ₹97,374 crore (74.9 per cent of the ₹1.3 lakh crore allocated for 2023-24), of which ₹59,030 crore has already been disbursed to the states (Chart III.23b). Aggregate Supply The NSO’s FAE placed the growth of gross value added (GVA) at basic prices at 6.9 per cent for 2023-24, lower than 7.0 per cent in the preceding year (Chart III.24). Growth in agriculture, forestry and fishing moderated to 1.8 per cent in 2023-24 from 4.0 per cent a year ago. The manufacturing sector rebounded with a growth of 6.5 per cent as compared with 1.3 per cent in 2022-23, boosted by higher profit margins of corporates as input cost pressures tapered. Mining and quarrying activity grew robustly due to higher production of coal and natural gas. Electricity, gas, water supply and other utility services registered 8.3 per cent growth in 2023-24 (9.0 per cent in 2022-23). The services sector remained resilient, expanding by 8.1 per cent in 2023-24 on the back of upbeat construction activity and robust financial services. Aided by the government’s thrust on infrastructure and an uptick in the residential housing sector, the growth in construction accelerated further to 10.7 per cent. Trade, hotels, transport, communication, and services growth moderated to 6.3 per cent from 14.0 per cent in the preceding year. Financial, real estate, and professional services remained strong in 2023-24 owing to sustained momentum in bank credit and aggregate deposits. The performance of information technology (IT) companies, however, moderated due to the waning of global demand and higher attrition across firms. The growth in public administration, defence and other services (PADO) remained steady at 7.7 per cent aided by robust expenditure by the Union and the State governments. 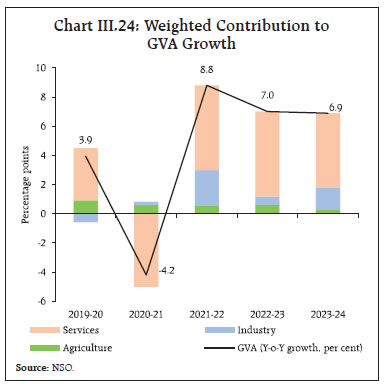 The prospects of the agriculture sector have improved in recent weeks as the rabi sowing deficit narrowed in December, supported by a late pick-up in northeast monsoon rainfall (NEM) (October 01-December 31, 2023), which ended the season 9 per cent below the long period average (LPA) (Chart III.25). As of January 11, 2024 the all-India reservoir level was at 57 per cent of total reservoir capacity, lower than the previous year’s as well as decadal average levels (Chart III.26).
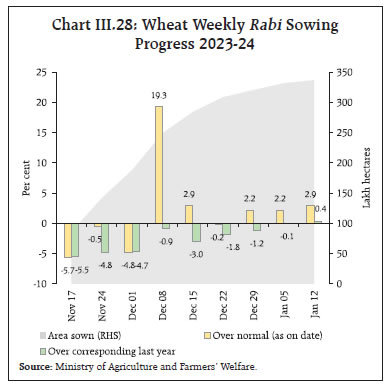
As on January 12, 2024, the total area sown under rabi crops stood at 673.5 lakh hectares (104 per cent of full season normal area), 4.3 per cent higher than the normal acreage but 0.7 per cent lower than that during the same period of the previous year. The area under all major crops except rice and pulses remained higher on a y-o-y basis (Chart III.27). Area sown under wheat, which accounts for 47 per cent of the rabi full season normal area, has progressed well despite the initial lag caused due to late harvesting of kharif crops (Chart III.28). The IMD’s prediction of normal winter rainfall over north India and below normal maximum temperatures over many parts of the central and northwest India augur well for wheat crop production. As on January 01, 2024 the stock of foodgrains with the Food Corporation of India and other public agencies was at 516.5 lakh tonnes (6.8 times the buffer norm) and 163.5 lakh tonnes (1.2 times the norm) for rice and wheat, respectively16. The rice procurement under the kharif marketing season (KMS) 2023-24 stood at 355.3 lakh tonnes, as on January 10, 2024, 8.9 per cent lower than that during last year. Mandi prices of wheat softened significantly during December mainly due to aggressive offloading through e-auctions under the Open Market Sale Scheme (OMSS) and a host of other measures taken by the Government on December 8, 202317 (Chart III.29). The government has offloaded 58.7 lakh tonnes of wheat in e-auctions conducted since June 28, 2023 (up to January 03, 2024). 
 The headline PMI for the manufacturing sector moderated to 54.9 in December 2023 from 56.0 a month ago due to a slowdown in new orders, output, and employment (Chart III.30a). The PMI for services, on the other hand, expanded to a three-month high of 59.0 in December, supported by new business and employment (Chart III.30b).
Cargo traffic at major ports recorded a marginal growth at 0.8 per cent, driven by decline in cargo of POL (Chart III.31a). A pick-up in freight movement of iron ore and coal also resulted in railway freight revenue maintaining the momentum (Chart III.31b). The construction sector emitted mixed signals, with steel consumption posting a growth in December while cement production growth turning negative on a high base in November 2023 (Chart III.32). High frequency indicators for the services sector remained robust in November/December 2023 (Table III.1).
Inflation Headline inflation, as measured by y-o-y changes in the all-India consumer price index (CPI)18, edged up to 5.7 per cent in December 2023 from 5.6 per cent in November (Chart III.33). The 14 bps increase in inflation came primarily from an unfavourable base effect of around 50 basis points which more than offset a negative price momentum of around 30 bps. The negative momentum in overall CPI was on account of a m-o-m decline in food prices by 73 bps. Fuel prices registered a positive momentum of 17 bps and the core group (i.e., excluding food and fuel) witnessed a momentum of just 3 bps. Food inflation (y-o-y) increased to 8.7 per cent in December from 8.0 per cent in November, as negative momentum was more than offset by an unfavourable base effect. In terms of sub-groups, inflation in vegetables increased sharply for the second consecutive month while it moderated in respect of cereals, meat and fish, eggs, spices, milk and non-alcoholic beverages. Inflation in fruits, pulses and prepared meals remained steady, while edible oil prices continued to record deflation (Chart III.34). The fuel and light group recorded a larger deflation of (-) 1.0 per cent in December as compared with (-) 0.8 per cent in November mainly driven by a steep deflation in kerosene (PDS) prices and moderation in firewood and other cooking fuel prices on a y-o-y basis. While LPG prices remained in double digit deflation, electricity price inflation remained in double digits (y-o-y).
Core inflation moderated to 3.8 per cent in December, its lowest print in more than 4 years, from 4.1 per cent in November. The moderation was broad-based, with sub-groups such as clothing and footwear, household goods and services, health, education, personal care and effects, and pan tobacco and intoxicants recording a decline. Inflation in housing, transport and communication, and in recreation and amusement remained steady (Chart III.35). In terms of regional distribution, rural inflation stood at 5.9 per cent, marginally higher than urban inflation (5.5 per cent) in December 2023. Majority of the states faced inflation less than 6 per cent (Chart III.36). Sugar price inflation rose from near zero in December 2022 to 7.9 per cent in December 2023 (Chart III.37). Domestic mills produced 11.2 million tonnes of sugar during October-December 2023, which was lower than 12.1 million tonnes produced during the corresponding period last year. To ensure adequate supply of sugar in the domestic market, the Government has continued the export ban on sugar and also limited the production of ethanol from sugarcane juice and B-heavy molasses to 1.7 million tonnes during the 2023-24 sugar season so far. 
 In case of onion, mandi prices which were increasing significantly, crashed in December on account of increased arrivals from fresh crop harvesting as well as the export ban imposed by the government on December 07, 2023 (Chart III.38). The government has also been augmenting supply by way of aggressive disposal of onion through National Cooperative Consumers’ Federation of India limited (NCCF), National Agricultural Cooperative Marketing Federation of India limited (NAFED), and Kendriya Bhandar and State cooperatives at ₹ 25 per kg from a procured stock of 5.1 lakh tonnes. The government has set a procurement target of 7 lakh tonnes for onion during 2023-24. High frequency food price data for January 2024 so far (up to 12th) indicate that prices of cereals remained steady while prices of pulses and edible oils registered a broad-based decline. Among key vegetables, tomato and onion prices continued to correct in January (Chart III.39).
Retail selling prices of petrol and diesel in the four major metros remained steady in January 2024 so far (up to 12th). Kerosene and LPG prices were also kept unchanged in January so far (Table III.2). | Table III.2: Petroleum Products Prices | | Item | Unit | Domestic Prices | Month-over-month (per cent) | | Jan-23 | Dec-23 | Jan-24^ | Dec-23 | Jan-24^ | | Petrol | ₹/litre | 102.92 | 102.92 | 102.92 | 0.0 | 0.0 | | Diesel | ₹/litre | 92.72 | 92.72 | 92.72 | 0.0 | 0.0 | | Kerosene (subsidised) | ₹/litre | 53.67 | 52.09 | 52.09 | -5.7 | 0.0 | | LPG (non-subsidised) | ₹/cylinder | 1063.25 | 913.25 | 913.25 | 0.0 | 0.0 | ^: For the period January 1-12, 2024.
Note: Other than kerosene, prices represent the average Indian Oil Corporation Limited (IOCL) prices in four major metros (Delhi, Kolkata, Mumbai and Chennai). For kerosene, prices denote the average of the subsidised prices in Kolkata, Mumbai and Chennai.
Sources: IOCL; Petroleum Planning and Analysis Cell (PPAC); and RBI staff estimates. | The PMIs for December 2023 indicated that input cost increases in manufacturing remained rangebound from November levels while for services it registered a softening. Selling prices recorded a marginal decline in December for manufacturing while it picked up gradually in the services sector (Chart III.40). IV. Financial Conditions The usual quarter end advance tax outflows and the monthly GST payments resulted in a large withdrawal of liquidity from the banking system in mid-December. In response, the Reserve Bank conducted five fine-tuning variable rate repo (VRR) auctions (in lieu of the main operation) of 2-7 days maturity amounting to ₹5.5 lakh crore and a main operation (13 days) amounting to ₹1.75 lakh crore during December 16, 2023-January 14, 2024. Banks also took recourse to the marginal standing facility (MSF) and borrowed nearly ₹0.89 lakh crore on an average basis during December 16, 2023-January 14, 2024. A pick up in government spending towards the month-end and early January ameliorated the pressure on liquidity with a commensurate decline in MSF borrowings. Overall, the Reserve Bank injected liquidity averaging on a net basis ₹1.8 lakh crore during December 16, 2023-January 14, 2024 (Chart IV.1). 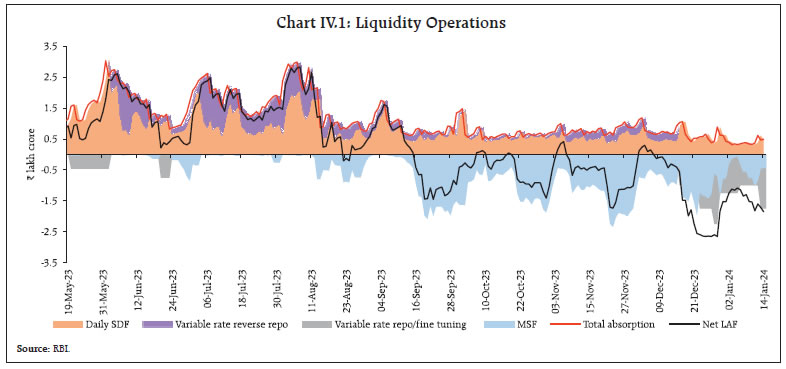
 Reflecting these developments, the weighted average call rate (WACR) – the operating target of monetary policy – averaged 6.71 per cent during December 16 - January 12, 2024 (Chart IV.2a). Rates in the collateralised segment – the triparty and market repo rates – ruled above the MSF rate (Chart IV.2b). In the term money segment, the yield on 3-month commercial paper (CP) for non-banking financial companies (NBFCs) stayed elevated in the aftermath of regulatory measures on consumer credit and bank credit to NBFCs announced on November 16, 2023.19 The yield on 3-month certificates of deposit (CDs) also hardened as banks resorted to higher CD issuances to meet funding requirements. In the primary market, fund mobilisation through issuances of CDs rose to ₹5.6 lakh crore during 2023-24 (up to December 2023), higher than ₹4.9 lakh crore a year ago. In December 2023, banks issued CDs over ₹1.0 lakh crore – the highest in any month during the current financial year - to bridge the gap between credit growth and trailing deposit growth. CP issuances at ₹10.0 lakh crore (up to December 2023) against ₹10.5 lakh crore in the same period a year ago. The yield on the 10-year G-sec benchmark yield marginally firmed up to 7.18 per cent on January 12 from 7.16 per cent on December 15 (Chart IV.3a). The yield curve shifted upwards with relatively sharper increase in yields across the mid to the long end of the curve (Chart IV.3b). Taking cues from G-sec yields, corporate bond yields and associated risk premia generally increased during December 16, 2023-January 12, 2024 (Table IV.1). Overall, corporate bond issuances during 2023-24 (up to November) were higher at ₹5.0 lakh crore as compared with ₹3.9 lakh crore a year ago. Reserve money (RM), excluding the first-round impact of change in the cash reserve ratio (CRR), recorded a growth of 6.3 per cent (y-o-y) as on January 5, 2024 (9.3 per cent a year ago) [Chart IV.4]. Growth in currency in circulation (CiC), the largest component of RM, decelerated to 3.8 per cent from 7.9 per cent a year ago, reflecting the withdrawal of ₹2000 banknotes.20 Money supply (M3) rose by 10.9 per cent (y-o-y) as on December 29, 2023 (8.7 per cent a year ago).21 Aggregate deposits with banks, the largest component of M3, increased by 12.0 per cent (8.7 per cent a year ago). SCBs’ credit growth stood at 15.6 per cent as on December 29, 2023 (14.9 per cent a year ago) [Chart IV.5]. | Table IV.1: Financial Markets - Rates and Spread | | Instrument | Interest Rates (per cent) | Spread (basis points) (Over Corresponding Risk-free Rate) | | Nov 16, 2023 – Dec 15, 2023 | Dec 16, 2023 – Jan 12, 2024 | Variation | Nov 16, 2023 – Dec 15, 2023 | Dec 16, 2023 – Jan 12, 2024 | Variation | | 1 | 2 | 3 | (4 = 3-2) | 5 | 6 | (7 = 6-5) | | Corporate Bonds | | | | | | | | (i) AAA (1-year) | 7.90 | 8.02 | 12 | 64 | 79 | 15 | | (ii) AAA (3-year) | 7.75 | 7.95 | 20 | 40 | 76 | 36 | | (iii) AAA (5-year) | 7.92 | 9.97 | 5 | 55 | 75 | 20 | | (iv) AA (3-year) | 8.40 | 8.60 | 20 | 105 | 140 | 35 | | (v) BBB- (3-year) | 12.03 | 12.24 | 21 | 468 | 504 | 36 | Note: Yields and spreads are computed as monthly averages.
Sources: FIMMDA; and Bloomberg. | The deposit growth of SCBs (excluding the impact of the merger), which witnessed an increase in the wake of withdrawal of ₹2000 banknotes, remained in double digits in December (Chart IV.6).
During June 2022-May 2023, the incremental credit-deposit ratio rose above 100 per cent, but has been declining thereafter. As on December 29, 2023 incremental credit-deposit ratio stood at 93.5 per cent, above its decadal average of 77.1 per cent (Chart IV.7). With the statutory requirements for CRR and statutory liquidity ratio (SLR) at 4.5 per cent and 18 per cent, respectively, around 77.0 per cent of deposits were available with the banking system for credit expansion as on December 29, 2023 (Chart IV.8). In response to the 250 bps hike in the policy repo rate, SCBs increased their external benchmark based lending rates (EBLRs) by a similar magnitude, while the 1-year median marginal cost of funds based lending rate (MCLR) increased by 155 bps during the period May 2022–December 2023 (Chart IV.9). Concomitantly, the weighted average lending rate (WALR) on fresh and outstanding rupee loans increased by 183 bps and 108 bps, respectively, during May 2022-November 2023. On the deposit side, the weighted average domestic term deposit rates (WADTDRs) on fresh and outstanding rupee deposits increased by 231 bps and 175 bps, respectively, during the same period.
Transmission across bank groups during May 2022 to November 2023 to deposit rates was higher in the case of public sector banks (PSBs) (Chart IV.10). The lending rates of PSBs, however, remained lower than those of private sector banks (PVBs).
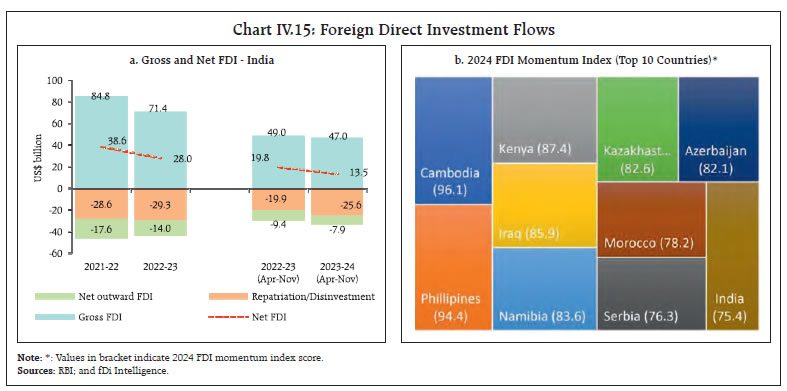
The Government of India revised rates on select small saving instruments, viz., 3-year time deposit and Sukanya Samriddhi Account Scheme upwards by 10 bps and 20 bps, respectively, during Q4:2023-24 while keeping rates constant for others (Chart IV.11). The BSE Sensex scaled fresh highs in the second half of December 2023, tracking positive global cues on risk-on sentiment amidst growing expectations of rate cuts by central banks in AEs and robust foreign portfolio investment (FPI) inflows. The benchmark index closed above the 72,000 mark for the first time on December 27, 2023 and ended 2023 with an annual gain of 18.7 per cent. The BSE Sensex increased for the eighth consecutive year on a calendar year basis amidst a broad-based rally led by cyclical sectors like realty and capital goods (Chart IV.12). Markets started the year 2024 on a negative note as sentiments were dented by the intensification of Red Sea disruptions and caution ahead of the quarterly corporate earnings season. Thereafter, the markets registered continuous gains amid mixed global cues and better than expected quarterly result announcements by Information Technology companies. Overall, the BSE Sensex gained 9.5 per cent since end-November 2023 to close at an all-time high of 73,328 on January 15, 2024. 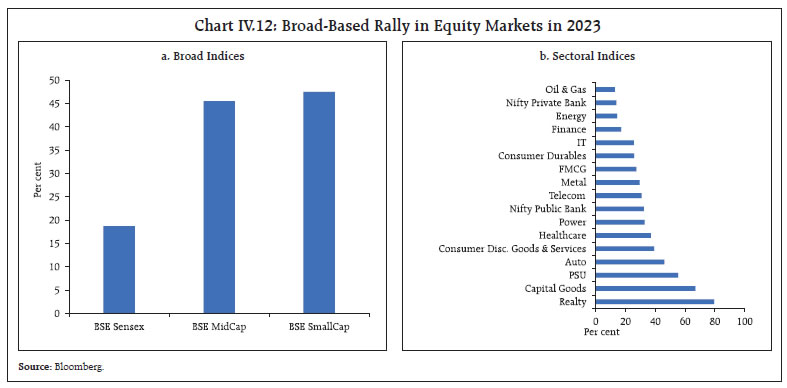 Domestic capital markets deepened further in 2023, marked by a rise in turnover, size, and investor participation (Table IV.2). The year also marked operational upgrades to the settlement cycle in domestic equity markets with further ambition to introduce T+0 and instant settlement of trades.22 The primary market remained vibrant in December 2023, with 31 firms raising ₹9,534 crore through initial public offerings (IPOs). The small and medium enterprises (SME) segment also exhibited significant activity in the current financial year (Chart IV.13). As per ernst and young’s (EY’s) Global IPO Trends 2023 report, India has grown its share of global IPO volume from 6 per cent and 11 per cent in 2021 and 2022, respectively, to 17 per cent in 2023. The primary market is expected to gain further momentum in 2024.23 Indian markets currently hover around lifetime highs with relatively high valuations in comparison with its peers (Chart IV.14). While this reflects expectations of strong growth in the overall economy, healthy corporate earnings will be key to sustaining these levels. Gross inward foreign direct investment (FDI) declined by 4.1 per cent to US$ 47.0 billion during April-November 2023 as compared with US$ 49.0 billion during the corresponding period a year ago (Chart IV.15a). Manufacturing, electricity and other energy sectors, transport, financial services, and retail and wholesale trade contributed around two-thirds of the gross inward FDI equity flows. The bulk of the equity inflows (69.9 per cent) were received from Mauritius, Singapore, Japan, the US and the Netherlands during the same period. Net FDI moderated to US$ 13.5 billion during April-November 2023 from US$ 19.8 billion a year ago, primarily due to a fall in gross inward FDI and a rise in repatriation of equity capital. As reported by fDi Intelligence24, India is among the top 10 countries of the world, with the strongest expected investment momentum in 2024 (Chart IV.15b). | Table IV.2: Developments in Capital Markets During 2023 | | (₹ crore, except demat accounts, which is in crore) | | | 2022 | 2023 | Per cent change | | Average Monthly SIP Contribution | 12,453 | 15,312 | 23.0 | | Number of Demat Accounts (end-period) | 10.8 | 13.9 | 28.7 | | Market Capitalisation of BSE (end-period) | 2,82,38,248 | 3,64,28,846 | 29.0 | | Asset Under Management of Mutual Funds (end-period) | 39,88,735 | 50,77,900 | 27.3 | | Equity Derivatives Turnover | 3,11,53,48,591 | 7,23,15,81,303 | 132.1 | | Cash Market Turnover | 1,52,10,804 | 1,75,87,721 | 15.6 | Note: Equity derivatives and cash market turnover pertain to both BSE and NSE combined.
Sources: SEBI, NSE, BSE, AMFI and RBI staff calculations. | 
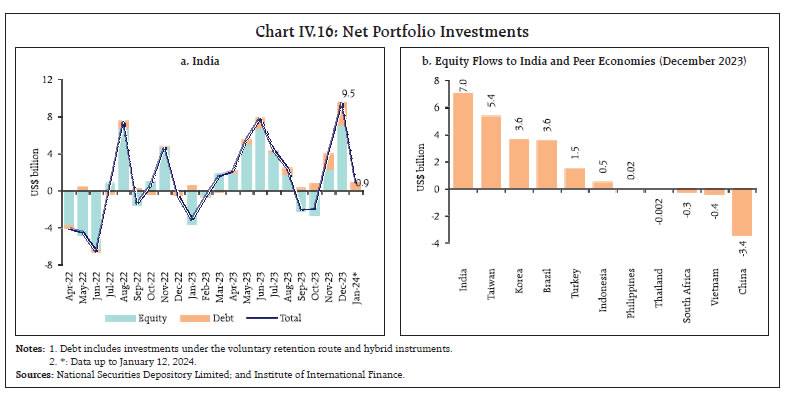 Supported by the buoyant growth outlook, India recorded net FPI inflows of US$ 9.5 billion in December 2023 – a 37-month high – led by equity inflows and complemented by inflows in debt segment (Chart IV.16a). Equities recorded multi-month high net inflows of US$ 7.0 billion, the highest among comparable emerging market peers in December 2023 (Chart IV.16b). Financial services registered the highest investment inflows during the month. FPIs invested US$ 0.9 billion in January 2024 (up to 12th) in Indian capital markets. During 2023-24 so far (up to January 12, 2024), net FPI inflows to India were to the tune of US$ 32.7 billion, the highest since 2015-16, barring the high witnessed during 2020-21. Net accretions to non-resident deposits increased to US$ 7.3 billion during April-November 2023 from US$ 3.6 billion a year ago, mainly due to a rise in net accretions to Foreign Currency Non-Resident [FCNR(B)] accounts and Non-Resident (External) Rupee Accounts [NR(E)A]. On a cumulative basis, external commercial borrowing (ECB) registrations (US$ 30.9 billion) and disbursements (US$ 23.2 billion) during April-November 2023 were higher than in the corresponding period last year. On the other hand, ECB outflow on account of principal repayment stood at US$ 17.3 billion during this period, thereby resulting in positive inflows during the year so far. On a quarterly basis, however, net ECB flows have turned negative during Q2:2023-24 and Q3:2023-24 (so far) after two quarters of net inflows (Chart IV.17).
Of the total ECBs registered during April-November 2023, three-fourth of the agreements were related to capital expenditure (Chart IV.18). The weighted average maturity of ECBs registered elongated to 5.8 years (5.3 years in April-November 2022), reflecting borrowers’ lower exposure to roll-over risk. Benchmark global rates have been rising – the secured overnight financing rate (SOFR) increased further by 52 bps during April-November 2023 after 459 bps rise during 2022-23. In comparison, the rise in overall cost of ECB loans has been relatively moderate as the weighted average interest rate spread of ECBs (over the benchmark interest rate) came down to 155 bps from 169 bps a year ago (Chart IV.19). The foreign exchange reserves stood at US$ 617.3 billion on January 5, 2024, the equivalent of 10.6 months of imports projected for 2023-24 and 97 per cent of total external debt outstanding at end-September 2023 (Chart IV.20a). India added US$ 59.7 billion to its foreign exchange reserves during the calendar year 2023, which is the third highest among major foreign exchange reserves holding countries. According to the IMF’s Currency Composition of Official Foreign Exchange Reserves (COFER)25, global foreign exchange reserves in Q3:2023 dropped to their lowest level since Q4:2022. Besides, the share of the US dollar in global reserves has declined since 1999 from 71.0 per cent to 59.2 per cent in Q3:2023 (Chart IV.20b).
The Indian rupee (INR) appreciated moderately by 0.02 per cent (m-o-m) vis-à-vis the US dollar in December 2023. Moreover, the INR was one of the least volatile currencies (Chart IV.21).
The INR depreciated by 1.2 per cent (m-o-m) in terms of 40-currency real effective exchange rate (REER) in December 2023 (Chart IV.22). India’s current account deficit (CAD) narrowed to 1.0 per cent of GDP in Q2:2023-24 from 1.1 per cent in Q1:2023-24 with an improvement in net services earnings and an increase in net transfers receipts (Chart IV.23). With net capital inflows - dominated by foreign portfolio investment and banking capital exceeding the CAD, there was an accretion of foreign exchange reserves to the tune of US$ 2.5 billion (on a BoP basis) during the quarter.
Key indicators of external sector vulnerability remained at sustainable levels at end-September 2023. During Q2:2023-24, while India’s debt service ratio declined, the short-term debt (on residual maturity basis) to foreign exchange reserves ratio increased moderately. The ratio of India’s external debt and net international investment position (IIP) to GDP at end-September 2023 remained at the same level as in the previous quarter (Chart IV.24). India’s net international liability position increased marginally by US$ 1.4 billion during Q2:2023-24 to US$ 381 billion in September 2023 (Chart IV.25). Gross financial liabilities to non-residents stood at US$ 1,314 billion of which 71 per cent was covered by Indian residents’ overseas assets. Reserve assets accounted for 63.0 per cent of India’s total international financial assets. Payment Systems Digital transactions advanced across various payment modes in December 2023 (Table IV.3). Wholesale transactions through the Real Time Gross Settlement (RTGS) showed accelerated growth (y-o-y) in value terms. The National Electronic Funds Transfer (NEFT) recorded growth in both transaction volume and value, higher than in the preceding year. On the retail side, the Unified Payments Interface (UPI) processed 12 billion transactions in the month, an additional billion within two months. The average ticket size of transactions under the Bharat Bill Payment System (BBPS) expanded strongly in the month, driven by sharp growth (y-o-y) in value of transactions. Fuelled by a rising share of online shoppers from areas beyond tier-2 centres26, e-commerce transactions led the growth in the credit card segment with a substantial rise in their value in November 2023. This growth was complemented by a 19 per cent (y-o-y) increase in the number of outstanding credit cards. 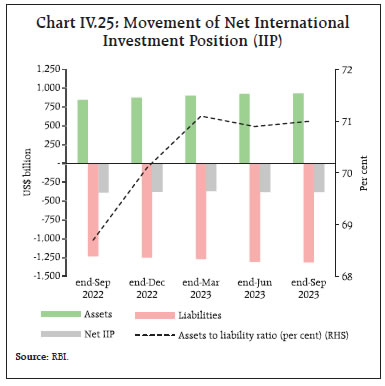
 On the supply side, the payment infrastructure exhibited healthy growth, attributable to increases in point-of-sale (PoS) devices, micro-ATMs, quick response (QR) codes and credit cards. Having deployed close to 8.3 lakh physical and 2.7 crore digital PoS devices under the Payment Infrastructure Development Fund (PIDF) Scheme, the Reserve Bank has extended the scheme by a further period of two years and widened its scope of beneficiaries and acceptance infrastructure. These enhancements include beneficiaries of PM Vishwakarma Scheme as merchants, provision of uniform subsidy across devices for special focus areas and making soundbox devices and Aadhaar-enabled biometric devices eligible for subsidy claims under the Scheme.27 Going ahead, UPI adoption is expected to rise with the UPI Tap and Pay going live, and the launch of UPI for the secondary market. As a major thrust to the digital ecosystem, India’s Central Bank Digital Currency (CBDC) exceeded 10 lakh transactions per day in the last week of December 2023. Overall, the digital payment ecosystem is poised for sustained growth, driven by a sharp increase in active FinTech app users28, deepening adoption of the Account Aggregator Framework29, and the continued expansion of the e-commerce market. V. Conclusion A leap year is a catch-up with solar time – if there were no leap years, then over a hundred years, summers would be cold and springs would be full of rain. Four years ago, the world suffered a catastrophic loss of lives and livelihood, with decades of progress erased. In the following year, deadlier mutations of the COVID-19 virus stalked the earth, but humanity was learning to cope in spite of higher mortality - the swift development of effective vaccines against COVID-19 was an unprecedented scientific achievement. In 2022, globalisation was rent asunder as geopolitics cried havoc and let slip the dogs of war.30 In its slipstream came the scourge of inflation and the pursuit of national self-interest as countries realigned supply chains and sources of key materials. These centrifugal forces have brought in their train high financial volatility but also a doughty tenacity and path-breaking technological revolution embodying the simulation of human intelligence. In 2024, we must take a leap of faith, recover the losses of these years gone by and prevail over the formidable downside risks that are seen over the horizon. The weak global outlook can be brightened if geopolitical conflicts end and their repercussions through commodity and financial markets, trade and transportation, and supply networks are contained. Inflation must be vanquished, paving the way for financial conditions to ease in support of growth. The adverse effects of climate change must be addressed. Re-globalisation must commence. AEs need to resuscitate growth impulses and boost consumption and investment as the lingering effects of past price shocks dissipate. In EMEs, investment has to be rekindled and the ongoing weakening of potential growth and productivity reversed to open up space to address issues relating to high debt levels and macroeconomic stability. In India, potential output is picking up with actual output running above it, although the gap is moderate. In 2024-25, the objective should be to sustain this momentum by securing real GDP growth of at least 7 per cent in an environment of macroeconomic stability. Accordingly, inflation needs to align with the target by the second quarter of the year, as projected, and get anchored there. Balance sheets of financial institutions need to be strengthened and asset quality improved even further. The ongoing consolidation of fiscal and external balances needs to continue. The gains of the transformative technological change that is underway must be harnessed for inclusive and participative growth in a sound risk-free environment. Above all, the virtuous thrust to investment from government capex must be partnered and even led by the corporate sector, supplemented by foreign direct investment. In the words of Shri Shaktikanta Das, Governor, “new opportunities are knocking at our doors. It is for us to capitalise on them. There has to be a greater focus on investment in capacity building, skilling of human resources and adoption of newer technology by all players. The international confidence on India’s prospects is at a new high; it is an opportune time to make this India’s moment and work towards strong, sustainable and inclusive growth.”31
|