by Michael Debabrata Patra, Joice John and Asish Thomas George^ The recent experience with the prolonged elevation in food prices in India has motivated our investigation into core-like properties of food inflation, namely volatility, persistence, spillovers and cyclical sensitivity. We find that there are times when some of these properties are satisfied. Hence, wielders of monetary policy need to ascertain the sources and nature of food price shocks, while being mindful of the risks of overreaction to transitory shocks as well as of the dangers of ignoring persistent food price shocks. Introduction In the wake of the pandemic – and exacerbated by the war in Ukraine – the intersecting incidence of food price spikes has had an overbearing influence on headline inflation in India. Widely regarded as transient, these shocks appear to have imparted volatility and persistence to food inflation which averaged 6.7 per cent during April 2022 to November 2023. Moreover, food has a weight of 45.9 per cent in the consumer price index (CPI) but its contribution to overall inflation has increased from 48 per cent in April 2022 to 67 per cent in November 2023. Two features stand out in this experience. First, the rising vulnerability of food prices to climate change – the heat wave during March-May 2022; crop production shortfalls due to uneven south-west monsoons; La Nina conditions for the third year in a row impacting rainfall patterns in the post-monsoon season; unseasonal rainfall and hailstorms in March 2023; temporal monsoon variability in 2023 (which included its delayed onset; torrential rainfall in July; and historic dry conditions in August); and strengthening El Nino conditions – suggests that food inflation in India may be acquiring a structural character. Second, the weaponisation of food as a consequence of geo-political conflict and restrictive trade practices embedded in geo-economic fragmentation is resulting in large spillovers propagating into non-food inflation and across geographies. These forces are causing headline inflation in India to diverge, often persistently, from its target of 4 per cent. On the other hand, non-food non-fuel inflation has been responding albeit unevenly and laggedly to monetary policy and to easing input costs, gravitating towards 4 per cent. This is noteworthy, since it constitutes the significant other half of headline inflation that is widely believed to lie within the realm of influence of monetary policy; food inflation is generally considered to be outside its ambit. An influential strand in the literature has argued that in emerging and developing economies in which food price inflation is more volatile and on an average higher than non-food inflation, a policy focus on measures of inflation that exclude or minimise the influence of food prices can result in a misspecification bias in forecasts, unhinged inflation expectations and lags in policy responses (Walsh, 2016). This is not just an issue relating to the greater weight of food in the consumption basket but also of the relationship between food and non-food prices (Cecchetti, 2007). If food inflation rises faster and remains more persistent than a measure of inflation that excludes food, the measurement of underlying inflation will be biased significantly downwards – means do matter, not just volatility and persistence, in maximising the signal to noise ratio that is the raison d’etre of any measure of core inflation. Measures that exclude food are also found to not perform well in terms of predictive power in country specific cases (Rich and Steindad, 2007; Alvarez et al. 2006). Furthermore, in the context of international commodity price cycles, it has been observed that mechanisms transmitting food price shocks may be changing – in many countries, headline inflation is not reverting to core in the same degree it did earlier, implying that secular forces may be at work (Anand and Prasad, 2010; Catao and Chang, 2015; Walsh, 2016). Against this backdrop and the recent experience of persistence of elevated food prices in India, the appropriate monetary policy response would be conditioned by the question: will relative prices adjust without any spillovers so that the monetary policy reaction can be to look through food price movements on the grounds that they are supply-driven and transitory in nature? or do food prices exhibit some core-like properties, which are relevant for monetary policy and cannot be ignored? Large relative price changes triggered by adverse supply side factors have been identified as cost-push shocks that shift the Phillips curve upwards and to the right (Ball and Mankiw, 1995). In the Indian context, relative food price shocks triggered by monsoon failures have been found to be significant in explaining Phillips curve dynamics (Patra et al., 2014). Households’ inflation expectations formation in India are considerably influenced by food prices (Goyal and Parab, 2021). Moreover, food prices do tend to co-move, but they also exhibit considerable heterogeneity in their underlying dynamics, with the nature of inflation persistence differing across categories and type of shocks – global or domestic. There is also evidence of spillovers of persistently high food inflation to underlying inflation (RBI, 2014; Anand et al. 2016; Nadhanael, 2020; Patra et al., 2021b). In this context, this article attempts to explore answers to the questions posed to the conduct of monetary policy by the food inflation behaviour in India. Section II examines the stylised facts regarding food inflation. Section III attempts a formal analysis of the behaviour of food inflation persistence. Section IV delves into spillovers of food prices to non-food components. Section V probes whether demand or cyclical factors impact food inflation and also brings it all together to draw out monetary policy implications of high and persistent food price inflation. Section VI concludes. II. Food and Non-food Inflation: Some Stylized Facts By convention, a core measure of inflation is constructed by minimising or excluding volatile components of the CPI – typically food and energy – to inform the setting of forward-looking monetary policy with medium-term objectives, since the data can measure developments only up to the recent past. The goal is to eliminate transitory developments and skews, and focus on the underlying longer-term trends. The possibility that such a core measure will be representative of overall inflation is based on two premises. First, it is assumed that means of food and non-food inflation are equal. If this is the case, then bringing down non-food inflation will eventually result in lower food inflation. Hence, monetary policy makers can focus on the so-called core1 inflation while responding to headline inflation in terms of which the price stability target of monetary policy is defined. Second, it is assumed that the volatility in food inflation is higher than non-food inflation, bringing in noise and weakening the signal on underlying inflationary pressures. If, however, food inflation shocks are large and persistent, they can affect non-food inflation through second-round effects (Walsh, 2016). Beginning with the equality of means assumption, average food inflation in India for the period 2016- 20232 has remained close to the average of headline and core inflation. Average inflation in each of the food sub-groups has, however, been different and not equal to the averages of headline and core inflation (Chart 1.a). Certain sub-groups like oils and fats, spices and meat and fish have, in fact, exhibited higher average inflation during this period. In some years, food inflation has remained lastingly higher than the headline and core (Chart 1.b). 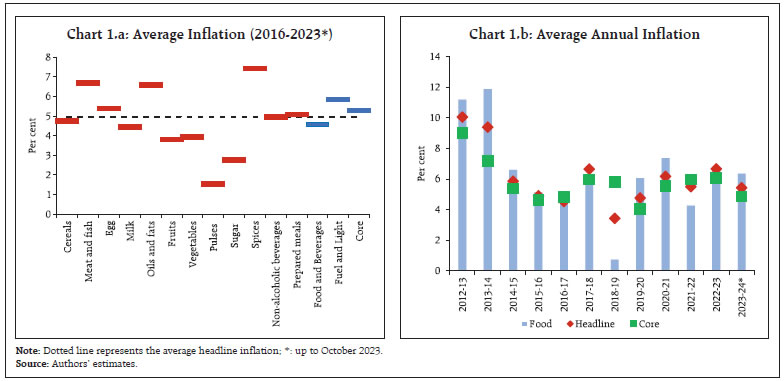 Food inflation volatility, measured by the intertemporal standard deviation (SD), has been markedly higher than the volatility of headline and core inflation. Certain food sub-groups like vegetables, oils and fats and pulses have recorded high SDs, while certain sub-groups like prepared meals and milk have shown lower variability relative to other sub-groups in food (Chart 2.a). As in most countries3, food inflation in India has been more volatile than core inflation during all the years in the past decade (Chart 2.b).
Food inflation contributed 43 per cent of average headline inflation between 2016 to 2023 (Chart 3.a). In the total variance of headline inflation, vegetables dominated all other sub-groups, contributing 38 per cent (Chart 3.b). The covariances among the sub-groups also contributed significantly to the total variance in headline inflation at around 30 per cent. This signifies the role of spillovers and second-round effects. The implications of large changes in relative prices of food on headline inflation are evaluated by the correlation and cross-correlation among the moments4 of headline, food and core inflation (Annex). Average food inflation is positively correlated with its skewness, while it is uncorrelated with its SD. This indicates that large changes in relative prices of food have a considerable bearing on the food inflation trajectory, impacting the distribution of headline inflation. On the other hand, skewness and SD of core inflation exhibit no correlation with its mean (Table 1). | Table 1: Correlation Coefficient of CPI Inflation Moments (Within Groups) | | | Mean | Standard Deviation | Skewness | Kurtosis | | a. Headline | | Mean | 1.00 | | | | | SD | 0.11 | 1.00 | | | | Skewness | 0.40* | 0.27* | 1.00 | | | Kurtosis | -0.22* | 0.26* | 0.23* | 1.00 | | b. Food | | Mean | 1.00 | | | | | SD | 0.15 | 1.00 | | | | Skewness | 0.34* | 0.31* | 1.00 | | | Kurtosis | -0.14 | 0.14 | 0.30* | 1.00 | | c. Core | | | | | | Mean | 1.00 | | | | | SD | 0.11 | 1.00 | | | | Skewness | 0.08 | 0.09 | 1.00 | | | Kurtosis | -0.08 | -0.26* | 0.04 | 1.00 | Note: *: Denotes significance at 5 per cent level.
Source: Authors’ estimates. | High correlations among the averages of food, core and headline inflation is indicative of the composition of the CPI basket. The SD and skewness in headline inflation is having high positive correlation with those of food inflation, signifying the role of food inflation in determining the variability and asymmetry of headline inflation (Table 2). Moreover, the cross-correlation between the moments of food and headline inflation suggests that the skewness in food inflation is positively correlated with the mean and SD of headline inflation, implying that large relative price changes in food inflation impacts the headline inflation path. Thus, food inflation has exhibited intertemporal and cross-sectional variation. Inflation in certain food sub-groups has contributed excessively to the volatility in headline inflation. Furthermore, the analysis of moments points to spillovers, i.e., shocks transmitted from food to non-food inflation could be large if food price shocks are persistent. To sum up large changes in food prices have the potential to affect headline inflation lastingly. | Table 2: Correlation Coefficient of CPI Inflation Moments (Between Groups) | | | Headline | Food | Core | | a. Mean | | Headline | 1.00 | | | | Food | 0.93* | 1.00 | | | Core | 0.74* | 0.47* | 1.00 | | b. SD | | Headline | 1.00 | | | | Food | 0.99* | 1.00 | | | Core | 0.06 | 0.01 | 1.00 | | c. Skewness | | Headline | 1.00 | | | | Food | 0.95* | 1.00 | | | Core | -0.27* | -0.26* | 1.00 | | d. Kurtosis | | Headline | 1.00 | | | | Food | 0.93* | 1.00 | | | Core | 0.25* | 0.17* | 1.00 | Note: *: Denotes significance at 5 per cent level.
Source: Authors’ estimates. | III. Persistence in Food inflation Persistence tends to vary over time and across components. Hence, we estimate the time varying persistence5 in inflation6, its major groups and the sub-groups of food inflation. First, we estimate persistence from monthly data from October 2016 to October 2023 in A comparison of persistence in headline, core and food inflation suggests that core inflation has been on average more persistent than food inflation during October 2016 through October 2023 (Chart 4). The persistence in food inflation has shown considerable variation across time. Certain sub-groups like prepared meals, non-alcoholic beverages, milk, cereals, oils and fats, pulses and spices display higher degrees of persistence than other sub-groups like vegetables, reflecting the influence of international developments and structural domestic supply bottlenecks (Chart 5). The non-trivial degree of inflation persistence in certain food sub-groups increases the risk of spillovers to non-food inflation through inflation expectations and cost-push pressures. Hence, monetary policy will have to be on guard to avoid the unanchoring of inflation expectation and generalisation of inflation.
IV. Food Inflation Spillovers The significance of food inflation spillovers to non-food inflation is tested in an auto regressive distributed lag (ARDL) cointegration framework (Pesaran et al., 2001) using seasonally adjusted monthly data from January 2011 to October 2023. The bounds test suggests a long run cointegration between prices of food and non-food items (Table 3). The error correction term is negative and statistically significant for food inflation, while it is not significant for non-food inflation. This indicates that food prices undergo deviations from equilibrium after a shock but they converge to non-food prices within a year. The large residual volatility of food price changes (relative to non-food) indicates that, in general, food price shocks are transitory in nature. On the other hand, a positive and statistically significant coefficient on food price changes in the short-run equation for non-food inflation indicates that spillovers happen from food prices to non-food prices. The low magnitude of this coefficient indicates that only large and persistent food price shocks affect non-food prices. Nevertheless, the significance of food price spillovers underscores the importance of anchoring inflation expectations in the wake of persistent and large food price shocks. | Table 3: Food and Non-food Inflation Dynamics | | | ΔNon-food | ΔFood | | Cointegration Test (F-Statistic) | 7.424** | 5.050* | | Error Correction Term | 0.009 | -0.080*** | | ΣΔNon-Food | 0.137* | -0.136 | | ΣΔFood | 0.048** | 0.231*** | | Residual SD$ | 0.239 | 0.839 | | Residual White Noise Test (p-value) | 0.469 | 0.381 | ***, ** and * represent significance at 1 per cent, 5 per cent and 10 per cent, respectively.
$ The SD corresponds to non-annualized m-o-m changes.
Note: Estimated using Sebastian Kripfganz and Daniel C. Schneider ARDL Module in STATA.
Source: Authors’ estimates. | V. Cyclical Sensitivity of Food Inflation Food prices are regarded as predominately driven by supply factors – demand is assumed not to play any meaningful role in the determination of these prices. The cyclical sensitivities of sub-group level food inflation and their contribution to overall food inflation are estimated in a time varying regression framework using quarterly data from Q1:2011 to Q3:2023 (Stock and Watson, 2007, 2020; Patra et al., 2022, 2023). First, we determine the time varying regression7 coefficients of each of the food sub-groups with a measure of the economic cycle proxied by the output gap8. The long-run elasticities of the output gap on different food inflation sub-groups indicate wide intertemporal and cross-sectional variations (Chart 6). While certain sub-groups like vegetables, oils and fats, and spices do not show any cyclically sensitivity and are fully driven by supply conditions and international prices, other sub-groups reveal sensitivity to demand conditions of varying intensity. We use this to capture the contribution of demand conditions to the evolution of food inflation over the last decade (Chart 7). About 90 per cent of food inflation is determined by non-cyclical factors like the weather, supply conditions, international prices and availability. On an average, however, 10 per cent of food inflation is driven by demand factors with significant time variation. This warrants vigil – counterfactual experiments using the RBI’s workhorse quarterly projection model (QPM)9 indicate the need to closely evaluate the sources and nature of shocks to food prices in order to determine the appropriate monetary policy response so as to avoid generalisation. 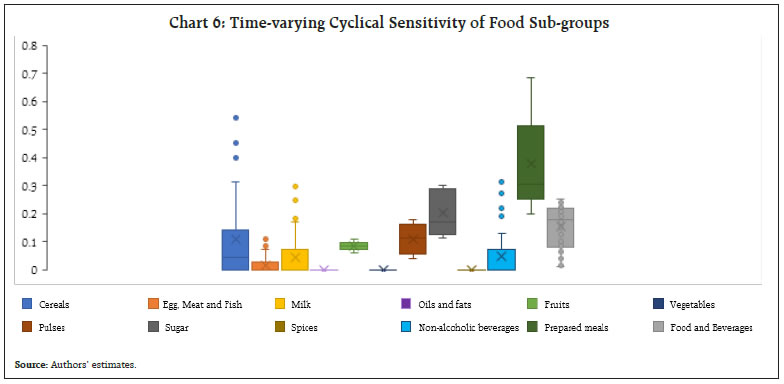 Two types of shocks are experimented with: (i) transitory shocks from vegetables prices; and (ii) persistent shocks due to monsoon failures. Under (i), inflation falls, allowing monetary policy to see through the shock by not changing the policy rate (Chart 8). On the other hand, if monetary policy misjudges the shock and chooses to react to this transitory shock by increasing the policy rate, it will induce volatility in the output gap without having any noticeable impact on the inflation path.
A persistent food price shock warrants monetary policy action to avoid unanchoring of inflation expectations and second-round effects (Chart 9). Per contra, if monetary policy chooses to neglect a persistent food price shock, inflation expectations become unanchored, leading to generalised inflation. VI. Conclusion Armed with these empirical findings, we circle back to the question we posed to ourselves at the beginning of the paper: are food prices the ‘true’ core of India’s inflation? First of all, we scoured the literature10 to determine the properties of core inflation, at least from a practitioner’s perspective. A core measure should reflect the underlying trend of overall inflation. The data-driven approach is to damp or remove volatile and transitory elements in the inflation formation process so as to maximise the signal to noise ratio in visualising future headline inflation – a defining requirement for policy formulation. Second, core inflation displays persistence; hence shocks to the core have long-lived effects on overall inflation, warranting monetary policy responses. Third, non-core inflation should converge to the core and there are no spillovers from non-core inflation to core. Fourth, the core measure is cyclically sensitive and hence amenable to monetary policy actions and stance. 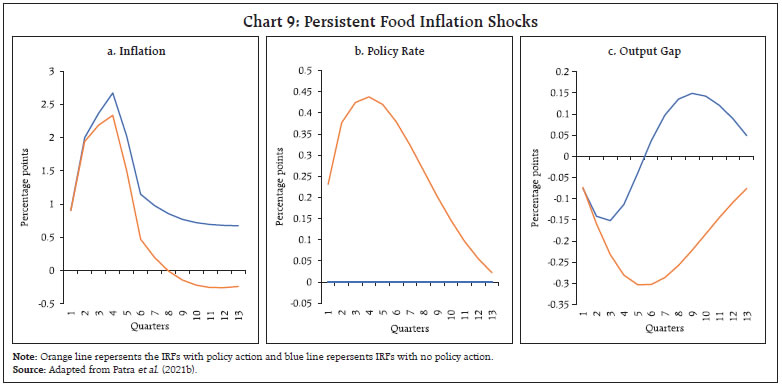 How do our findings on food inflation dynamics in India stack up against these core properties? First, on an average, food inflation has ruled close to headline inflation, satisfying the condition of equality of means. On the other hand, food inflation has been markedly more volatile than the headline, imparting more noise than signal. It is important to note, however, that not all food sub-groups contribute to this amplification of the noise to signal ratio – the main culprit is vegetable prices. Second, food inflation has exhibited persistence in some years, but this is concentrated in some sub-groups. Third, when food inflation shocks have been large and persistent, they have spilled over to prices in the non-food categories, although in the long-run, food inflation tends to converge to non-food inflation. Fourth, even though food inflation is primarily driven by supply-side factors, the influence of demand on several of its components is non-trivial and time varying. Reading all this together, there are times when food inflation mimics core inflation. With its large share in the consumption basket, food inflation has the potential to affect headline inflation and it can also affect non-food inflation in the event of large and repeated food price shocks. Ascertaining the sources and nature of these shocks is clearly the remit of risk-minimising monetary policy as its goal of price stability can easily be undermined by the de-anchoring of inflation expectations and the broadening of inflation pressures due to food price shocks. At the same time, wielders of monetary policy need to be conscious of the dangers of overkill in reactions to a transitory food price shock and also of the pitfalls of benign neglect of looking through persistent food price shocks. References: Alvarez, L. J., Dhyne, E., Hoeberichts, M., Kwapil, C., Le Bihan, H., Lünnemann, P., Martins, F., Sabbatini, R., Stahl, H., Vermeulen, P. & Vilmunen, J. (2006). Sticky prices in the euro area: a summary of new micro-evidence. Journal of the European Economic association, 4(2-3), 575-584. Anand, R., & Prasad, E. S. (2010). Optimal price indices for targeting inflation under incomplete markets (No. w16290). National Bureau of Economic Research. Anand, R., Kumar, N., & Tulin, V. (2016). Understanding India's food inflation through the lens of demand and supply. In Cashin, P. and Anand R. (Ed.) Taming Indian inflation. Rawat Publications. Ball, L., & Mankiw, N. G. (1995). Relative price changes as aggregate supply shocks. The Quarterly Journal of Economics, 110(1), 161-193. Bańbura, M., Bobeica, E., Bodnár, K., Fagandini, B., Healy, P., & Paredes, J. (2023). Underlying inflation measures: an analytical guide for the euro area. Economic Bulletin Boxes, 5. Catão, L. A., & Chang, R. (2015). World food prices and monetary policy. Journal of Monetary Economics, 75, 69-88. Cecchetti, S. G. (2007). Core inflation is an unreliable guide. VoxEU, March, 1, 2007. Das, A., John, J., & Singh, S. (2009). Measuring core inflation in India. Indian Economic Review, 247-273. Das P., & George, A. T. (2023). Consumer price index: The aggregation method matters. RBI Bulletin, March. Dholakia, R. H., & Kadiyala, V. S. (2018). Changing Dynamics of Inflation in India. Economic & Political Weekly, 65-73. Goyal, A., & Parab, P. (2021). What influences aggregate inflation expectations of households in India?. Journal of Asian Economics, 72, 101260. John, J., Kumar, D. George, A. T., Mitra, P., Kapur, M., & Patra, M. D. (2023). A recalibrated quarterly projection model (QPM 2.0) for India. RBI Bulletin, February. Marques, C. R., Neves, P. D., & Sarmento, L. M. (2003). Evaluating core inflation indicators. Economic modelling, 20(4), 765-775. Nadhanael, G V. (2020). Are food prices really flexible? Evidence from India. Reserve Bank of India, Working Paper, Vol. 10. Nakajima, J. (2011). Time-varying parameter VAR model with stochastic volatility: An overview of methodology and empirical applications. Available at https://www.imes.boj.or.jp/research/papers/english/me29-6.pdf Patra, M. D., Behera, H., & John, J. (2021a). Is the Phillips Curve in India Dead, Inert and Stirring to Life or Alive and Well?. RBI Bulletin, November. Patra, M. D., Bhoi, B. B., John, J., & Priyadarshi, K. (2021b). Flexible inflation targeting (FIT) in India. In Report of currency and finance. Reserve Bank of India. Patra, M. D., George, A. T., Nadhanael, G V., & John, J. (2022). Anatomy of Inflation's Ascent in India. RBI Bulletin, December. Patra, M. D., John, J., & George, A. T. (2023). Recent regime reversal in inflation: the Indian experience. RBI Bulletin, April. Patra, M. D., Khundrakpam, J. K., & George, A. T. (2014). Post-global crisis inflation dynamics in India: What has changed. In India policy forum (Vol. 10, No. 1, pp. 117-203). National Council of Applied Economic Research. Pesaran, M. H., Shin, Y., & Smith, R. J. (2001). Bounds testing approaches to the analysis of level relationships. Journal of applied econometrics, 16(3), 289-326. Raj, J., & Misra, S. (2011). Measures of core inflation in India–an empirical evaluation. Reserve Bank of India Occasional Paper, 32(3), 37-66. Raj, J., Misra, S., George, A. T., & John, J. (2020). Core inflation measures in India: an empirical evaluation using CPI data. Reserve Bank of India, Working Paper, Vol. 5. RBI. (2014). Report of the expert committee to revise and strengthen the monetary policy framework. Available at https://rbidocs.rbi.org.in/rdocs/PublicationReport/Pdfs/ECOMRF210114_F.pdf Rich, R. W., & Steindel, C. (2007). A comparison of measures of core inflation. Economic Policy Review, 13(3). Schembri L. L. (2017). Getting to the core of inflation, Remarks at Department of Economics, Western University London, Ontario, February. Stock, J. H., & Watson, M. W. (2007). Why has US inflation become harder to forecast?. Journal of Money, Credit and banking, 39, 3-33. Stock, J. H., & Watson, M. W. (2020). Slack and cyclically sensitive inflation. Journal of Money, Credit and Banking, 52(S2), 393-428. Walsh, J. P. (2016). Reconsidering the role of food prices in inflation. In Cashin, P. and Anand R. (Ed.) Taming Indian inflation. Rawat Publications.
Annex | Table A1. Correlation among the various moments of Headline, Food and Core Inflation | | | Headline | Food | Core | | Mean | SD | Skewness | Kurtosis | Mean | SD | Skewness | Kurtosis | Mean | SD | Skewness | Kurtosis | | Headline | Mean | 1.00 | | | | | | | | | | | | | SD | 0.11 | 1.00 | | | | | | | | | | | | 0.20 | | | | | | | | | | | | | Skewness | 0.40* | 0.27* | 1.00 | | | | | | | | | | | 0.00 | 0.00 | | | | | | | | | | | | Kurtosis | -0.22* | 0.26* | 0.23* | 1.00 | | | | | | | | | | 0.01 | 0.00 | 0.01 | | | | | | | | | | | Food | Mean | 0.93* | 0.16 | 0.55* | -0.14 | 1.00 | | | | | | | | | 0.00 | 0.06 | 0.00 | 0.10 | | | | | | | | | | SD | 0.10 | 0.99* | 0.27* | 0.32* | 0.15 | 1.00 | | | | | | | | 0.25 | 0.00 | 0.00 | 0.00 | 0.08 | | | | | | | | | Skewness | 0.21* | 0.30* | 0.95* | 0.27* | 0.34* | 0.31* | 1.00 | | | | | | | 0.01 | 0.00 | 0.00 | 0.00 | 0.00 | 0.00 | | | | | | | | Kurtosis | -0.20* | 0.08 | 0.26* | 0.93* | -0.14 | 0.14 | 0.30* | 1.00 | | | | | | 0.01 | 0.35 | 0.00 | 0.00 | 0.09 | 0.09 | 0.00 | | | | | | | Core | Mean | 0.74* | -0.06 | -0.04 | -0.32* | 0.47* | -0.07 | -0.15 | -0.28* | 1.00 | | | | | 0.00 | 0.50 | 0.61 | 0.00 | 0.00 | 0.39 | 0.08 | 0.00 | | | | | | SD | 0.11 | 0.06 | 0.18* | -0.34* | 0.08 | 0.01 | 0.24* | -0.24 | 0.11 | 1.00 | | | | 0.19 | 0.46 | 0.03 | 0.00 | 0.32 | 0.91 | 0.00 | 0.00 | 0.18 | | | | | Skewness | -0.06 | -0.10 | -0.27* | -0.28* | -0.11 | -0.11 | -0.26* | -0.28* | 0.08 | 0.09 | 1.00 | | | 0.48 | 0.25 | 0.00 | 0.00 | 0.19 | 0.18 | 0.00 | 0.00 | 0.38 | 0.27 | | | | Kurtosis | 0.16 | 0.09 | 0.30* | 0.25* | 0.25* | 0.12 | 0.22* | 0.17* | -0.08 | -0.26* | 0.04 | 1.00 | | 0.06 | 0.28 | 0.00 | 0.00 | 0.00 | 0.17 | 0.01 | 0.05 | 0.32 | 0.00 | 0.65 | | Note: * Denotes significance at 5 per cent level; p-values in italics.
Source: Authors' estimates. |
|