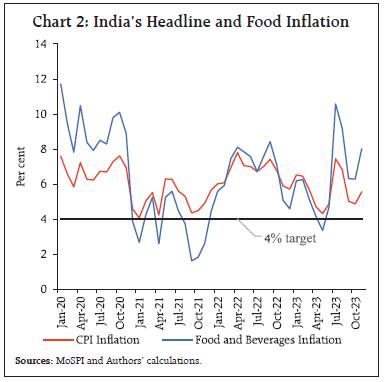
by D. Suganthi, Rishabh Kumar and Monika Sethi^ This article attempts to explore the dynamics of agriculture supply chain by estimating the farmers’ share in consumer prices through a pan-India survey of farmers, traders and retailers. The survey finds that the average share of farmers in output value varies between 33 and 70 per cent across various crops. Regarding other supply chain players, retailers’ mark-ups are generally observed to be higher than those of traders. Empirical analysis suggests that improvements in agriculture market density at the district level, which captures spatial competition, and stepping-up of market infrastructure potentially reduce traders’ mark-ups and improve the efficiency of the agriculture sector supply chain. Introduction The COVID-19-induced supply disruptions, the war in Ukraine and the frequent weather shocks have exerted upward pressures on food prices in India since 2020. Higher food prices improve the terms of trade of households engaged in agriculture, so long as farmers or farm workers are the net food producers (Headey and Hirvonen, 2023). However, due to input cost pressures, supply chain inefficiencies and food price volatility, the expected impact may not be realised.1 The inefficiencies in the agricultural supply chain (henceforth agri-supply chain) were exposed when the outbreak of the pandemic and the accompanying lockdown led to temporary spikes in wholesale prices of commodities and reduced their arrivals, whereas crop production was least impacted (NABARD, 2020; Lowe et al., 2021). Recognising the need to enhance and stabilise farmer’s income, over the years, several initiatives have been undertaken by the government to expand marketing opportunities for farmers and to create an efficient and competitive marketing system. These include the Model Agricultural Produce Market Committee (APMC)2 Act of 2003, facilitating direct sales to traders and retailers outside the ambit of APMC; deregulation/delisting and exemption of market fees on fruits and vegetables; and the Model Agricultural Produce and Livestock Marketing Act of 2017. To address infrastructural bottlenecks, create value addition, reduce wastage and transaction costs in the supply chain, the Government has also undertaken measures such as Integrated Scheme for Agricultural Marketing (ISAM), Agriculture Infrastructure Fund (AIF)3, e-National Agriculture Market (e-NAM), Pradhan Mantri Kisan Sampada Yojana (PMKSY), Operation Greens and promotion of farmer producer organisations. These policies have contributed to an increase in the capacity of cold storage, warehouses, market infrastructure and expansion of e-NAM integrated mandis. So far, 1389 markets in 23 States and 4 Union Territories have been linked to e-NAM. The storage capacity sanctioned under Agricultural Marketing Infrastructure (sub-scheme of ISAM) has increased by 18 per cent during 2015-2019 and the cold storage capacity by 20 per cent during 2015-2022 (Nuthalapati and Sharma, 2021; GoI, 2023). Out of ₹1 lakh crore of outlay budgeted up to 2025-26 under the Agriculture Infrastructure Fund, around ₹20 thousand crore has been disbursed (up to November 2023). Going forward, the reforms suggested under the National Logistics Policy (2022) could further improve the agri-supply chain. Nonetheless, inefficiencies in the agri-supply chain arise due to small and scattered marketed surplus4, the movement of which involves multiple intermediaries. Policies aimed at further augmenting infrastructure and rationalising the intermediation along the agri-supply chain would help limit the price build-up. According to the literature, a simple metric to measure the improvement in the agri-supply chain is by estimating the wedge between farmgate prices and consumer prices. It also captures the relative market bargaining power of farmers in relation to traders and retailers. Though a bulk of studies focus on farmers’ share in consumer prices, there is little evidence of the same using data from a comprehensive assessment at the all-India level, especially, after the introduction of the recent set of government policies. Against this background, this study estimates the farmers’ share in consumer prices5 through a pan-India survey6 of farmers, traders and retailers. A comparison with the previous round of the pan-India survey conducted in December 2018 (Bhoi et al., 2019) is also attempted to reflect upon changing agri-supply chain conditions.7 Additionally, it examines the factors influencing traders’ mark-ups. The results show that the average farmers’ share varies between 33 and 70 per cent across various crops. This indicates some improvement from 2018 levels in products like onions, green chillies and potatoes. Empirical analysis suggests that improvements in agriculture market density at the district level reduce traders’ mark-ups. The rest of the article is organised into five sections. A review of the empirical evidence on farmers’ share and the effects of spatial competition of agricultural markets on intermediary mark-ups is covered briefly in Section II. The stylised facts about inflationary pressures and changing margins are provided in Section III. Section IV describes the survey methodology and coverage. The key survey findings and empirical analysis are presented in Section V. The concluding observations are provided in Section VI. II. Literature Review The existing empirical literature focusing on the supply chain dynamics has dealt with the issues of farmers’ share in consumer prices, price dispersion between the wholesale and retail markets, variation in supply chain costs across different commodities and stakeholders, effects of infrastructural developments on traders’ and retailers’ mark-ups and spatial variation in prices realised by farmers due to market competition (Bhoi et al., 2019; Gulati et al., 2022; Chand, 2012; Minten et al., 2012; Chatterjee, 2017). Farmers’ share in consumer prices across different crops, farm size and marketing channels over different time periods are estimated in a range of 20-94 per cent (Baig, 1962; Sen and Maurya, 1999; Kalita, 2017; Narasalagi and Shivashankar, 2018; Bhoi et al., 2019; Gulati et al., 2022; Pramanik, 2022). In the case of fruits and vegetables, it ranged between 28-74 per cent, while for non-perishables (paddy, pulses, oilseeds), it ranged between 49-76 per cent. The variation in transaction costs in terms of market fees, commission agent fees, labour and packaging costs incurred by different stakeholders across states and commodities has also been highlighted in the literature (Bhoi et al., 2019; Gulati et al., 2022). Infrastructural development in terms of road networks, market density, tele-density, irrigation facilities and overall literacy rate in the country helps in reducing traders’ and retailers’ mark-ups (Bhoi et al., 2019). Also, as an effect of spatial competition, farmers in geographies with high mandi concentrations are found to realise higher prices (Chatterjee, 2017). Using the monthly price data on 21 commodities across 60 agricultural markets in India, transportation infrastructure and distance between market pairs is found to enhance price integration across markets (Andrle and Blagrave, 2020). While existing studies provide evidence suggesting that market infrastructure improves farmers’ price realisation, however, there is less evidence of these factors affecting traders’ mark-ups. III. Stylised Facts The overlapping shocks after the pandemic led to sharp increases in the global food price index which remain above its pre-pandemic decadal average even today (Chart 1). India’s Food and Beverages inflation has remained above the CPI target of 4 per cent since December 2021 (except in May 2023 when it stood at 3.3 per cent) (Chart 2). Further, the disaggregated picture shows wide variations in inflation and its volatility across components. For instance, major food components such as ‘cereals and products’, ‘milk and products’, ‘meat and fish’, ‘oil and fats’ and spices registered an increase in both inflation and volatility during 2020-21 to 2023-24 (till November) over their pre-pandemic levels (Chart 3). Analysing the behaviour of mark-ups during such highly uncertain conditions assumes relevance from inflation management and monetary policy perspectives. 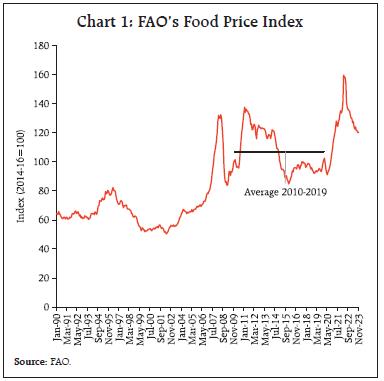
 The trends in price dispersion between retail (paid by the end-consumers) and mandi prices (assumed to reflect the price received by farmers) have been initially examined using secondary data. An increase in the spread between retail and mandi prices is evident for paddy/rice and groundnut, while it is broadly unchanged for other crops (Chart 4).8 The margins could vary across crops for several reasons, such as transaction costs, wastage during transit, length of the holding cycle, mandi-level competition, infrastructure facilities, etc. These aggregate margins do not capture the mark-ups9 at various stages of the supply chain (i.e., traders and retailers) and between production and consumption centres and therefore, analysis of the process of price build-up from farm to retail level requires in-depth analysis. The survey is designed to fill this gap. IV. Objectives, Coverage and Methodology of Survey Survey Objectives The agricultural market supply chain involves various market participants, such as farmers, aggregators, traders, commission agents, wholesalers and retailers. Commodities flow through these market participants during exchange operations based on price signals. Though several agents are involved in the agri-supply chain across centres, a simplified form of a supply chain network was considered for this study. The intermediaries considered between farmers and consumers were traders and retailers. Survey Methodology Like the 2018 survey, mandis in 85 centres across 16 states for 15 kharif crops were covered using three separate questionnaires for farmers, traders and retailers. The survey covered a total of 11,169 respondents (Table 1). The survey was undertaken during December 2022-February 2023 in select production and consumption centres separately since the supply chain dynamics could differ across production centres (the primary producing centres of the chosen commodities) and consumption centres (the major cities). Two-stage sampling was used to select the farmers. In the first stage, farmers were selected based on the production and sale of the selected commodities in neighbouring villages of the target mandis in the production centres.10 In the second stage, farmers were chosen randomly from the selected lot. The dataset was cleaned by eliminating outliers, around 6 per cent, based on the estimated cost and profit margin per kilogram of traders and retailers.12 | Table 1. Survey Coverage | | Survey Round | Mandi/Centre | Commodities11 | | Segment | Consumption Centres | Production Centres | Total | Cereals: Paddy/Rice
Pulses: Tur, Moong, Urad
Oilseeds: Groundnut, Soyabean
Fruits and Vegetables: Apple, Banana, Coconut, Onion, Potato, Tomato, Green chillies and Brinjal
Spices: Turmeric | | 2018 | Farmers | 1147 | 1664 | 2811 | | | Retailers | 2356 | 1052 | 3408 | | | Traders | 2176 | 1008 | 3184 | | | Total | 5679 | 3724 | 9403 | | 2022 | Farmers | - | 2134 | 2134 | | | Retailers | 3640 | 648 | 4288 | | | Traders | 3787 | 960 | 4747 | | | Total | 7427 | 3742 | 11169 | | Source: Primary survey data for 2018 and 2022 and Authors’ estimates. | V. Survey Findings and Empirical Analysis Survey Findings The survey findings show that the average share of farmers in consumer prices varies between 33 per cent and 70 per cent across 13 crops covered in the survey.13 Perishable commodities (mainly vegetables such as potato, tomato, brinjal and green chillies) exhibit a lower share, while a higher share is observed in non-perishables such as pulses and oilseeds (Chart 5). These findings broadly align with the existing studies (Gandhi and Namboodiri, 2002; Sidhu et al., 2011 and Gulati et al., 2022). Compared to the previous survey, perishables such as onions, green chillies and potatoes show an increase in farmers’ share. This might reflect a rise in farm-level storage structures and market-level cold storage capacity and transport facilities, especially for onions and potatoes. However, farmers’ share has decreased for perishables like bananas, tomatoes and brinjal. During the survey period, i.e., December 2022-February 2023, tomato prices were very low; therefore, the drop in the farmers’ share in the case of tomatoes may partly be attributed to supply glut. In the case of rice, the farmers’ share has reduced marginally from 49 per cent to 45 per cent.14 For oilseeds, the share is around 50 per cent and has fallen from the previous survey (Chart 6). The survey’s second goal was to identify the factors that affect agricultural commodity price formation, i.e., between farmers’ price realisation and the price charged by retailers. According to the survey, farmers, traders, and retailers incur various charges during commodity transactions. For farmers, post-harvest costs primarily include commissions and mandi charges, loading/unloading charges, packing, weighing and grading charges. For traders and retailers, the factors influencing their mark-ups include membership fees, transport costs, shop rentals, local taxes, and storage costs. Although the sensitivity of mark-ups to these factors varies across commodities and regions/states, the survey’s findings, i.e., average costs across commodities and centres, are consistent with existing literature (Gulati et al., 2022; Minten et al., 2012) [Table 2]. 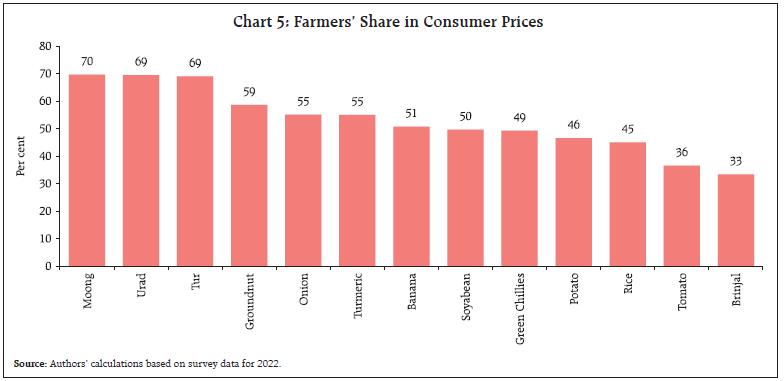

| Table 2: Costs Influencing Mark-ups | | Farmers | Traders | Retailers | • Mandi charges: 1-2%
• Commission: 1-3% for grains; 5-7% for fruits and vegetables
• Loading/Unloading charges: ₹1/kg
• Packing: ₹1.5/kg
• Weighing: ₹1.1/kg
• Grading: ₹1.2/kg | • Membership fee: ₹3660/year
• Cess/taxes: ₹2/kg to ₹3/kg
• Labour charges: ₹1.2/kg
• Transport cost: ₹1.8/kg
• Storage cost: ₹1/kg | • Shop rentals: ₹6841/month
• Local taxes and other costs: ₹1.9/kg
• Labour charges: ₹1.3/kg
• Transport cost: ₹1.4-2.1/kg | | Source: Authors’ calculations based on survey data for 2022. | Additionally, the mark-ups of traders and retailers, defined as selling price less total cost (cost of products and transaction costs) as a percentage of the total cost, may differ amongst crops for a variety of factors, including storage cost depending on the length of the holding cycle, and quality including crop loss during transit, etc. Across all commodities, retailers’ mark-ups were found to be generally higher than those of the traders in both production and consumption centres, which may reflect significant product loss at the retail stage, especially for perishables. Also, the traders’ and retailers’ mark-ups for non-perishables were lower than perishables (Chart 7). The traders’ and retailers’ mark-ups in this round, compared to 2018, have remained stable for non-perishables; however, in the case of perishables, some fruits and vegetables have witnessed an increase while others have exhibited a decline (Chart 8). Around 70 per cent of the respondents revealed lower or sluggish crop arrivals in the market (Chart 9a) and these were mainly believed to be due to excessive/ extended rainfall in some regions and delayed/deficient rain in other regions (Chart 9b).
Regarding awareness of the prevailing market prices, 59 per cent of the surveyed farmers possessed prior information on market prices for sale (Chart 10a). The main source of information being other farmers and traders in their contacts, followed by mobile app/ SMS and others (Chart 10b).
Cash continued to be the dominant mode of payment for transactions at mandis, as in the 2018 survey, as per the respondent farmers, traders, and retailers (Chart 11). Regarding electronic payments, the usage was found to be the highest among traders, followed by retailers. In comparison to the 2018 survey, the usage has registered a more than 3-fold increase in the case of traders and a 5-fold increase for retailers. To insulate domestic consumers from global food price spikes, trade policies are resorted to by various countries across the globe, including India. Only around 10 per cent of surveyed traders and 13 per cent of retailers reported being aware of the latest export restrictions. Among 8 per cent of traders involved in export operations, the majority indicated that they had lowered their procurement from farmers in anticipation of lower prices in the near future (Chart 12a). In response to the price-based export restrictions, the majority of the traders reported to have passed on the higher prices to importers and lowered the procurement prices paid to farmers (Chart 12b).
As per the majority of the retailers, the trade policy measures led to increased market supply and lower retail prices (Chart 13). In addition, another 17 per cent of respondents reported that though the market supply increased but at a slow pace. Being an important intermediary in the agri-supply chain, traders’ perceptions and feedback on government policies and suggestions for further improvement can enhance the efficiency of agricultural markets. According to traders, the quality assessment (assaying) facility in the mandis was reported to be the most important policy benefiting the traders, followed by procurement at Minimum Support Price (MSP) and e-NAM (Chart 14a). Furthermore, according to the majority of the traders, free international trade, commodity futures trade and easing stocking limits would improve agricultural marketing (Chart 14b). The key findings from the survey conducted in 2022 indicate that share of farmers in consumer prices ranges from 33 per cent to 70 per cent with perishable crops having a lesser share. Farmers’ share has, however, increased for perishables such as potatoes, green chilies, and onions, since the 2018 survey. Mark-ups observed at the retail level were generally greater than those of the traders, indicating substantial product loss in the supply chain, particularly with regard to perishables. Electronic payments for traders and retailers have increased substantially since the 2018 survey, although cash transactions continue to dominate among all participants. Traders expressed a preference for futures trade and relaxation of trade and stockpiling restrictions for improving agricultural marketing while stating that export restrictions increase domestic supply and reduce prices. Additionally, e-NAM, procurement at MSP, and quality assessment (assaying) facilities were reported to be advantageous to traders. 
 Traders’ Mark-up Determinants: An Empirical Analysis Using survey data and mandi profile data15, an empirical exercise was attempted to investigate factors that potentially influence traders’ mark-ups. By pooling district and crop level data, the following multivariate regression equation was estimated using the Ordinary Least Squares (OLS): where, i, d, c and s represent ‘trader’, ‘district’, ‘commodity’ and ‘state’, respectively. Here, Mic is the mark-up, defined as the selling price less total cost (including transaction cost) as a percentage of total cost for traders. Ti represents traders’ characteristics, which include age, education, perception about commodity supply compared to last year, and reported number of other traders in the mandi for the reference commodity (commodity in which the trader is dealing with). Amongst key variables, traders’ perception about lower supply compared to last year is expected to positively influence their mark-up while within market competition (measured by number of traders in a mandi) is expected to dampen the traders’ mark-up. TCi is the transaction cost incurred per kg and is expected to have a negative influence on the mark-up charged by traders. MDd indicates market density (i.e., ratio of number of mandis to number of villages in the district), which captures the spatial market competition and is anticipated to negatively influence traders’ mark-up. UDd represents urban density (i.e., ratio of urban population to total in the district), a demand-side factor, expected to positively influence traders’ mark-up.16 Rd indicates rainfall deviation from long period average (LPA) [dummy variable takes ‘1’ if cumulative southwest monsoon rainfall is 20 per cent below LPA representing deficient and large deficient and ‘0’ otherwise]. It is expected that the dummy variable capturing rainfall deficiency will have a positive association with traders’ mark-up. Sic X Dd represents interaction between traders’ decision to store and actual rainfall deviation in deficient and large deficient districts. This variable, however, could be endogenous, as the traders’ decision to store might be influenced by expected mark-ups and is expected to positively influence traders’ mark-up. Therefore, a two-stage least squares (2SLS) estimation has been conducted as a robustness test. Cc and Ss are the vectors of crop and state dummies, respectively, and εic is the residual. Commodity dummies account for commodity characteristics. As agriculture is a state subject, state dummies were incorporated to account for variations in policies regulating agricultural trade and mandi rules. Model 1 estimates the association between traders’ characteristics and their mark-ups, accounting for rainfall deficiency, urban density, commodity and state dummies. In Model 2, additionally, the competition within mandi was accounted by reported number of other traders for the reference commodity in the mandi and spatial competition was proxied by market density variable. Furthermore, in Model 3, the interaction effect of traders’ decision to store and rainfall deficiency was explored. Additionally, in Model 4, considering rainfall deficiency dummy as instrument for storage decision of traders, a 2SLS model was estimated (Table 3). The empirical results suggest that transaction costs (including transportation, labour charges, mandi taxes and storage costs) are negatively correlated with traders’ mark-ups. The rainfall deficiency is associated with higher mark-ups for the traders. Though positively associated, consumption demand proxied by the urban population share has no significant influence on traders’ mark-ups. | Table 3: Determinants of Traders’ Mark-up: Regression Results | | Dependent variable: Mark-ups (Log) | Traders' Mark-up (OLS model 1) | Traders' Mark-up (OLS model 2) | Traders' Mark-up (OLS model 3) | Traders' Mark-up (IV 2SLS model 4) | | Age (Log) | 0.020 | 0.023 | 0.030 | 0.066 | | | (0.05) | (0.05) | (0.05) | (0.07) | | Education (D) | 0.041 | 0.066 | 0.060 | 0.053 | | | (0.04) | (0.04) | (0.04) | (0.04) | | Lower supply compared to last year (D) | 0.011 | 0.015 | 0.014 | 0.003 | | | (0.03) | (0.03) | (0.03) | (0.04) | | Transaction cost per kg (Log) | -0.036*** | -0.049*** | -0.051*** | -0.052** | | | (0.01) | (0.01) | (0.01) | (0.01) | | Deficient rainfall (D) | 0.099** | 0.103** | 0.088* | | | | (0.05) | (0.05) | (0.05) | | | Urban population share (Log) | 0.031 | 0.044 | 0.036 | 0.024 | | | (0.03) | (0.03) | (0.03) | (0.10) | | Number of traders in market (Log) | | 0.026 | 0.029 | 0.042 | | | | (0.04) | (0.03) | (0.05) | | Market density (Log) | | -0.066*** | -0.070*** | -0.090* | | | | (0.02) | (0.02) | (0.05) | | Storage (dummy) * rainfall deviation from LPA for deficient districts | | | 0.011* | | | | | | (0.01) | | | Storage (dummy) | | | | 0.718 | | | | | | (0.65) | | Constant | 2.356*** | 2.055*** | 1.970*** | 1.836*** | | | (0.21) | (0.25) | (0.25) | (0.48) | | Test for endogeneity: Ho: exogenous (p-value) | | | | 2.842 | | | | | | (0.326) | | Number of Observations | 4441 | 3785 | 3785 | 3785 | | R squared | 0.261 | 0.271 | 0.274 | 0.231 | ***,** and * represent 1 per cent, 5 per cent and 10 per cent levels of significance, respectively.
Note: Figures in parentheses indicate robust standard errors clustered at mandi level.
Source: Survey data and authors’ estimation. | In Model 2, the factor accounting for within market competition has no significant relationship with traders’ mark-up, suggesting market imperfection or possible collusion between intermediaries within agricultural markets (Banerji et al., 2004). The market density is, however, negatively associated with traders’ mark-ups. Thus, improving spatial competition and the availability of better infrastructure amenities in agricultural markets or mandis, can reduce traders’ mark-ups and ameliorate farmers’ market access. This finding is consistent with studies highlighting that farmers are more likely to realise higher prices in regions with a higher mandi concentration (Chatterjee, 2017). In Model 3, the interactive effect of traders’ decision to store the commodity in rainfall deficient areas is positive, and thus higher mark-ups seem to be associated with deficient rainfall. Accounting for endogenous effect of storage decision, the 2SLS estimation shows that the storage decision per se has no influence on their mark-ups.17 Also, the test for endogeneity accepts the null hypothesis of storage decision being exogenous. VI. Conclusion This article presented the key results from a pan-India survey conducted during December 2022-February 2023 to assess India’s agri-supply chain dynamics and identify factors influencing mark-ups. Based on the information gathered, it was found that the average share of farmers in consumer prices varies between 33 per cent and 70 per cent; perishables, in comparison to non-perishables, exhibit a lower share due to their short saleable life cycle. In the case of perishables such as onions, green chillies and potatoes, there seems to be some evidence of an increase in farmers’ share from the similar survey conducted in 2018, which could be due to improvements in farm-level storage and transport infrastructure. In line with the previous survey results, retailers’ mark-ups were generally higher than those of the traders, reflecting significant product loss at the retail stage, especially for perishables. According to the surveyed traders, while export restrictions increase domestic supply and reduce prices, they would prefer futures trade and easing of trade and stocking restrictions. The traders reported benefiting from quality assessment (assaying) facility in the mandis, procurement at MSP and e-NAM. While cash transactions dominate the payments in mandis across all the participants, electronic payments registered a significant increase over the 2018 survey for both traders and retailers. Empirical analysis indicates that while within-market competition (i.e., an increase in the number of traders in a mandi) has no significant relationship with traders’ mark-ups, supply-side improvements in market density (i.e., an increase in the number of mandis in a district) enhancing spatial competition and storage facilities in mandis appear to be associated with reduced mark-ups of traders. Furthermore, an increase in transaction costs reduces traders’ mark-ups. Overall, the survey findings suggest that further development of agricultural markets, warehouses, pre-processing facilities, ripening units and cold storage are critical. These would help in improving competition, supply management and also reduce supply chain wastages. These measures could also help in containing the frequent spikes in food prices that have been observed in recent years. References Andrle, M and Blagrave, P (2020). Agricultural Market Integration in India. IMF working papers WP/20/115, International Monetary Fund. Baig, M.A. (1962) Marketing of Fruits in Andhra Pradesh. Journal of Agricultural Marketing. 5(1): 16. Banerjee, A. and Meenakshi, J.V. (2004). Buyer Collusion and Efficiency of Government Intervention in Wheat Markets in Northern India: An Asymmetric Structural Auctions Analysis. American. Journal of Agricultural Economics. 86(1): 236–253. Bhoi, B., Kundu, S. Kishore, V and Suganthi, D. (2019). Supply Chain Dynamics and Food Inflation in India. RBI Bulletin. Chand, R. (2012). Development Policies and Agricultural Markets. Economic and Political Weekly. 47(52): 53-63. Chatterjee, S (2017). Market Power and Spatial Competition in Rural India, Quarterly Journal of Economics, 138(3): 1649-1711. Gandhi, V.P., and N.V. Namboodiri (2002). ‘Fruit and Vegetable Marketing and its Efficiency in India: A Study of Wholesale Markets in the Ahmedabad Area’, Indian Institute of Management, Ahmedabad. GoI (2017). Report of the Committee on Doubling Farmers’ Income, Inter-linkages between Input Costs, Diversification, Capital Formation and Income, Department of Agriculture, Cooperation and Farmers’ Welfare, Ministry of Agriculture & Farmers’ Welfare. GoI (2023). Agricultural Statistics at a Glance 2022, Department of Agriculture, Cooperation and Farmers’ Welfare, Ministry of Agriculture & Farmers’ Welfare. Gulati, A., Ganguly, K., and Wardhan, H. (2022). Agricultural Value Chains in India: Ensuring Competitiveness, Inclusiveness, Sustainability, Scalability, and Improved Finance, (Ed) Springer. Headey, D., and Hirvonen, K. (2023). ‘Higher food prices can reduce poverty and stimulate growth in food production’, Nature Food, Vol 4(8): 699-706. Kalita, B. (2017). Marketing Efficiency, Price Spread, Share of Farmers in case of horticultural markets of Assam. International Journal of Advance Research and Development, 2(8):62-72. Lowe, M., Nadhanael, G. V. and Roth, B. N. (2021). India’s food supply chain during the pandemic. Food policy, 105, 102162. Minten, B., Vandeplas, A., and Swinnen, J.F.M. (2012). Regulations, brokers, and interlinkges: the institutional organisation of wholesale markets in India. Journal of Development Studies 48, 864-886. Narasalagi, V. M. and Shivashankar K (2018). Analysis of producer’s share in consumer’s rupee in marketing of selected vegetable through different supply chains. International Journal of Innovative Research and Studies, 8(II). National Bank for Agriculture and Rural Development (NABARD) (2020). Impact Assessment of COVID-19 on Indian Agriculture and Rural Economy. Survey Report by Department of Economic Analysis & Research (August, 2020). Nuthalapati, C. S. and Sharma, R. (2021). Requirement and Availability of Cold-Chain for Fruits and Vegetables in the Country. Research study submitted to Ministry of Agriculture and Farmers’ Welfare, Government of India. Published by Institute of Economic Growth, New Delhi. Pramanik, B. Das, G., Saha, D. and Mandal, A (2022). Analysis the producer’s share in consumer’s rupees and Price spread of selected vegetable and spice crops in West Bengal Agro Economist, 9(2) 157-160. Sen,C. and Maurya, R.P.(1999). Producer’s Share in Consumer’s Rupee-A study of Vegetables. Journal of Agricultural Marketing. 44(3): 177-179. Sidhu, R.S., M.S. Sidhu and J.M. Singh (2011). ‘Marketing Efficiency of Green Peas under Different Supply Chains in Punjab’, Agricultural Economics Research Review, Vol. 24, pp. 267-273.
|