by Nishita Raje^, Khaijamang Mate#, Sayli Londhe^^ and Sandhya Kuruganti# The scale and scope of banking regulation and its linguistic complexity have increased globally over the years in tandem with the rise in risks and vulnerabilities in the financial system. At the same time, there is a growing awareness and initiative to adopt simpler language in the central bank’s regulations to ensure better compliance. Against this backdrop, this study attempts to measure the linguistic complexity of banking regulations in India using different readability indicators. The focus is on the complexity of the language used in regulatory communication rather than complexity implicit in regulation by the very nature of the area/aspect that is being regulated. The analysis suggests that most circulars require at least graduate level education, which is generally the education level of commercial bank employees. Introduction Globally the scope and scale of regulation and its linguistic complexity have increased over the years with rise in risks and vulnerabilities in the financial system. These risks rose with proliferation of newer financial institutions and products that have necessitated use of sophisticated risk management tools. The global financial crisis saw an unprecedented scale of systemic risks at play. As macro-prudential regulations were introduced over and above the micro-prudential ones, the number of regulations materially increased.1 Interdependencies of regulators of different segments of the financial sector has also led to institutional architecture and regulation becoming more verbose or linguistically complex. Regulatory tightening in the wake of the Global Financial Crisis (GFC) was indeed a right move as the crisis itself was a proof of various problems such as lower capitalisation or higher leverage of the entities that went under. Regulation in most countries is more or less aligned with the Basel norms and international best practices. While the Basel accords started off as non-statutory, when member countries saw the merit in adhering to these global norms, they adopted them as an overlay or framework within which the domestic regulation was underpinned. Soon these additional regulations increased the scope and density of regulation. Moreover, the Basel regulation itself has become increasingly complex, a mere page count shows an increase from 30 pages in the initial Basel I to 347 pages in Basel II and 1,868 pages in Basel III (Haldane and Madouros, 2012; BCBS 2024). Regulators attempt to ensure transparency and clarity as linguistic complexity can erode economic efficiency because complex regulations are more difficult for economic agents to comprehend and implement. Plain language communication by governments and central banks is essential to ensure regulatory fairness and promote effective compliance. Across the globe there have been various initiatives for adoption of simpler or “plain” language in Government regulations. The ‘plainlanguage.gov’ was an initiative launched by the US government in 1994. In the UK such an initiative took the form of ‘Good Law’ principles issued by the Parliamentary Council in 2013. Transparent communication, clear interpretation and accurate articulation of the multifarious objectives of the RBI are the goals of its communication policy.2 New Zealand has also recently passed a plain English bill to make democracy more ‘accessible’.3 Quantification of complexity of regulation is not yet an exact science but over the years some metrics have been used to grade the extent of complexity of regulation. We outline some of the concepts pertaining to complexity and the extant approach in quantifying these concepts. De Lucio and Mora-Sanguinetti (2022) identifies three dimensions of complexity: quantity, quality and interconnectedness. The paper notes that the literature on the subject has so far analysed regulatory complexity in terms of the quantity (such as number of pages, words and sentences). Regulations can also be complex for qualitative reasons, such as ambiguities in their wording or their references to other legal documents. The relational approach refers to complexity derived from how rules are connected to each other. Regulations with more references to other regulations take more resources to be understood, and are hence more complex. In a similar vein, Colliard and Georg (2020) draws attention to three different dimensions of complexity: “problem complexity”, “psychological complexity” and “computational complexity”. Problem complexity refers to complexity that arises due to the regulatory problems that the regulation addresses. Such complexity is independent of the language used. Psychological complexity, on the other hand, reflects the difficulty of understanding a particular solution to a problem – it depends on how the text is written. The last dimension, i.e., computational complexity depends on the entity to which the regulation is applied. A related study, but slightly different from the above two studies4, lists three different dimensions to central bank communications: the ease of reading and the degree of reasoning as assessed by different kind of audiences (Huang and Simon, 2021). While the concept of readability and reasoning are important components of transparency of communication, the third dimension of audience is necessary since central bank communications are for wide range of audiences: from economists and financial market participants to politicians, the media and the general public. Another important aspect of regulations is restrictiveness or binding constraints in the wording of regulations. Al-Ubaydli and McLaughlin (2017) created a database called RegData using Natural Language Processing (NLP) techniques to count binding constraints or restrictiveness for industry-specific federal regulations of the US. This database has been used to study the determinants of industry regulations and to study regulations’ effects on other economy wide variables such as policy uncertainty, economic growth, and employment growth. As Colliard and Georg (2022) states: ‘Despite a heated debate on the perceived increasing complexity of financial regulation, a comprehensive framework to study regulatory complexity is lacking’. The growth in computing power has, however, made research in textual analysis much easier and there is a growing body of empirical literature in central banking communications – for example, ECB (Ferrara and Angino, 2022), Philippines (Batac et al., 2019), Canada (Deslongchamps, 2018) and India (Misra and Aastha, 2023). Coming to actual measurement of complexities, studies predominantly use aspects like length of the document. This paper tries to contribute towards developing a multifaceted understanding of the complexity of regulation by capturing more dimensions of complexity. It attempts to measure various indicators of complexity of regulations by the central bank in India. The purpose of this exercise is to gauge domestic trends in linguistic complexity of regulation (circulars). The focus is on the complexity of the language used in regulatory communication rather than complexity implicit in regulation by the very nature of the area/aspect that is being regulated. We compute quantity as well as restrictiveness measures of regulations. In addition, we compute few indicators for ease of reading regulations as proxies for quality aspect of complexity, as well as the level of regulatory inter-connectedness. This paper also tries to develop a composite indicator to capture dimensions of complexity using Principal Component Analysis (PCA). This paper is a novel attempt on measuring linguistic complexity of banking regulations in India, although there has been some effort to quantify regulations in India by Bedi and Narang (2021). The rest of the paper proceeds as follows. Section II discusses data sources and our methodology for text analysis. Section III reports initial empirical results, while Section IV provides comparative results of different metrics used for readability analysis. Section V concludes and discusses the way forward for future work. | Table 1: Stylised Facts about the documents analysed | | Statistic | Mean | St. Dev. | Min | Max | | Pages | 7.90 | 10.40 | 1 | 46 | | Sentences | 66.93 | 84.93 | 6 | 308 | | Words | 2,018.49 | 2,677.89 | 210 | 10,185 | | Links/urls (first level) | 4.68 | 7.10 | 0 | 34 | | Restrictive words | 34.39 | 38.85 | 2 | 165 | | Syllables | 3,469.12 | 4,612.74 | 289 | 16,884 | | Note: All the statistics are computed for 41 documents. | II. Data and Methodology for Measuring Linguistic Complexity of Regulations II.1 Data and Stylised facts The data for this study consists of a set of circulars of the Department of Regulation (DoR), Reserve Bank of India. For comparing the change in linguistic complexity over time we examine a few important regulatory circulars issued by DoR over the past 5 years, 2017-18 to 2021-22. The list of the 41 documents that have been considered for this analysis is given in Section IV.4, Table 3. Table 1 gives summary statistics of the documents we have analysed in this study. On average, the number of pages is about 8, with the most voluminous documents amounting to 46 pages and 10,185 words in terms of page count and word count, respectively. While the smallest document consists of only 6 sentences, the biggest document in terms of number of sentences has 308 sentences. The mean number of restrictive words (explained later in section III.2) in a document is about 34 in our sampled documents. Documents tend to refer to other documents via url links. The mean number of links present per document is 4.68 in our sampled documents. 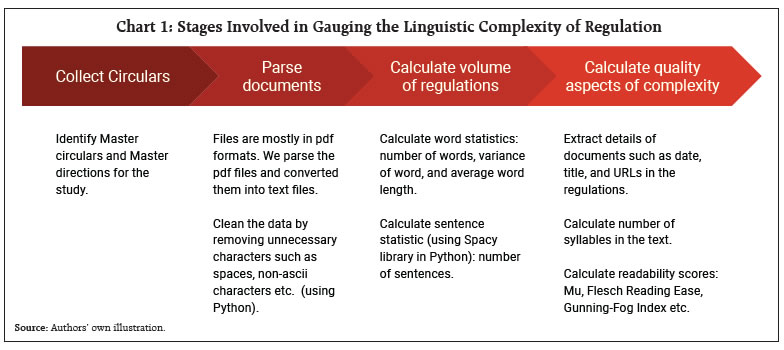 II.2 Methodology Chart 1 shows different steps of how the analysis has been conducted. The first step in this process was to identify and collect circulars from the RBI website. All the reports evaluated in this study were obtained in the PDF version. After parsing the text, all materials unrelated to readability analysis were removed. These include bits of unnecessary characters in the text – such as headers, footers, page numbers, extra spaces or line breaks, and index of documents. Supporting content such as charts, tables, pictures were also removed in this step. Once the data was parsed and structured, we extract text attributes required for readability analysis such as number of words, syllables, sentences and characters in words. When identifying end of sentence, care was taken to ensure consistency across all text files. Finally, complexity of the documents was calculated using various indicators.5 III. Empirical Analysis In this section, we quantify various aspects of selected RBI regulations under four different features: i) size or volume, ii) restrictiveness, iii) readability and iv) inter-dependence. The third feature i.e., readability - a proxy for linguistic complexity – is discussed using five different readability formulas: Flesch Kincaid Grade Level, Automated Reading Index, Gunning Fog Index, Flesch Reading Ease and Mu or Readability μ (details are provided later). III.1 Size An often-used measure for ‘quantity’ of regulation concept is the length of regulation. For example, Haldane and Madouros (2012) use the number of pages of different Basel Accords. The rationale for this is that excessive volume of regulations may make it difficult for regulated entities to manage them and verify their validity. Chart 2 shows the trend in the size of regulations, given by the total number of words in a document. The average number of words per regulation in the sampled data is found to be around 2000, shown by the dashed line. The yearly averages are shown by different lines for each year. The most voluminous regulation was in the year 2017-18 with more than 10,000 words.6 Except for few documents which are very large, most of the documents (around 80 per cent) are below the average of 2000 words. The number of documents, indicated by the dots in the chart, has come down in 2019-20 and 2020-21. The average size of regulation is highest in 2019-20. In 2020-21, which is the period corresponding to COVID-19 restrictions, all published regulations were relatively small. 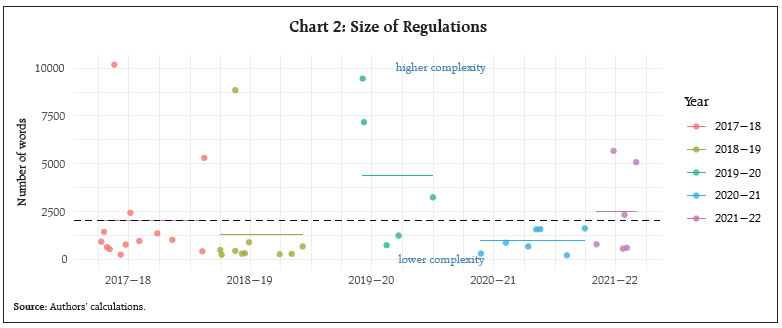
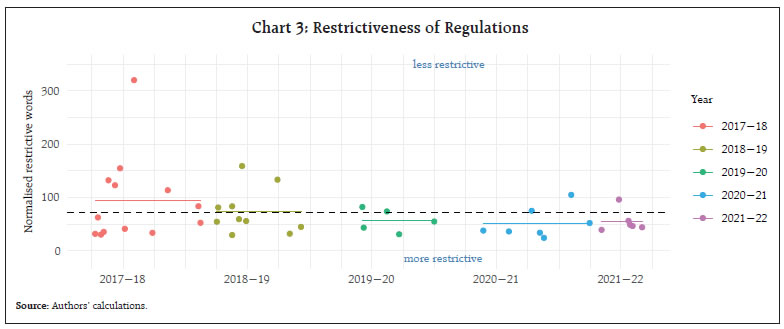 III.2 Restrictiveness Restrictiveness refers to how often restrictive words appear in the document. We chose the following 12 restrictive or binding words used for study of restrictiveness of Indian laws by Bedi and Narang (2021): “prohibited”, “prohibition”, “prohibit”, “shall be punishable”, “shall be punished”, “imprisonment”, “fine”, “restrictions”, “shall be liable”, “cancel”, “impose”, and “guilty of”. In addition to these ‘restrictive words’, we add some restrictive words which we think are relevant for banking regulation. The additional restrictive words are: “comply”, “permissible”, “restrict”, “ensure”, “maintain”, “permit”, “restricted”, “implement”, “permitted”, “ought to”, “compulsory”, “compulsorily”, “require” and “discontinue”. For normalisation, the total number of words are divided by the number of restrictive words. Therefore, this metric shows the number of words after which a restrictive word appears. Chart 3 shows that the mean normalised restrictive word is 71, i.e., on average a restrictive word occurs after every 71 words. This is fairly close to the number in Bedi and Narang (2021) who found that for top 10 most restrictive Indian laws, a restrictive word occurs after every 70 words. III.3 Readability Measures Readability refers to how easy it is to read and understand a piece of text. In this study, we examine readability using five indices which are traditionally used in readability analysis. Of these, Flesch-Kincaid (FK) grade level, Automated Readability Index (ARI), Gunning Fog Index (GFI) and Flesch Reading Ease (FRE) are commonly used in readability analysis. We also compute readability indicator called Mu developed by Munoz and Munoz (2006). These readability measures can be grouped into two types based on their similarity and scale of measurement. The first type i.e., FK, ARI and GFI measures readability on a scale of schooling grades, indicating the grade level required to read a document. Thus, readability decreases (or complexity increases) with an increase in the metric. For example, a score of 6 in FK, ARI and GFI can be interpreted as a ‘very easy’ document which a person of sixth grade can understand. The other two (i.e. FRE and Mu) measures show readability on a scale of 0 to 100, having opposite directions – larger values indicate better readability. For example, a document with a score of 0-10 in FRE and Mu readability measures can be considered to be ‘extremely difficult’ while a score of 90-100 is ‘very easy’. III.3.1 Flesch-Kincaid Readability The Flesch-Kincaid readability tests are designed to indicate how difficult a passage in English is to understand. It is calculated in the following way: The “Flesch-Kincaid Grade Level Formula” presents a score as a U.S. grade level, making it easier to judge the readability level of texts. It can also mean the number of years of education generally required to understand this. Chart 4 shows that the average FKR scores for the documents in our study is 16, with maximum at 22 and minimum at 11. The average score of 16 indicates that a person with 21 (i.e. 16 + 5) years of education will be able to comprehend them. This compares well within the range of FKR scores reported by other Central Bank studies, for example, for Philippines (by Batac et al., 2019) and ECB (by Ferrara and Angino, 2022). III.3.2 Automated Readability Index Automated Readability Index (ARI) assesses the US grade level required to read a piece of text. In some ways, it is similar to FKR formula. Its difference is that rather than counting syllables, it counts characters. The more characters, the harder the word. It also counts sentences. This sets it apart from some other formulas. It is more suited for analysing technical writing.7 It is computed as follows: ARI score gives representation of the US grade level needed to comprehend the text. An ARI score of 14 means that a person with more than 24 years of age and whose grade level is equivalent to that of a Professor will be able to read that text. The average ARI score for our text sample is 18, which can be considered to be very high. In fact, all of the documents in our analysis are “difficult” or require 18 years of education which is post graduate level of education.
III.3.3 Gunning Fog Index Gunning (1952) developed the ‘Gunning fog index’ (GFI). This index estimates the years of formal education a person needs to understand the text on the first reading. It is calculated with the following expression: The Fog index for our texts range from 13 to 25 with the average value at 17. The ideal score for readability with the Fog index is 7 or 8. Anything above 12 is too hard for most people to read. For instance, The Bible, Shakespeare and Mark Twain have Fog Indexes of around 6 while leading magazines, like Time, Newsweek, and the Wall Street Journal average around 11.8 As shown in Chart 6, the documents in our analysis have an average GFI score of 17 indicating that the average document can be read by a person who has a post-graduate degree. III.3.4 Flesch Reading Ease Flesch Reading Ease (FRE) index is one of the most popular amongst the traditional readability formulas. It uses the same core measures (word length and sentence length) as the Flesch Kincaid Grade Level index but has different weighting factors and is computed as follows: It gives a text a score between 1 and 100, with 100 being the highest readability score. Scoring between 70 to 80 is equivalent to school grade level 8. This means text should be fairly easy for the average adult to read. All regulation texts in our sample have FRE score ranging from 14 to 58 with mean score of 33 (Chart 7). We can infer from these scores that the sampled regulations are more complex than what an adult with an average education level can read. Documents during the Covid period in 2020 were more readable with an average FRE score of 37, which is marginally higher than the 5-year average. III.3.5 Readability μ (Mu) This is a formula that calculates the ease of reading a text, developed by Muñoz and Muñoz (2006). They included in the calculations the number of words and the mean and variance of the number of letters of said words. The formula for readability μ (mu) is Chart 8 shows the complexity of regulations using Readability μ for our sampled regulations. Higher values of the score means more readable (or less complex) text. It is interesting to note that of all the indicators used in this study, this is the only index which is giving milder complexity scores. As shown in the graph, some documents are classified as ‘fairly easy’ or ‘plain’.
III.4 Interdependence of Regulation The extent of complexity also depends upon the extent of interdependence or cross references in the regulation. Complexity may increase with more relational nodes/ connections or cross-references in regulations. However, not all cross references may add to complexity, as some may be important for contextualisation or clarifying certain issues. Chart 9 illustrates the aspect of complexity of DoR regulations through the lens of interdependence. The average number of links per regulation is found to be around 5. Our approach here is to trace references only at the first level. As successive Basel norms evolved, global regulation evolved to the next level with additional regulatory requirements for adherence to these norms. For example, macroprudential norms were introduced over and above the microprudential ones. CCB, CCyB, LCR and NSFR were introduced, and capital calculations became more sophisticated, with additional variables like the ‘capital floor’ coming into play. This has been analysed in a Bank of England staff working paper (Amadxarif et.al, 2021). It points out that merely measuring the length of a document can underestimate the linguistic complexity as the number of cross-references requires the readers to relate the two documents of connected rules to comprehend it totally and hence are more complex. Over years some regulations may become obsolete and are replaced or revised. Such a process requires citations or links to the older circulars and increases linkages or interdependencies with other regulations. So, interrelated or linked regulations offer continuity and consistency, which is crucial in compliance, yet they do increase the complexity of the regulation. 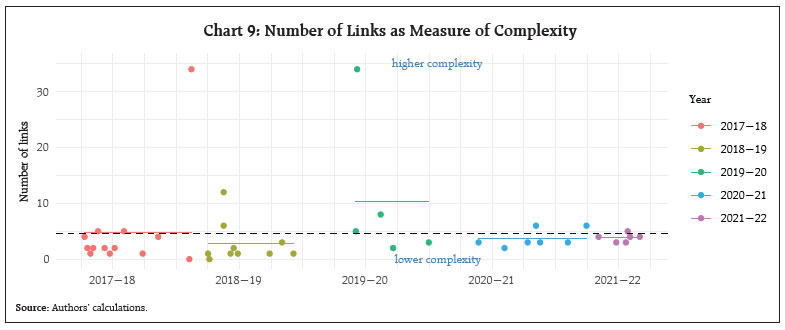 IV. Comparative Results and Discussions As mentioned in the introduction, there are many dimensions of linguistic complexity of regulations. In the previous section, we have analysed some of these dimensions using different metrics viz., size, restrictiveness, readability and inter-dependence. It is interesting to note that all metrics used in this study may not necessarily point towards the same direction and therefore we provide a comparative picture across measures. IV.1 Correlation of Readability Scores Readability indices are often correlated amongst each other as shown by results of correlation analysis and are presented in Chart 10. Lengthier regulations (i.e., more words) are found to have moderately high correlation with regulations which are more dependent on other regulations (i.e., have higher links). Interestingly, the number of words has negative correlation with Gunning Fog index, suggesting that linguistic complexity does not increase with size of the document. Higher number of links in a document has weak correlation with most of the indices. As expected, there is high positive correlation amongst the three grade level scores (GFI, ARI and FK). We expect negative correlation between this group of indices with the other two (FRE and readability μ) since they have opposite polarity. The highest correlation (though negative) is between FRE and FK Grade level, which is expected since both the indices used the same text attributes for calculating readability. Amongst the readability scores, ‘Readability μ’ is uncorrelated with most of the indices. In contrast, Flesch Kincaid Grade has high correlation with other readability metrics. 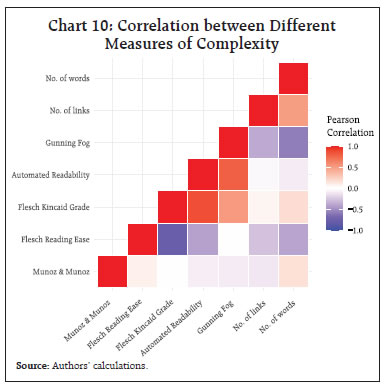 IV.2 Interpreting the Readability Formulas In Table 2, we compare some of the salient features and results of the readability formulas used in the study. The formulas use certain text attributes and calculate the readability giving different weighting factors to the attributes (See column 2, Table 2). The mean ARI score is 18 (range 14-28) which means that even the simplest of sampled regulations (i.e., ARI score of 14) requires 24+ years of education. The mean of Readability μ is 50 (range 28 to 73) which represents a level that is difficult or somewhat difficult. The mean score of 34 (range 19-59) for FRE represents “difficult to read, best understood by college graduates”. The mean score of FK grade level is 16 (range 11-23) corresponds to a level of difficulty equivalent to an academic paper. The minimum of Fog index is 16 (mean 21 and maximum 31), which represents readability for a College Senior in US education system. Overall, these results indicate that DoR regulations require college or post graduate level education to read and interpret them. Given that these regulations are not for the lay person but to commercial bank officers and staff, whose education level equals at least graduate or post graduate, this may not be a problem per se. There are, however, certain limitations to using formula-based indicators to text. For instance, while applying mathematical formula to literature, lot of questions can also be raised about the readability in a particular context. According to www.readable.com (an online toolkit that helps writers test and improve their readability score), some readability formulas are more suited for certain usage. As shown in the table below, Gunning Fog is more ideal for business writing as the index was in fact intended for business writing. However, this is not without contention. Loughran and McDonald (2016)9 demonstrated that Fog Index performs badly when applied to business documents. 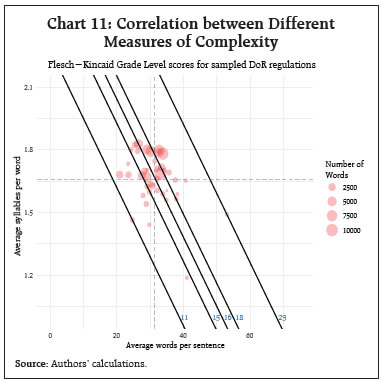 In all cases, except in the case of μ readability, readability formula is a linear function of some text attributes such as words per sentence, syllables per word etc. We attempt to interpret readability formula taking the case of Flesch Kincaid Grade Level in Chart 11. The figure shows the different combinations of words per sentence (X-axis) and syllables per word (Y-axis) of sampled regulations. We show five lines which represent five FKR scores of regulations: minimum (11), 25th percentile (15), median (16), 75th percentile (18) and maximum (23). | Table 2: Salient Features of Readability formulas used in this study | | Readability index | Text attributes used in the formula | Ideal usage | Mean of DoR regulations | Range of DoR regulations | Recommended range for general public | | Flesch-Kincaid Grade Level | W/S, Sy/W | General | 16 | 11-23 | ≤ 7 | | Automated Readability index | C/W, W/S | Technical writing | 18 | 14-28 | ≤ 7 | | Gunning Fog Index | W/S, DW/W | Business literature | 17 | 13-25 | ≤ 7 | | Flesch Reading Ease (FRE) | W/S, Sy/W | General | 33 | 14-58 | ≥ 70 | | Readability µ | W, C/W, var(C/W) | Spanish language | 51 | 28 to 75 | ≥ 70 | | Note: C/W = Average number of characters per word; W/S = Average number of words per sentence; W = Number of words; var(C/W) = variance of characters per word; Sy/W = Average number of syllables per word; DW/W = Percentage of difficult words. | The chart enables us to explore the different ways to achieve better readability. For example, for the most complex regulation by FKR score (23), the FKR Grade level can be brought down to 18, if average words per sentence is reduced to 40 from the current 53, while leaving the number of syllables unchanged at 1.5. Or with the share of words per sentence remaining the same, we can achieve better readability by reducing the number of syllables per word. Reducing both will have greater effect. IV.3 Trends in domestic regulations over the past 5 years To understand the overall trends of various complexity scores, we plot the mean scores of the indices across the years (Chart 12). Panel A of Chart 12 shows that the average of μ and FRE went down in 2019-20 indicating that complexity has increased in that year. Deciding on an index is not easy given the number of indices available and their limitations. It is generally best to choose an index that corresponds to the natural structure of the documents that one uses.10 It can be noted here that Flesch Kincaid has been used in recent central bank studies (Ferrara and Angino, 2022; Batac et al., 2019). Readability μ by Munoz and Munoz (2006), based on a non-linear combination of number of words, average letter per word and their variance, has also been used in a study by staff from Bank of Spain. This index is difficult to explain, and we are not aware of any other study in the English language which uses this index. All the other indices have been developed for the English language. So far in our analysis, we explore the various metrics of complexity using exploratory data analysis and evaluate complexity metrics by visualising their distributions and trends graphically. To evaluate whether the complexity scores are statistically different across years, a one-way ANOVA was performed to compare the differences in mean of the various complexity metrics. The analysis revealed that there was no statistically significant difference in mean for four of the five measures of complexity. Only the mean value of Gunning Fog Index was significantly different across the years. IV.4 Composite Index of Readability Finally, we created a composite index using Principal Component Analysis (PCA) of grade level scores given by FK, ARI and GFI. Our choice for using only these three indicators for PCA is due to a very important consideration that the use of PCA for constructing a composite index may fail if improperly used (Mazziotta and Pareto, 2016). We choose complexity indicators which are positively intercorrelated. As shown by Mazziato and Pareto (2016), using many highly important but poorly intercorrelated indicators may be unrepresented by the composite index. PCA shows that Gunning Fog Index has the highest factor loading on the first principal component. The first principal component explains almost 84 per cent of the total variance. We created the composite score by re-scaling the first principal component from PCA such that score of 100 means the easiest document, and 0 means the most difficult to read document in the sample. Table 3 below gives the composite scores of the documents. V. Conclusion The present study was designed to gauge trends in complexity of linguistic communication through domestic banking sector regulations (circulars) issued by Department of Regulation (DoR) of RBI during the five year period 2017-18 to 2021-22 using established measures of complexity. The analysis suggests that regulations require a graduate or post-graduate degree for an understanding, which makes them accessible to the banking community. There is no visible change in readability scores across the years, though during 2020-21, regulation documents were smaller and had relatively easier readability. | Table 3: Documents ranked by composite score index based on Principal Component Analysis | | Document | Com- posite Score | Length (No. of Words) | | 1 | Access of non-banks to centralised payment systems, 2021-07-28 | 100.0 | 2336 | | 2 | Financial Inclusion Access to Banking Services, 2019-08-14 | 95.4 | 739 | | 3 | Guidelines on Regulation of Payment, 2021-03-31 | 93.7 | 1618 | | 4 | Gold Monetisation Scheme, 2018-06-27 | 93.4 | 893 | | 5 | Constitution of Board of Management, 2019-12-31 | 86.2 | 3243 | | 6 | Opening of Current Accounts by Banks, 2020-08-06 | 84.7 | 873 | | 7 | Risk management Systems, 2017-04-27 | 84.2 | 640 | | 8 | Encouraging formalisation of MSME sector, 2018-06-06 | 83.9 | 297 | | 9 | COVID19 Regulatory Package, 2020-05-23 | 83.9 | 304 | | 10 | Appointment of Managing Director, 2021-06-25 | 83.1 | 5674 | | 11 | Opening of Current Accounts by Banks, 2021-08-04 | 82.5 | 1582 | | 12 | Maintenance of escrow, 2020-11-17 | 82.5 | 606 | | 13 | Guidelines on Compensation of Whole Time Directors, 2021-09-01 | 79.2 | 5084 | | 14 | Amendments to Master Direction, 2017-09-25 | 78.3 | 1355 | | 15 | Concurrent Audit System, 2019-09-19 | 76.6 | 1244 | | 16 | Resolution Framework 2.0 MSME, 2021-05-05 | 75.1 | 787 | | 17 | Recording Details of Transactions in Passbook, 2017-06-22 | 74.2 | 774 | | 18 | Resolution of Stressed Assets, 2018-02-13 | 72.5 | 5310 | | 19 | Rationalisation of Branch Authorisation, 2017-05-19 | 71.5 | 10185 | | 20 | Prudential Framework for Resolution of Stressed Assets, 2019-06-07 | 71.3 | 7177 | | 21 | Co-Lending by Banks and NBFCs, 2020-11-05 | 69.2 | 1564 | | 22 | Partial Credit Enhancement to Bonds Issued, 2018-11-02 | 67.7 | 290 | | 23 | Guidelines on Loan System, 2018-12-05 | 66.8 | 674 | | 24 | Large exposures framework, 2019-06-03 | 66.3 | 9456 | | 25 | Regulatory Retail Portfolio, 2020-10-12 | 65.7 | 676 | | 26 | Basel III Framework, 2017-08-02 | 65.1 | 960 | | 27 | Basel III Framework on liquidity Standards, 2018-05-17 | 62.0 | 8854 | | 28 | Relief for MSME Borrowers, 2018-02-07 | 61.7 | 418 | | 29 | Customer Protection, 2017-07-06 | 60.3 | 2439 | | 30 | Setting up of IFSC Banking Units, 2018-05-17 | 59.7 | 445 | | 31 | Banking Facility for Senior Citizens, 2017-11-09 | 59.3 | 1023 | | 32 | Individual Housing loans, 2017-06-07 | 55.4 | 246 | | 33 | Setting up IFSC, 2017-04-10 | 52.7 | 926 | | 34 | Revised PCA, 2017-04-18 | 52.4 | 1440 | | 35 | Timelines for Stressed Assets Resolution, 2017-05-05 | 51.4 | 533 | | 36 | Prudential Norms for Classification, 2018-04-02 | 49.6 | 491 | | 37 | BASEL3-CCB2021, 2021-02-05 | 46.2 | 210 | | 38 | Loans and advances, 2021-07-23 | 44.8 | 563 | | 39 | Liquidity Risk Monitoring Tools, 2018-09-27 | 44.6 | 267 | | 40 | Prohibition on dealing in Virtual Currencies, 2018-04-06 | 22.9 | 244 | | 41 | Basel II framework on Liquidity Standards, 2018-06-15 | 0.0 | 318 | | Note: Documents have been ranked from most readable to most complex | Going ahead, with more innovations and disruptions like the use of technology and AI in banking, regulation may become more complex and tools to address this complexity may also become easier and accessible to the regulators. There is also growing interest from banks and financial institutions in using technology (i.e., RegTech) for meeting regulatory and compliance requirements more effectively and efficiently. Striking the right balance is important to serve the objective of effective regulatory communication in a changing financial landscape. References Aikman, D., Galesic, M., Gigerenzer ,G., Kapadia, S., Katsikopoulos, K., Kothiyal, A., Murphy, E. and Neumann, T. (2021). “Taking Uncertainty Seriously: Simplicity Versus Complexity in Financial Regulation.” Industrial and Corporate Change 30 (2): 317 Al-Ubaydli, O., & McLaughlin, P. A. (2017). RegData: A numerical database on industry-specific regulations for all United States industries and federal regulations, 1997–2012. Regulation & Governance, 11(1), 109-123. Amadxarif, Z., Brookes, J., Garbarino, N., Patel, R., & Walczak, E. (2021). The language of rules: textual complexity in banking reforms. Staff Working Paper No. 834, Bank of England. Batac, C.V., Ocampo, J.C.G., Robleza I, E.J.D. and Ramos, C. F. (2019). “BSPeak: A Text Analysis of BSP’s Communications.” Bangko Sentral ng Pilipinas. Baquedano, M. M. (2006). “Legibility and Variability of the Texts.” Educational Research Bulletin, Pontifical Catholic University of Chile 21 (2): 13–26. Baquedano, M.M.M. and Urra, J.M.M. (2019). “Readability Mu.” Vina del Mar, Chile. Retrieved from http://www.legibilidadmu.cl. BCBS (2024). “The Basel Framework.” Basel Committee on Banking Supervision. https://www.bis.org/baselframework/BaselFramework.pdf Bedi, J. and Narang, P.(2021). “Quantitative Analysis of National Laws in India.” Centre for Civil Society. Blinder, A.S. (2010). “It’s Broke, Let’s Fix It: Rethinking Financial Regulation.” International Journal of Central Banking, 6 (34): 277– 330. Colliard, J. and Georg, C. (2020). “Measuring Regulatory Complexity.” CEPR Discussion Papers 14377. C.E.P.R. Discussion Papers. Dale, E. and Chall, J.S. (1948). “A formula for predicting readability: Instructions.” Educational Research Bulletin, 37–54. Deslongchamps, A. (2018). “Readability and the Bank of Canada.” https://www.banqueducanada.ca/2018/06/note-analytique-personnel-201820/. De Lucio, J. & Mora-Sanguinetti, J. S. (2022). Drafting “better regulation”: The economic cost of regulatory complexity, Journal of Policy Modelling, 44, issue 1, p. 163-183 Dombret, A. (2016). “Cui Bono? Complex Regulation and Its Consequences.” Speech by Dr Andreas Dombret, Member of the Executive Board of the DeutscheBundesbank, at the 20th Banking Symposium of the European Center for Financial Servicesat the University of Duisburg-Essen, Duisburg. Ferrara, F.M. and Angino, S. (2022). “Does Clarity Make Central Banks More Engaging? Lessons from ECB Communications.” European Journal of Political Economy 74: 102146. Gai, P., Kemp, M., Serrano, A. S. and Schnabel, I. (2019). “Regulatory Complexity and the Quest for Robust Regulation.” 8. Reports of the Advisory Scientific Committee; Reports of the Advisory Scientific Committee. Gunning, R. (1952). Technique of Clear Writing. McGraw-Hill. Haldane, A. G., and Madouros, V. (2012). “The Dog and the Frisbee.” Revista de Economı́a Institucional 14 (27): 13–56. Huang, J. and Simon, J. (2021). “Central Bank Communication: One Size Does Not Fit All.” Kincaid, J.P., Fishburne Jr, R.P., Rogers, R.L. and Chissom, B.S. (1975). “Derivation of New Readability Formulas (Automated Readability Index, Fog Count and Flesch Reading Ease Formula) for Navy Enlisted Personnel.” Naval Technical Training Command Millington TN Research Branch. Loughran, T. and McDonald, B. (2016). “Textual Analysis in Accounting and Finance: A Survey.” Journal of Accounting Research 54 (4): 1187–1230. Martinc, M., Pollak, S. & Robnik-Šikonja, M. (2021). “Supervised and Unsupervised Neural Approaches to Text Readability.” Computational Linguistics 47 (1): 141–79. Mazziotta, M and Pareto, A, (2016), , Rieds - Rivista Italiana di Economia, Demografia e Statistica - The Italian Journal of Economic, Demographic and Statistical Studies, 70 (1), p. 103-109. McLaughlin, G. H.(1969). “SMOG grading-a new readability formula.” Journal of Reading 12 (8): 639-46. Muñoz, M., and J. Muñoz (2006). Legibilidad Mμ, Viña del Mar, Chile. Misra S., and Aastha (2023), “Monetary Policy Report as a Communication Tool: Evidence from Textual Analysis”, RBI Bulletin December 2023, p. 143-154. Smith, E. A. & Senter, R.J. (1967). “Automated Readability Index.” Cincinnati Univ OH.
|