The outlook for the global economy is turning fragile as the descent of inflation is stalling, re-igniting risks to global financial stability. Capital flows have become volatile as nervous investors turn risk averse. There is a growing optimism that India is on the cusp of a long-awaited economic take-off. Recent indicators are pointing to a quickening of the momentum of aggregate demand. Non-food spending is being pushed up by the green shoots of rural spending recovery. A modest easing of headline inflation in the reading for April 2024 confirms the expectation that an uneven and lagged pace of alignment with the target is underway. I. Introduction Globally, a frisson of apprehension stirs the air. Even as succour is being drawn from the ‘resilience’ of global growth, the descent of inflation is stalling, re-igniting risks to global financial stability and growth itself. Alongside the looming spectres of unsustainable public debt and the fragmentation of global trade, the outlook for the global economy is turning fragile. In fact, the world is priming for more balanced growth - surveys of purchasing managers point to a cooling of activity in the United States (US) in the second quarter while the eurozone is gaining pace and the United Kingdom (UK) exited recession. Major emerging market economies (EMEs) also experienced output expansion. The narrowing of the growth divergence is being mostly driven by services even as export orders and suppliers’ delivery time improved, but the persisting weakness in manufacturing remains a concern. The rapid fall of inflation through 2023, which took the headline to or below target in about a third of economies worldwide by the first quarter of 2024, has slowed in terms of month-on-month (m-o-m) changes across advanced economies (AEs) and EMEs. Services inflation has exhibited stickiness at pre-pandemic levels, although core goods inflation has fallen steadily. Looking ahead, the ongoing disinflation may proceed more slowly than expected. The last mile is confronted with the last lags. The worry is what looks like noise may turn out to be the trend, leaving inflation closer to 3 per cent rather than the AEs’ target of 2 per cent: “inflation is still too high, further progress in bringing it down is not assured, and the path forward is uncertain.”1 Recent high frequency indicators are suggesting that a modest recovery in world trade volumes is holding on from early 2024, with services export orders strengthening alongside cross-border travel and air freight traffic. There is also a vigorous growth in e-commerce. Attacks on shipping in the Red Sea are resulting in trade flows being re-routed, with average daily container vessels between January and April being 51 per cent lower than in the last quarter of 2023. The Organization for Economic Cooperation and Development (OECD) estimates that re-routing has affected 9 per cent of world maritime trade and 18 per cent of long-haul ocean volumes, resulting in journey time for affected cargo between Europe and Asia rising by about 30 per cent. With drought in the Panama Canal having also impacted journey time, shipping costs have risen 60 per cent higher than their 2023 levels. The overall shipping and logistics environment remains challenging in which shipping majors are focussing on efficiency and streamlined structures so as to reduce costs. Indicators of supply chain pressures have so far worsened only marginally; however, higher shipping costs will slow the pace of disinflation globally. A potential debt crisis casts an ominous shadow over the global economic landscape. The International Monetary Fund’s (IMF’s) Global Debt Monitor reported total global debt (private plus public) to have risen to US$ 235 trillion, equivalent to 238 per cent of global GDP. There is grave concern that fiscal prudence may take a back seat in 2024 as more than half the world’s population goes to elections. As interest rates remain elevated to fight stubborn inflation, debt servicing costs are spiralling. This can feed a vicious cycle of financial instability by straining government finances and household budgets, choking off credit and investment. Unsustainable debt levels can worsen sovereign ratings and constrain governments’ ability to raise resources for productivity-enhancing public investments. Overleveraged corporations can face heightened bankruptcy risks. At the household level, precarious finances can portend drastic cuts in consumer spending amidst job losses and higher borrowing costs, thereby stifling aggregate demand. The debt crisis has already affected developing countries the most, accentuating their vulnerabilities. A full-blown debt crisis could reverse decades of progress on poverty alleviation, fighting disease, and taking forward development. The time to act against the gathering storm is now, beginning with reforming the international financial architecture, democratising finance, harmonising cross-border bankruptcy regimes and adequately funding multilateral safety nets. In the emerging world, capital flows have turned volatile again as nervous investors turn risk averse. Nonetheless, confidence is holding up better in many emerging economies where growth has remained resilient as in India, Indonesia and Mexico. High frequency indicators of consumer spending have moderated a little recently and the growth of industrial production ex-China has remained soft. Asian emerging economies, particularly India and Indonesia, are expected to continue to experience broadly stable and rapid growth according to the OECD, while inflation should moderate further provided food prices remain insulated from extreme weather events. In Latin America, especially in Brazil and Mexico, growth is holding up well, supported by resilient labour markets, infrastructure investment and near-shoring of manufacturing. Inflation is likely to ease towards targets next year. The recent global sovereign debt roundtable meeting held on the sidelines of the IMF-World Bank spring meetings in mid-April offered a ray of hope for low- and middle-income countries overburdened with debt. In the past three years, the number of sovereign debt defaults in these countries has surged to 18, outstripping the total of the previous two decades. Spending on debt servicing is five times higher than a decade ago. According to the UNCTAD’s update of April 2024, nine low- and middle-income countries fell into debt distress, with an additional 25 on the brink. In this context, the roundtable proposed setting a target of programme approvals within 2-3 months for future debt restructuring cases, including under the G20 common framework for debt treatment. The need for enhanced information flow was emphasised, and in this regard the multilateral institutions need to play a proactive role. Global financial conditions have eased modestly. As market expectations and central bank guidance align, equity prices have strengthened amidst a receding of volatility, especially for tech-related stocks. Bond yields have been rising since early 2024 in response to expectations of a firmer future path of interest rates as early rate cut hopes recede, and also because of sensitivity to rising fiscal risks and liquidity tightness due to quantitative tightening. In contrast, corporate bond spreads have moderated across rating categories, despite an increase in the number of corporate bankruptcies in some parts of the world. The US dollar has appreciated in nominal effective terms, although some of this strengthening is reflecting the persisting weakness in the yen. Consequently, sizeable depreciations have pulled down emerging market currencies. Heightened geopolitical tensions are exerting substantial upward pressures on key commodity prices, with crude oil and gold leading the surge. Base metal prices have seen a strong revival in 2024 after being beaten down in 2023. This could impede the decline of inflation from current levels and hence dampen early prospects of monetary policy easing. The recent upturn in commodity prices in the context of the moderating momentum of global growth reflects several factors at play besides geopolitical developments – tightening supply conditions; climate change; pick-up in infrastructure spending in China; and firming demand on the back of industrial activity and trade. While the World Bank commodity prices are projected to decline in 2024 and 2025 on subdued global growth, risks remain tilted to the upside, mainly due to conflict disrupting energy supplies and weather events. Internationally there is a growing optimism that India is on the cusp of a long-awaited economic takeoff. While revising India’s GDP growth upwards by close to 2 percentage points for 2023-24, the IMF’s April 2024 World Economic Outlook (WEO) alludes to the robustness of growth expected in 2024 and 2025 as “reflecting continuing strength in domestic demand and a rising working-age population”.2 The OECD’s May 2024 Economic Outlook points to strong momentum in India in recent monthly indicators and expects “strong investment and improving business confidence in India …to sustain real GDP growth”.3 There is considerable appreciation about the dramatic reduction in poverty. The World Bank estimates4 that at the height of the pandemic in 2021, only 12.9 per cent of the population lived on US$ 2.15 a day – the global benchmark for extreme poverty. More recent estimates show that extreme deprivation, once considered synonymous with India, is set to become extinct. There is worldwide focus on the transformation of the physical infrastructure, including highways, ports and airports. India’s power sector has attained 100 per cent electrification and has been integrated in a single grid across the country. Daily power availability has increased to 20 hours in rural areas and 23.5 hours in urban areas. Aggregate technical and commercial losses have narrowed considerably. There has been a leap in renewable energy capacity creation, with India becoming the world’s third largest renewable energy producer. It has attained world leadership in leveraging the digital public infrastructure for payment efficiency, financial inclusion and direct benefit transfers. Currently, India boasts the highest number of digital transactions, fuelled by a massive internet user base. Broadband connectivity has also seen a significant leap, reaching over 93 per cent of our villages. The Bharat Net project will connect all villages through high-speed internet. Digital platforms like the Open Network for Digital Commerce (ONDC) are empowering small businesses by providing a larger marketplace. India’s digital public infrastructure – the India Stack – is boosting productivity, efficiency and generating employment, besides enabling better targeting of fiscal transfers. Recent indicators are pointing to a quickening of the momentum of aggregate demand. In the personal consumption space, Nielsen IQ data indicate that a welcome pivot is underway that will boost this category of spending. For the first time in at least two years, rural demand for fast moving consumer goods (FMCG) has outpaced urban markets - in the quarter just gone by, FMCG volume growth of 6.5 per cent was driven by rural growth of 7.6 per cent relative to urban growth of 5.7 per cent on the back of robust demand for home and personal care products. The sequential easing of urban consumption growth is attributable to slowdown in volume growth of staples (rice; salt; atta), reflecting high inflation in these categories. On the other hand, non-food spending, including car and two-wheeler sales, is being pushed up by the green shoots of rural demand. Turning to private investment, for listed private manufacturing companies, retained earnings remained the major source of funds during the second half of 2023-24. They were mainly used to build up fixed assets and non-current investments, indicating a pick-up in new capacity creation relative to the first half of the year. Results that have been declared by listed corporates so far indicate that they closed the financial year 2023-24 with the highest growth in quarterly revenues registered in January-March 2024 both year-on-year (y-o-y) and sequentially. On the other hand, operating profit growth moderated as rising expenditure – especially input costs for manufacturing firms and staff costs for information technology (IT) companies - shaved off the gains in earnings. Other income, reflecting income from dividends and treasury activities, declined on an annual basis, partly due to an unfavourable base effect. Overall, net profits declined y-o-y for listed non-financial companies for the first time after four consecutive quarters of robust growth. This suggests that gross value added (GVA) by manufacturing would have been muted in the fourth quarter of 2023-24 relative to preceding quarters, weighing in on overall GVA/GDP growth of the economy. Listed banking and financial sector companies, on the other hand, posted a robust quarterly performance in terms of both top-line and bottom-line growth, notwithstanding increase in provisioning costs and interest expenses. With net profits expanding by double digits owing to robust credit disbursal, GVA of the financial sector is likely to have expanded strongly in January-March 2024. These developments are discussed in greater detail in Section IV. Private investment activity in India is being bolstered by the adaptability and resilience of mergers and acquisitions (M&A) amidst global challenges. Traditionally dominant sectors like financial services, technology, media and telecom are experiencing declines but large-scale consolidation and restructuring is driving up M&A activity.5 Energy is clearly the sunrise sector for M&As on the back of transactions in renewables. Cross-border investments are the locomotive force, with inbound strategic private equity deals on a rising profile while outbound deals have fallen substantially. Net exports reveal diverging patterns. The share of petroleum products has stagnated as also that of chemicals and marine products, while the share of gems and jewellery has halved and that of readymade garments has declined. Success stories are of engineering exports and cotton, including yarn and fabrics. Services exports have jumped significantly. According to the UNCTAD, India beat the world average in services exports in 2023. The biggest gain was in digitally traded services, followed by travel. Currently, India is the seventh largest exporter of services in the world and the second largest among developing countries. Business services have seen a ramp-up on the back of global capability centres. Although the share of software exports in the total has eased to about 46 per cent, global IT expenditures are expected to grow by 8 per cent in 2024 and IT exports from India may outpace global IT spending, led by the consulting segment.6 A modest easing of headline inflation in the reading for April 2024 confirmed our expectation that an uneven pace of alignment with the target is underway. The prices of vegetables, cereals, pulses, meat and fish in the food category may keep the headline elevated and closer to 5 per cent in the near-term, in line with projections set out in the April MPC resolution in spite of deflation in fuel prices and further softening of core inflation to a new historic low. While statistical base effects may help pulling down the headline inflation in July and August, it is expected that September may see a reversal. It is only in the second half of the year that a durable alignment with the target may re-commence and sustain till numbers closer to the target are sighted during the course of 2025-26. Set against this backdrop, the remainder of the article is structured into four sections. Section II covers the rapidly evolving developments in the global economy. An assessment of domestic macroeconomic conditions is set out in Section III. Section IV encapsulates financial conditions in India, while the last Section sets out concluding remarks. II. Global Setting The global activity is moderating amidst momentum of a halting decline in inflation, flattening of consumer confidence, and some easing of labor market conditions. Despite moderate easing, financial conditions remain tight, especially in housing and credit markets. In its Economic Outlook of May 2024, the OECD projected global growth at 3.1 per cent in 2024 (same as in 2023), before edging up to 3.2 per cent in 2025 on the support from stronger real income growth and lower policy interest rates. These projections place global growth lower than the pre-pandemic average (2013-2019) of 3.4 per cent (Table II.1).
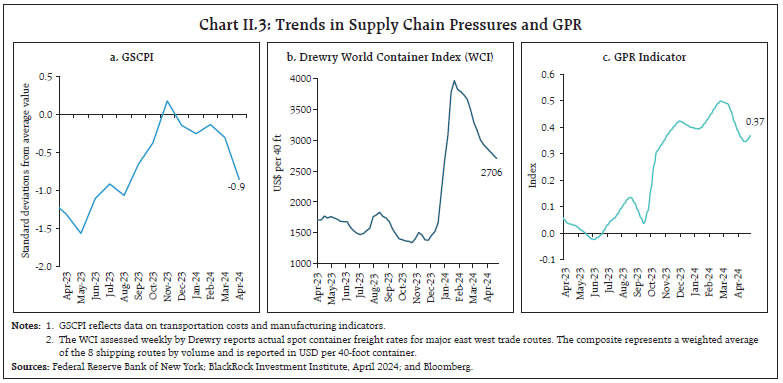
The outlook is levelling across economies, with Europe and most low-income economies gaining pace recently, while the US economy is moderating and many large EMEs are poised for a stronger performance. India is projected to remain the fastest growing major economy (Chart II.1). Our nowcast for global GDP points to sustained growth momentum during Q1:2024 but some deceleration in Q2:2024 (Chart II.2). The global supply chain pressures index (GSCPI) and the container shipping costs have moderated since February 2024 (Chart II.3a and II.3b). The geopolitical risks (GPR) index has, however, edged up since mid-April 2024 due to rekindling of tensions between Iran and Israel (Chart II.3c). GPR continue to be a major risk to global growth (Box 1). 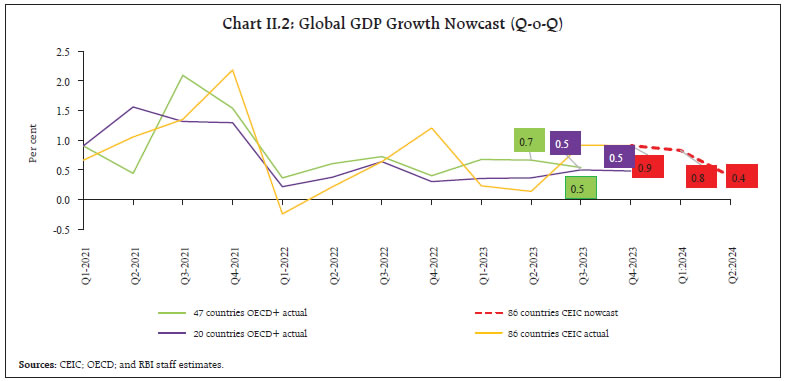
Box 1: Impact of Geopolitical Risks on Economic Growth: A Cross Country Analysis Geopolitical tensions and supply chain disruptions have emerged as new challenges for global economy in the post-pandemic era (Das, 2024). Increased tensions are impacting trade flows and disrupting supply chains even in bystander countries. Sanctions and tariffs are leading to shortages of key resources such as oil and gas with spillovers to commodity prices and eventually economic output. The confluence of these factors may result in higher inflation, lower growth and significant welfare losses (Góes and Bekkers, 2022). Additionally, GPR can affect economic growth through the financial channel, increased uncertainty, higher risk premia and asset price surges (GFSR, 2023). A monthly index of GPR counting the occurrence of words related to geopolitical tensions in leading international newspapers7 shows multiple episodes of increase in GPR over the last three decades (Caldara and Iacoviello, 2022) [Chart B1]. 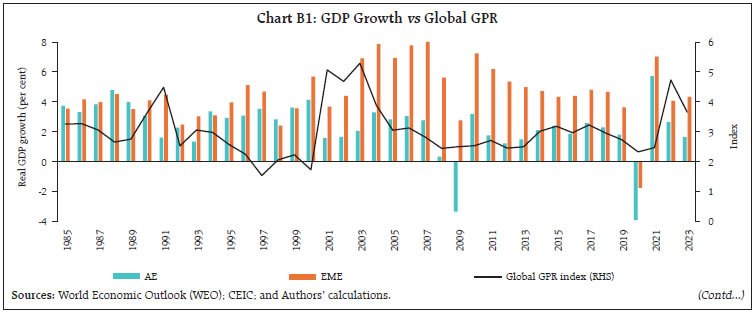
| Panel Regression Results (Fixed Effects) | | Variables | (1) | (2) | (3) | (4) | (5) | | Real GDP growth | Real GDP growth | Real GDP growth | Real GDP growth | Real GDP growth | | GPR Index | -0.736** | -0.746* | -0.593 | -0.794** | -0.782** | | | (0.341) | (0.440) | (0.362) | (0.368) | (0.373) | | EMEs * GPR Index | -4.164* | -4.269** | -2.935** | -2.650** | -2.616** | | | (2.142) | (2.077) | (1.412) | (1.232) | (1.245) | | Control variables | | | | | | | Private consumption (per cent of GDP) | | Y | Y | Y | Y | | Govt. consumption (per cent of GDP) | | | Y | Y | Y | | Investment (per cent of GDP) | | | | Y | Y | | Trade of goods and services (per cent of GDP) | | | | | Y | | constant | 4.187*** | 3.893*** | 19.13*** | 25.09*** | 16.06*** | | | (0.454) | (0.610) | (3.555) | (3.719) | (3.542) | | Observations | 1,113 | 1,113 | 1,113 | 1,113 | 1,113 | | R-squared | 0.424 | 0.490 | 0.512 | 0.538 | 0.538 | | Number of regions | 42 | 42 | 42 | 42 | 42 | Notes: 1. EMEs is a dummy variable which is coded as 1 for EMEs and 0 for AEs.
2. The results include time fixed effects.
3. The parenthesis include robust standard errors.
4. *, **, and *** denote statistical significance at the 10 per cent, 5 per cent, and 1 per cent levels, respectively.
Sources: CEIC; and Authors’ calculations. | A panel data regression framework using data for 42 countries during 1996 to 2023 shows that GPR has a significant negative effect on real GDP growth. The significant inverse interaction between GPR and a dummy variable for EMEs in the results implies that EMEs face a larger drag on their growth from an increase in GPR. References: 1. Caldara, D., and Iacoviello, M. (2022). Measuring Geopolitical Risk. American Economic Review, 112 (4): 1194-1225. 2. Das, S., (2024). Fundamental Shifts in the Global Economy: New Complexities, Challenges and Policy Options (Keynote Address). 59th SEACEN Governors’ Conference, Mumbai. 3. Goes, C., and Bekkers, E. (2022). The Impact of Geopolitical Conflicts on Trade, Growth, and Innovation. World Trade Organization (WTO) Staff Working Paper. 4. International Monetary Fund (2023). Geopolitics And Financial Fragmentation: Implications for Macro-Financial Stability. Global Financial Stability Report (GFSR) [Chapter 3]. | Consumer sentiments ebbed across major economies in April 2024, reflecting increased economic uncertainty (Chart II.4a). Financial conditions in some regions, with hardening of government bond yields, and volatility in equity markets while it marginally eased in others (Chart II.4b).
The global composite purchasing managers index (PMI) recorded a sequential uptick in April 2024 as faster increase in service sector output offset a mild slowdown in manufacturing production. The services PMI rose to a ten-month high, supported by increased intake of new business, reduced backlog of work and new export orders. The global manufacturing dipped marginally in April 2024; however, it remained in expansionary territory for the third consecutive month as output and new orders continued to grow (Chart II.5). The global trade outlook continued to improve and the composite PMI for export orders maintained its uptrend in April 2024 (Chart II.6). Notably, the manufacturing export orders index returned to expansion for the first time since February 2022, reaching a 26-month high in April. The services export orders index has remained in expansion since January 2024. 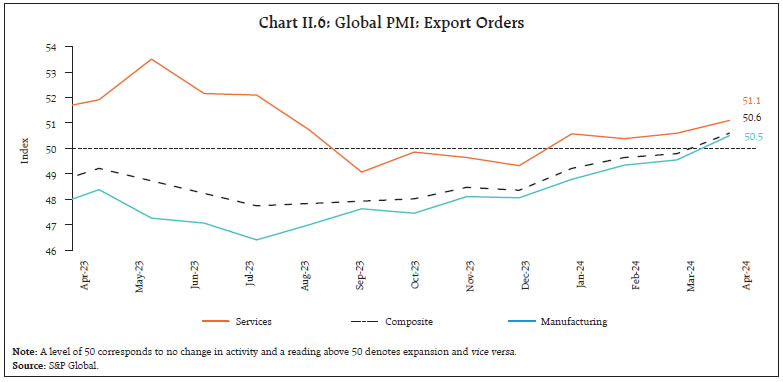 Global commodity prices increased further in April, driven by higher crude oil and metals prices. The Bloomberg commodity index increased by 2.2 per cent (m-o-m) [Chart II.7a]. Brent crude oil prices increased by 5.6 per cent in April, hovering at US$ 90 per barrel till mid-April but reversed trend thereafter (reaching US$ 81.3 per barrel as on May 15) as optimism surrounding a potential ceasefire in the Middle East contributed to a reduction in risk premium (Chart II.7b). A sharp rise in the US crude oil inventories also contributed to the recent pullback of prices. The Food and Agriculture Organization’s (FAO’s) food price index rose by 0.3 per cent (m-o-m) in April 2024, primarily driven by an increase in the prices of meat (1.6 per cent), which was partially offset by a fall in sugar prices (-4.4 per cent). The index, however, recorded a decline of 7.4 per cent (y-o-y), mainly due to an 18.3 per cent decline (y-oy) in cereals prices (Chart II.7c). Gold prices touched record highs in April, ending 8.3 per cent higher vis-à- vis March on concerns over a potential escalation in the Middle East region triggering safe haven demand (Chart II.7d). Easing of geopolitical tensions, however, led to a moderation in gold prices during early May 2024. Headline inflation exhibited reticence in traversing the last mile of disinflation and remained above target in most economies. In the US, consumer price index (CPI) inflation eased to 3.4 per cent in April from 3.5 per cent in March, while the headline personal consumption expenditure (PCE) inflation increased to 2.7 per cent in March from 2.5 per cent in February. As per flash estimates, euro area inflation remained unchanged at 2.4 per cent in April. Japan’s CPI inflation (excluding fresh food) eased marginally to 2.6 per cent in March, while CPI inflation in the UK softened to 3.2 per cent (Chart II.8a). Among EMEs, inflation moderated in Brazil while it ticked up in China in April (Chart II.8b). Core and services inflation remained higher than headline inflation across major AEs (Chart II.8c and II.8d). 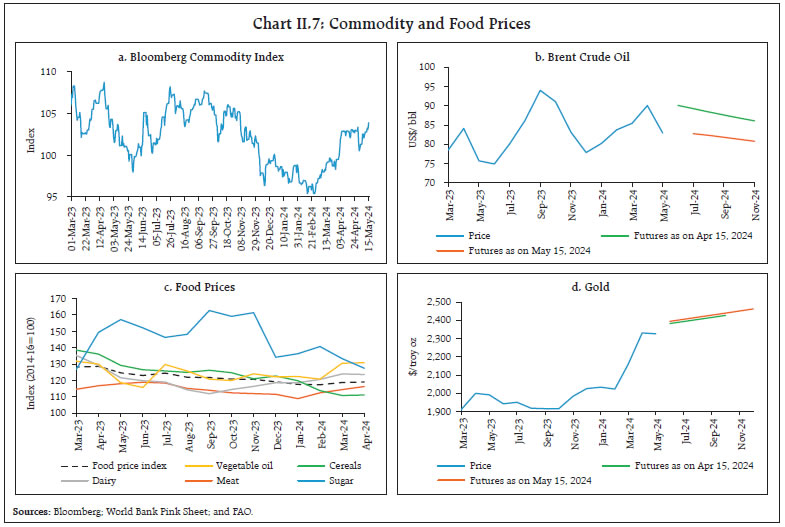 In April 2024, global equity markets retreated from the highs recorded in March. The Morgan Stanley Capital International (MSCI) world equity index decreased by 3.4 per cent as data on strong consumer demand and high PCE inflation in the US rekindled concerns about interest rates remaining higher for longer (Chart II.9a). Disappointing semiconductor earnings, and escalating GPR also contributed to the downturn. Equity markets, however, recovered in first half of May as geopolitical tensions in the Middle East de-escalated and the labour market and inflation in the US exhibited signs of easing. The US government securities (G-sec) yields – both 10-year and 2-year – hardened by over 40 basis points (bps) each in April as financial markets priced in fewer rate cuts by the US Fed in 2024. However, it reversed trend in early May, softening by over 30 bps each (Chart II.9b). In the currency markets, the US dollar index strengthened on the back of restrictive US monetary policy and trimmed probability of rate cuts by the Fed but recorded moderation in first half of May post the release of softer US inflation print and consumer spending data. The MSCI currency index for EMEs mirrored the greenback’s movement in April, exacerbated by capital outflows, especially in the equity segment (Chart II.9c and II.9d). Major central banks, especially in AEs, retained their restrictive policy stance, holding their policy rates steady in their latest meetings. On the other hand, the Czech Republic and Sweden which lowered their policy rates by 50 bps and 25 bps, respectively in their May meetings (Chart II.10a). Amongst EME central banks, Brazil and Peru reduced their policy rates by 25 bps each in their May meetings while Hungary and Columbia cut their benchmark rates by 50 bps each in their April meetings. Indonesia, however, hiked its policy rate by 25 bps in its April meeting after maintaining the rate steady in the previous five meetings (Chart II.10b).
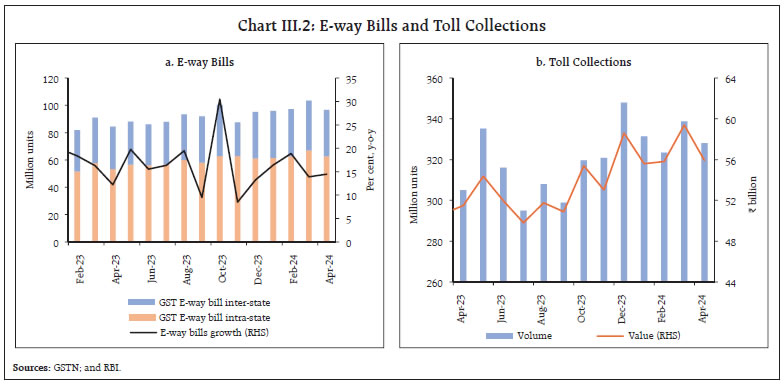
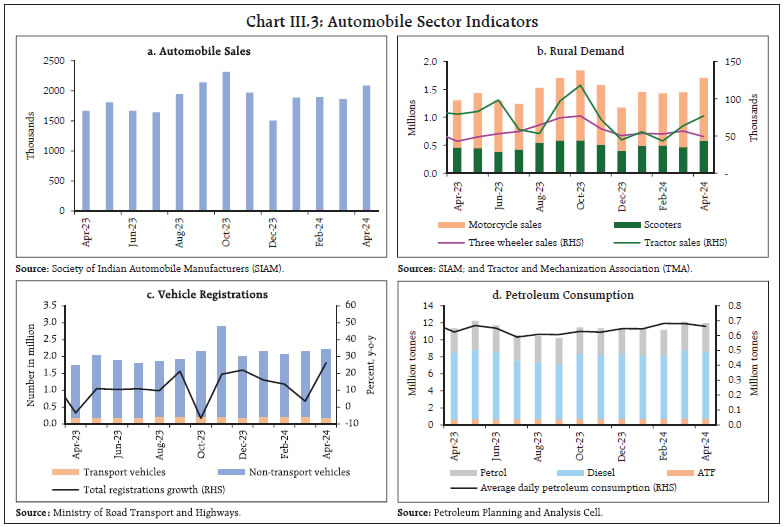
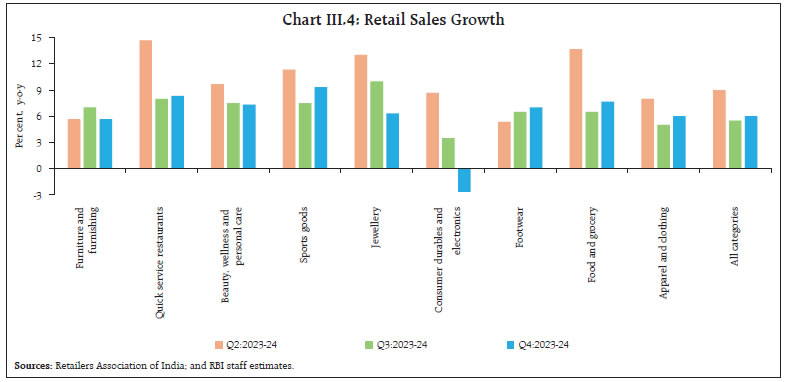
III. Domestic Developments The Indian economy has demonstrated marked resilience in the face of geopolitical headwinds imparting supply chain pressures (Chart III.1a). According to the economic activity index (EAI), activity rebounded in April and early estimates suggest that GDP growth for Q1:2024-25 is likely to remain close to 7.5 per cent (Chart III.1b and III.1c). Aggregate Demand High frequency indicators point towards sustained momentum in domestic demand conditions in April 2024. E-way bills grew by 14.5 per cent (y-o-y) in April 2024, notwithstanding a sequential moderation from a record high of 10.4 crore in March 2024 (Chart III.2a). Toll collections increased by 8.6 per cent (y-o-y) in April 2024 (Chart III.2b). Automobile sales increased by 25.4 per cent (y-o-y) in April 2024, led by a strong growth in two wheelers and three wheelers segment while passenger vehicles recorded the highest-ever monthly sales.8 Domestic tractor sales exhibited signs of improvement in April 2024 (Chart III.3a and III.3b). Vehicle registrations recorded a sequential pick up in April 2024, driven by the non-transport vehicles segment (Chart III.3c). Average daily petroleum consumption increased by 6.1 per cent in April 2024, led by motor spirit (petrol) and aviation turbine fuel (ATF) [Chart III.3d]. According to the business survey conducted by the Retailers Association of India, retail sales growth (y-o-y) gained momentum in Q4:2023-24 from the previous quarter, driven by acceleration in sales growth of sports goods, food and grocery, apparel and clothing, footwear and quick service restaurants (Chart III.4). The renewable electricity sector anticipates substantial project completions this fiscal year and the next.9 Green power projects valued at approximately ₹700 billion are slated to be operational this year, marking the highest investment completion in any single year to date. Moreover, incremental project investments are projected to surge to ₹765.2 billion by 2025-26, propelled by the policy focus on enhancing India’s dependence on eco-friendly energy sources. 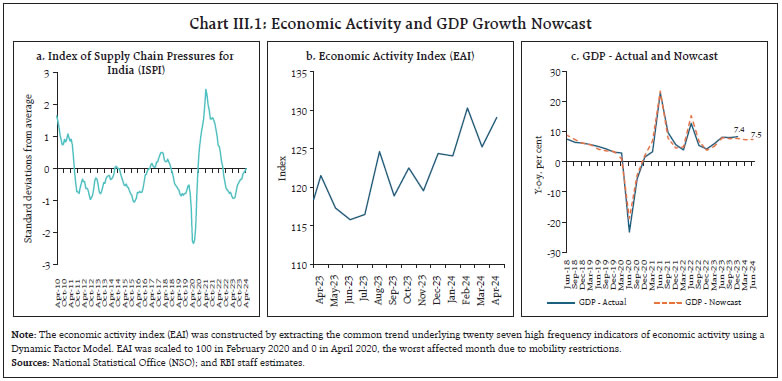
 As per the Quarterly Urban Periodic Labour Force Survey (PLFS) released on May 15, 2024 the labour force participation rate (LFPR) and the worker population ratio (WPR) increased during Q4:2023-24 – the LFPR for persons aged 15 years and above increased to 50.2 per cent, the highest since the survey’s inception (Chart III.5). The WPR increased to 46.9 per cent, up from 46.6 per cent in Q3, driven by higher female workers. The rise in employment was driven by self-employment, while the share of regular salaried and casual labour remained the same as in the preceding quarter. The unemployment rate (UR) was at 6.7 per cent as against 6.5 per cent in Q3. As per the data from the Centre for Monitoring of Indian Economy (CMIE), the all-India UR was at 8.1 per cent in April (Chart III.6a). The LFPR and employment rate (ER) fell marginally as compared to the previous month (Chart III.6b).
In April 2024, organised manufacturing employment recorded the fastest expansion in the last seven months, as captured by the PMI employment outlook. Services job creation continued to be in expansionary zone in April, albeit with a sequential moderation from a seven-month high recorded in March (Chart III.7). Household demand for work under the Mahatma Gandhi National Rural Employment Guarantee Act (MGNREGA) witnessed an increase of 18.0 per cent (m-o-m) in April with the rabi harvesting season coming to an end in most parts of the country. MGNREGA employment, however, recorded a decline by 10.6 per cent on a y-o-y basis (Chart III.8).
India’s merchandise exports at US$ 35.0 billion grew by 1.1 per cent (y-o-y) in April 2024, as a favourable base effect more than offset the negative momentum (Chart III.9). Out of 30 major commodities, 13 commodities (accounting for 46.7 per cent of export basket) registered an expansion on y-o-y basis. Electronic goods, organic and inorganic chemicals, petroleum products, drugs and pharmaceuticals, and cotton yarn, fabrics, made-ups and handloom products supported export growth, while engineering goods, iron ore, gems and jewellery, marine products, and oil meals dragged down overall exports in April (Chart III.10).
Merchandise imports at US$ 54.1 billion expanded by 10.3 per cent (y-o-y) in the month as base effect more than offset negative momentum (Chart III.11). Among the 30 major commodities, 16 commodities (accounting for 58.7 per cent of import basket) registered growth on a y-o-y basis in April. Petroleum crude and products, gold, electronic goods, pulses, and vegetable oil supported import growth, while pearls, precious and semi-precious stones, coal, artificial resins, plastic materials, iron and steel, and machinery were the main drags in April (Chart III.12).
The merchandise trade deficit widened to a 5-month high of US$ 19.1 billion in April 2024 as exports contracted more than imports on a sequential basis. The non-oil deficit widened to US$ 9.3 billion in April from US$ 3.8 billion in March. The share of the oil deficit in the overall merchandise trade deficit, however, declined to 51.5 per cent in April from 75.9 per cent a month ago (Chart III.13). Petroleum products were the largest source of the trade deficit in April, followed by electronic goods (Chart III.14). 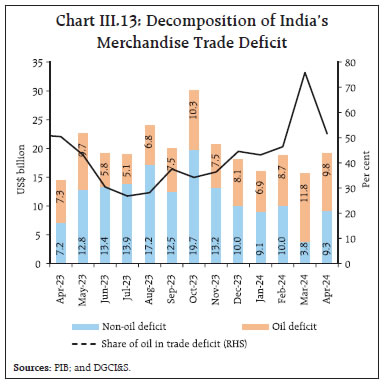 Services exports at US$ 30.0 billion fell by 1.3 per cent (y-o-y) in March 2024, reflecting a slowdown in business, software and transportation services. Services imports declined by 2.1 per cent (y-o-y) to US$ 16.6 billion, primarily led by a decline in transportation services (Chart III.15). As a result, net services exports earnings dropped by 0.4 per cent (y-o-y) to US$ 13.4 billion in March 2024. The outlook for India’s software services, however, remains supportive, with global IT spending estimated to grow by 8 per cent to US$ 5.1 trillion in 2024.10
Goods and services tax (GST) collections (Centre plus States) in April 2024 recorded a y-o-y growth of 12.4 per cent, surpassing the ₹2 lakh crore mark for the first time (Chart III.16). April usually sees the highest GST collections for any financial year due to higher year-end economic activity.11 Aggregate Supply As per the Indian Meteorological Department’s (IMD’s) first long-range forecast for the south-west monsoon (SWM) season, rainfall during June-September 2024 is likely to be above normal this year12 with most parts of the country experiencing above normal rainfall (Chart III.17). Additionally, as per IMD13, the SWM is likely to set in over Kerala on May 31 as against the usual date of June 01. In its latest release dated May 13, 2024, the National Oceanic and Atmospheric Administration (NOAA) has forecasted a transition from El Niño to El Niño-Southern Oscillation (ENSO) neutral in June 2024 with La Niña developing by June-August 2024 (with 49 per cent probability) or July-September 2024 (with 69 per cent probability). This is usually associated with increased rainfall activity. Low summer/pre-monsoon rainfall, higher than normal maximum temperatures and heatwave days in summer season14, however, continue to remain as major risk factors (Chart III.18a). As on May 15, 2024, summer rainfall (March-May) remained 12 per cent below the long period average (LPA) as compared to 18 per cent higher than LPA a year ago. The water storage level in major reservoirs stood at 27 per cent of total reservoir capacity at the all-India level, which was 20.8 per cent lower than last year and 7.7 per cent lower than the decadal average (Chart III.18b).
As of May 10, 2024 75.9 lakh hectares of the summer crop area15 have been sown, registering an increase of 8.9 per cent over a year ago, with higher acreage under rice, pulses, coarse cereals and oilseeds (Chart III.19). The cumulative procurement of wheat in the rabi marketing season (RMS) so far (till May 14, 2024) stood at 256.4 lakh tonnes, which was marginally lower than the corresponding period last year (Chart III.20a). To expedite the procurement, select state governments such as Rajasthan and Madhya Pradesh have relaxed procurement norms in the last week of April. As on May 01, wheat stock stood at 259.6 lakh tonnes which was well above the quarterly buffer norm (Apr-Jun 2024) (Chart III.20b). The cumulative procurement of rice in the kharif marketing season so far (October 01, 2023 – May 14, 2024) stood at 482.8 lakh tonnes. As of May 01, 2024, the public stock of rice stood at 508.9 lakh tonnes (3.7 times the buffer norm). Despite a sequential moderation, the headline PMI for manufacturing remained in expansionary territory in April 2024, buoyed by new orders and output (Chart III.21a). The PMI for services also continued to expand, albeit at a slower pace, driven by growth in new business and output (Chart III.21b).
Indicators of freight transport exhibited a mixed picture. Railway freight revenue recorded a growth of 6.3 per cent (y-o-y) in February 2024, supported by growth in freight movement of cement (Chart III.22a). Cargo traffic at major ports increased by 1.3 per cent in April 2024, led by coking coal and other miscellaneous cargo (Chart III.22b). Construction sector indicators recorded near double-digit growth as steel consumption increased by 9.4 per cent in April 2024 and cement production increased by 10.6 per cent in March 2024 (Chart III.23).
Available high frequency indicators for the services sector reflect resilience in economic activity in April 2024 (Table III.1). Inflation Headline inflation, as measured by y-o-y changes in the all-India CPI16, moderated to 4.8 per cent in April 2024 from 4.9 per cent in March as a positive momentum of 48 bps was more than offset by a favourable base effect of 51 bps (Chart III.24). Among the major groups, the momentum was positive at around 65 bps and 55 bps for food and core groups (i.e., excluding food and fuel) respectively, while the fuel group recorded negative momentum of around 100 bps. Food inflation (y-o-y) edged up to 7.9 per cent in April from 7.7 per cent in March. In terms of sub-groups, inflation firmed up in cereals, meat and fish and fruits while eggs, milk, vegetables, pulses, sugar, spices, non-alcoholic beverages and prepared meals registered a moderation in inflation (Chart III.25). Edible oils remained in deflation, albeit at a slower rate. Fuel and light prices deflation deepened to around (-) 4.2 per cent in April from (-) 3.4 per cent in March, mainly on account of sharper deflation in LPG prices on a y-o-y basis. Electricity prices, however, recorded a y-o-y inflation of 10.2 per cent in April 2024. Core inflation eased further to 3.2 per cent (y-o-y) in April from 3.3 per cent in March, the lowest in the current CPI (2012=100) series. The moderation was mostly broad-based as inflation in pan, tobacco and intoxicants, clothing and footwear, transport and communication, recreation and amusement, and education softened, whereas personal care and effects inflation registered a pick-up (Chart III.26). Inflation in housing, household goods and services, and health prices remained steady. In terms of regional distribution, rural inflation stood at 5.43 per cent, higher than urban inflation (4.11 per cent) in April 2024. Majority of the states experienced inflation less than 6 per cent (Chart III.27).
High frequency food price data for May so far (up to 13th) show that cereal prices declined, mainly driven by wheat. Pulses prices registered a broad-based increase, while edible oil prices softened. Amongst key vegetables, onion prices have dropped further in May so far. Potato and tomato prices continue to rise (Chart III.28).
As price pressures in the case of onions abated, the government shifted onion exports from ‘prohibited’ to ‘free’ category on May 03, with 40 per cent export duty and with a minimum export price (MEP) condition of $550 per metric tonne (MT). To ensure adequate supply of pulses, the government has extended duty-free imports of yellow peas till October 31, 2024. Desi chana (Bengal gram) has been exempted from import duty till March 2025. Retail selling prices of petrol and diesel in the four major metros have remained steady in May so far (up to 13th). Kerosene and LPG prices were also unchanged (Table III.2). The PMIs for April 2024 indicate that input costs as well as output prices recorded a faster rate of expansion in the manufacturing sector (Chart III.29). In the services sector, the rate of expansion for both input and selling prices moderated.
| Table III.2: Petroleum Products Prices | | Item | Unit | Domestic Prices | Month-over-month (per cent) | | May-23 | Apr-24 | May-24^ | Apr-24 | May-24^ | | Petrol | ₹/litre | 102.92 | 100.91 | 100.91 | 0.0 | 0.0 | | Diesel | ₹/litre | 92.72 | 90.72 | 90.72 | 0.0 | 0.0 | | Kerosene (subsidised) | ₹/litre | 47.55 | 49.57 | 49.57 | 0.0 | 0.0 | | LPG (non-subsidised) | ₹/cylinder | 1113.25 | 813.25 | 813.25 | 0.0 | 0.0 | ^: For the period May 1-13, 2024.
Note: Other than kerosene, prices represent the average Indian Oil Corporation Limited (IOCL) prices in four major metros (Delhi, Kolkata, Mumbai and Chennai). For kerosene, prices denote the average of the subsidised prices in Kolkata, Mumbai and Chennai.
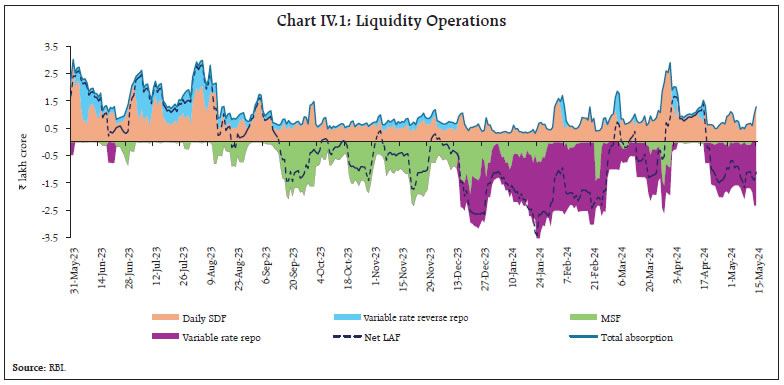
Sources: IOCL; Petroleum Planning and Analysis Cell (PPAC); and RBI staff estimates. | IV. Financial Conditions Build-up of government cash balances because of advance tax payments and goods and services tax (GST) related outflows led to pressure on system liquidity since April 20, 2024. In response, the average daily net injection under the liquidity adjustment facility (LAF) [including marginal standing facility (MSF)] stood at ₹0.80 lakh crore during April 16 to May 15, 2024 as against average daily net absorption of ₹0.20 lakh crore during March 16 - April 15, 2024 (Chart IV.1). During April 16 to May 15, 2024 the Reserve Bank injected liquidity into the banking system through two main and nine fine-tuning variable rate repo (VRR) operations, cumulatively amounting to ₹6.3 lakh crore. The demand for funds was robust as reflected in the high bid-cover ratios for both main and fine-tuning VRR auctions. Of the average total absorption at ₹0.80 lakh crore during the second fortnight of April through May 15, 2024, placement of funds under the standing deposit facility (SDF) amounted to ₹0.74 lakh crore, down from ₹1.18 lakh crore during March 16 to April 15, 2024. The remaining amount of ₹0.06 lakh crore was absorbed through variable rate reverse repo (VRRR) operations conducted during April 16 to May 15, 2024. During this period, the Reserve Bank received a cumulative total offer of ₹1.63 lakh crore as against the total notified amount of ₹1.75 lakh crore. 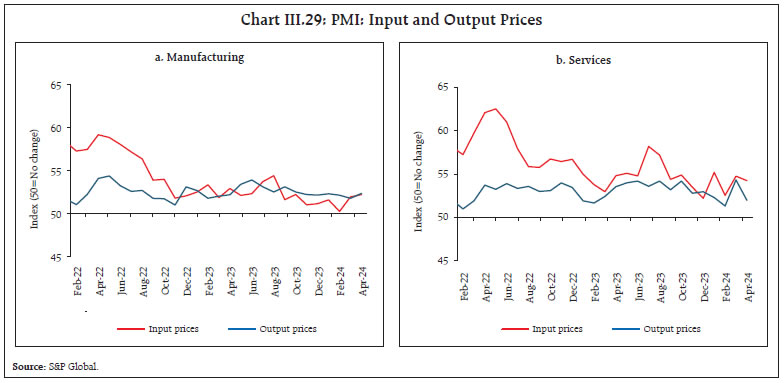
 In the overnight money market, the weighted average call rate (WACR) remained within the LAF corridor and averaged 6.60 per cent during April 16 to May 15, 2024, the same as during March 16 - April 15, 2024 (Chart IV.2a). Rates in the collateralised segment – the triparty and market repo rates – moved in tandem with the WACR. On an average basis, the triparty repo and the market repo rate traded 5 bps and 2 bps, respectively, above the policy repo rate during April 16 to May 15, 2024 (Chart IV.2b). Across the term money market segment, yields on certificates of deposit (CDs) and commercial paper (CP) for non-banking financial companies (NBFCs) eased, however, that on 3-month treasury bills (T-bills) hardened marginally (Chart IV.2b). The average risk premia in the money market (3-month CP minus 91-day T-bill) reduced to 79 bps during April 16 – May 15, 2024 from 103 bps during March 16 - April 15, 2024.
In the primary market, fund mobilisation through issuances of CDs at ₹0.46 lakh crore during 2024-25 (up to May 3) was higher than ₹0.27 lakh crore in the corresponding period of the previous year in response to sustained demand for credit (Chart IV.3). On the other hand, issuances of CP at ₹0.84 lakh crore during 2024-25 (up to April 30) were lower than ₹1.11 lakh crore in the corresponding period of the previous year. The yield on the 10-year Indian benchmark government security (G-sec) closed at 7.08 per cent on May 15, 2024, softening from 7.18 per cent on April 15 (Chart IV.4a). Indian sovereign bonds remained resilient and insulated from the volatility in global markets during this period due to declining government borrowings, increasing demand due to global bond index inclusion and a stable rupee. The yield curve shifted downwards, with relatively sharper decrease in yields across the mid to the long end of the curve across the term structure (Chart IV.4b). On May 3, 2024 the Government of India announced the buyback of its securities through auction for an aggregate amount of ₹40,000 crore. The Reserve Bank accepted offers to buy g-sec aggregating ₹0.10 lakh crore against bids received worth ₹0.53 lakh crore (1.33 times the notified amount of ₹0.40 lakh crore) at the auction conducted on May 9, 2024. 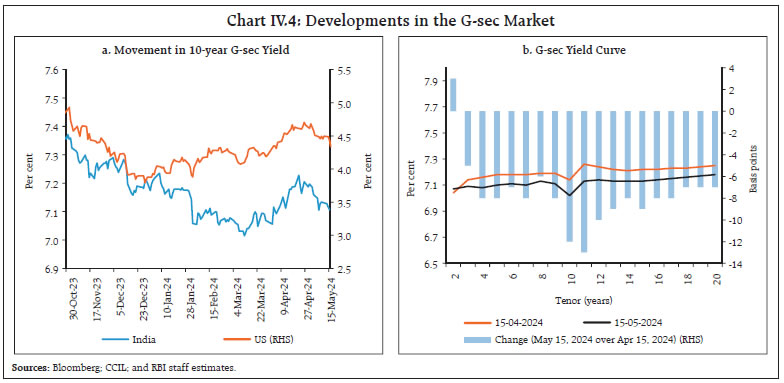 Corporate bond yields and risk premia exhibited mixed movements across diverse maturity profiles and the rating spectrum during April 16 to May 14, 2024 (Table IV.1). Overall, corporate bond issuances during 2023-24 at ₹8.6 lakh crore were higher than ₹7.5 lakh crore during the same period of the previous year. Growing demand from long-term domestic investors and foreign players has facilitated raising of larger funds at affordable rates in the debt market by corporates and banks. | Table IV.1: Financial Markets - Rates and Spread | | Instrument | Interest Rates (per cent) | Spread (bps) | | (Over Corresponding Risk-free Rate) | | Mar 16, 2024 – Apr 15, 2024 | Apr 16, 2024 – May 14, 2024 | Variation | Mar 16, 2024 – Apr 15, 2024 | Apr 16, 2024 – May 14, 2024 | Variation | | 1 | 2 | 3 | (4 = 3-2) | 5 | 6 | (7 = 6-5) | | Corporate Bonds | | | | | | | | (i) AAA (1-year) | 7.90 | 7.83 | -7 | 74 | 66 | -8 | | (ii) AAA (3-year) | 7.88 | 8.01 | 13 | 67 | 72 | 5 | | (iii) AAA (5-year) | 7.75 | 7.92 | 17 | 52 | 62 | 10 | | (iv) AA (3-year) | 8.47 | 8.61 | 14 | 126 | 132 | 6 | | (v) BBB- (3-year) | 12.08 | 12.19 | 11 | 488 | 490 | 2 | Note: Yields and spreads are computed as averages for the respective periods.
Sources: FIMMDA; and Bloomberg. | Reserve money (RM), excluding the first-round impact of change in the cash reserve ratio (CRR), recorded a growth of 5.0 per cent (y-o-y) as on May 10, 2024 (7.9 per cent a year ago) [Chart IV.5]. The growth in currency in circulation (CiC), the largest component of RM, decelerated to 2.9 per cent from 7.6 per cent a year ago, reflecting the withdrawal of ₹2000 banknotes17 – 97.8 per cent of them has been returned to the banking system, mostly in the form of deposits (as on May 19, 2024).
Money supply (M3) rose by 11.1 per cent (y-o-y) as on May 3, 2024 (9.7 per cent a year ago).18 Aggregate deposits with banks, the largest component of M3, increased by 12.4 per cent (10.0 per cent a year ago). Scheduled commercial banks’ (SCBs’) credit growth stood at 15.9 per cent as on May 3, 2024 (15.4 per cent a year ago) [Chart IV.6]. SCBs’ deposit growth (excluding the impact of the merger) remained in double digits in April 2024 (Chart IV.7).
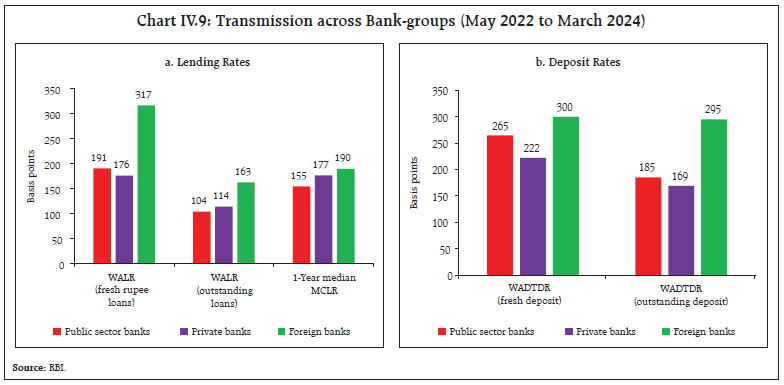
As on April 19, 2024 the system level incremental credit-deposit ratio stood at 90.7 per cent (Chart IV.8). With the statutory requirements for CRR and statutory liquidity ratio (SLR) at 4.5 per cent and 18 per cent, respectively, around 77 per cent of deposits were available with the banking system for credit expansion as on April 19, 2024. In response to the 250 bps change in the policy repo rate since May 2022, the external benchmark-based lending rate (EBLR) increased by a similar magnitude. The 1-year median marginal cost of funds-based lending rate (MCLR) increased by 166 bps during May 2022 to April 2024. Consequently, the weighted average lending rate (WALR) on fresh and outstanding rupee loans increased by 186 bps and 113 bps, respectively, during May 2022 to March 2024. In the case of deposits, the weighted average domestic term deposit rates (WADTDRs) on fresh and outstanding deposits increased by 259 bps and 185 bps, respectively, during the same period (Table IV.2). Transmission across bank groups indicates that the increase in deposit and lending rates was higher in the case of public sector banks (PSBs), except for outstanding loans, during May 2022 to March 2024 (Chart IV.9). The lending rates of PSBs remained lower than those of private banks, while their deposit rates were higher. | Table IV.2: Transmission to Banks’ Deposit and Lending Rates | | (Variation in bps) | | Period | Repo Rate (bps) | Term Deposit Rates | Lending Rates | | WADTDR - Fresh Deposits | WADTDR- Outstanding Deposits | EBLR | 1-Yr. MCLR (Median) | WALR- Fresh Rupee Loans | WALR- Outstanding Rupee Loans | | Easing Period Feb 2019 to Mar 2022 | -250 | -259 | -188 | -250 | -155 | -232 | -150 | | Tightening Period May 2022 to Mar 2024 | 250 | 259 | 185 | 250* | 166* | 186 | 113 | Note: Data on EBLR pertain to 32 domestic banks.
*: Data on EBLR and MCLR pertain to April 2024.
WALR: Weighted Average Lending Rate. WADTDR: Weighted Average Domestic Term Deposit Rate;
MCLR: Marginal Cost of Funds-based Lending Rate; EBLR: External Benchmark based Lending Rate.
Source: RBI. |
 During Q4:2023-24, listed non-government non-financial (NGNF) companies exhibited a modest pick-up in top-line growth. Sales growth of listed NGNF companies improved to 8.3 per cent (y-o-y) during Q4:2023-24 from the previous quarter, mainly driven by the manufacturing sector.19 The performance of information technology (IT) companies remained subdued during Q4 primarily on account of weakness in banking, financial services and insurance sector, and discretionary spending (Chart IV.10). In line with revenues, operating profit margin moderated in Q4 (Table IV.3). Staff cost of IT companies rose modestly, despite reduction in their headcounts, with the top five IT companies reducing their global headcount by 11,432 during Q4. 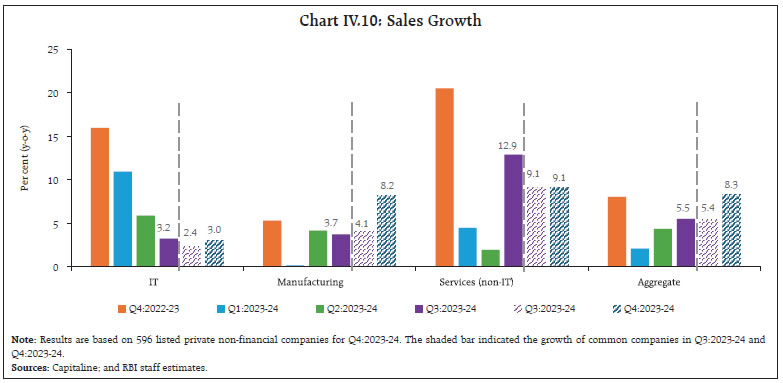
| Table IV.3: Profit Margin | | Sector | No. of Companies | Operating Profit Margin (per cent) | Net Profit Margin (per cent) | | Q4: 2022-23 | Q3: 2023-24 | Q4: 2023-24 | Q4: 2022-23 | Q3: 2023-24 | Q4: 2023-24 | | IT | 59 | 23.1 | 24.2 | 23.5 | 17.7 | 18.9 | 20.0 | | Manufacturing | 369 | 14.3 | 15.2 | 14.9 | 11.8 | 10.8 | 9.1 | | Services (non-IT) | 119 | 28.7 | 29.0 | 29.8 | 7.8 | 8.6 | 10.0 | | Aggregate | 596 | 16.8 | 17.9 | 17.4 | 12.6 | 11.8 | 11.0 | | Sources: Capitaline; and RBI staff estimates. | Manufacturing companies registered 8.2 per cent growth in sales in Q4:2023-24 (4.1 per cent in Q3). Sales growth of early reporting non-IT services companies stood at 9.1 per cent during Q4:2023-24 (Chart IV.10). In the case of listed banking and financial sector companies20, revenues, which primarily include the interest income in case of banks, registered strong double-digit growth (Chart IV.11). Other income, which includes income from fees, commissions, profit, and loss from investments also exhibited strong growth for banking and financial sector companies, reflecting the impact of gains from a specific sale transaction undertaken by a private sector bank. Growth in expenditure outpaced growth in revenues amidst an increase in interest expenses; however, growth in operating profit exhibited a sequential improvement. Furthermore, net profit growth remained in double digits during the quarter. Domestic equity market registered gains in the fourth week of April 2024, tracking positive global cues, strong domestic macroeconomic data releases, and resilient Q4:2023-24 corporate earnings results. Equity prices registered some correction thereafter amidst FPI sell-offs, before exhibiting some recovery on positive global cues and further easing of domestic CPI inflation. The benchmark BSE Sensex closed at 72,987 on May 15, 2024, with the equity market recording sharp swings in volatility, as measured by India VIX21 in the past one month (Chart IV.12). In April 2024, there was also a mega mobilisation of ₹18,000 crore through follow-on-public offer (FPO) by a telecom company. 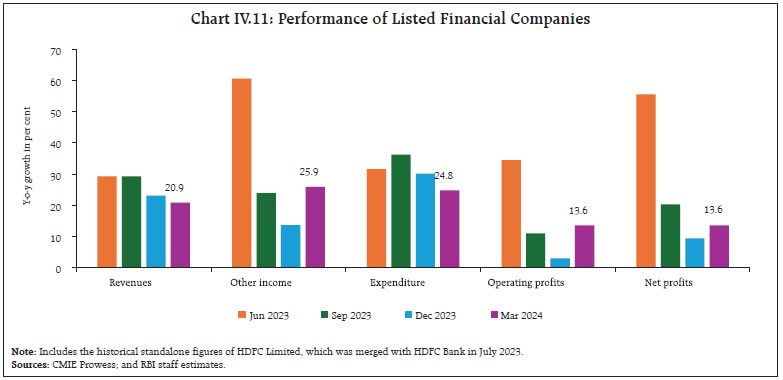
 Gross inward foreign direct investment (FDI) almost remained stable at US$ 71.0 billion during 2023-24 (US$ 71.4 billion a year ago) [Chart IV.13a]. More than 60 per cent of the FDI equity flows were directed towards manufacturing, electricity and other energy, computer services, financial services and, retail and wholesale trade. Singapore, Mauritius, the US, the Netherlands, Japan and the UAE contributed to more than 80 per cent of the flows. Net FDI declined to US$ 10.6 billion during 2023-24 from US$ 28.0 billion a year ago, mainly reflecting higher repatriation. 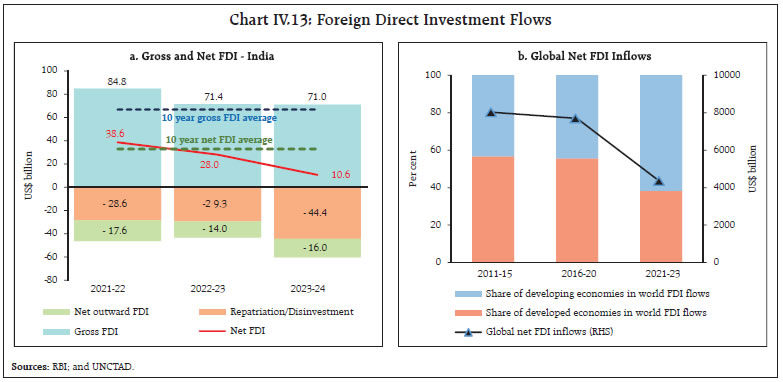 Global FDI flows have been impacted by higher borrowing costs, deepening geo-fragmentation and rising protectionism in recent years. Nonetheless, India is among the top 10 economies expected to experience high FDI momentum in 2024, as per fDi Intelligence22. Since the onset of the COVID-19 pandemic, there has been a structural change in global investment patterns, shifting FDI flows from developed economies towards developing economies (Chart IV.13b). have also risen to play a significant part as sources for global capital. The share of global FDI capital expenditure originating from G20-EMs in 2023 rose to 14.9 per cent as compared with 8.2 per cent in 2003.23 During 2023, Indian companies announced over 550 greenfield FDI projects abroad, the highest in any year before. In April 2024, foreign portfolio investors (FPIs) turned net sellers in Indian capital markets after two months amidst uncertain global cues over widening geopolitical tensions, rising commodity prices and surging US bond yields. Net FPI outflows were to the tune of US$ 2.7 billion in April 2024, with outflows recorded in both equity and debt segments (Chart IV.14a). Indian equities registered net outflows of US$ 1.1 billion in April 2024, in line with comparable emerging market peers (Chart IV.14b). Sector-wise, information technology (IT) and financial services registered the highest outflows, while telecommunications and power attracted the largest equity inflows during April 2024. Net FPI outflows in May 2024 (up to 14th) amounted to US$ 3.4 billion. Non-resident deposits registered higher accretions to the tune of US$ 14.7 billion during 2023-24 than US$ 9.0 billion a year ago, with net accretions to all accounts namely, Foreign Currency Non-Resident [FCNR(B)] accounts, Non-Resident (External) Rupee Accounts [NR(E)RA] and Non-Resident Ordinary (NRO) accounts (Chart IV.15).
During Q4:2023-24, external commercial borrowings (ECBs) registrations amounted to US$ 13.1 billion, 87 per cent higher than the previous quarter. With ECB inflows outpacing outflows, net inflows resumed after two quarters. Cumulatively during 2023-24, registrations (at US$ 49.2 billion), disbursements (at US$ 38.4 billion) as well as net inflows (at US$ 9.5 billion) under ECBs were substantially higher than the levels recorded in 2022- 23 (Chart IV.16). More than 70 per cent of ECBs raised during 2023-24 were effectively hedged in terms of explicit hedging, rupee denominated loans or loans from foreign parents, limiting the impact of external shocks (Chart IV.17).
Even though the end use of ECBs was broad based during 2023-24, funds raised for sourcing of capital goods, modernisation projects and development of infrastructure witnessed the largest increases. This augurs well for the overall capacity augmentation in the economy and is reflective of private sector investment demand (Chart IV.18). The overall cost of ECB loans increased during 2023-24, primarily due to elevated global benchmark interest rates (such as the secured overnight financing rate (SOFR)), reflecting higher global interest rates. The other component of the overall cost – the weighted average margin reflecting the risk premium – moderated to 159 bps during April – March 2024 from 172 bps a year ago and an average of 181 bps during 2021-22 (Chart IV.19).
India’s foreign exchange reserves increased by US$ 21.7 billion during the calendar year 2024 so far (as on May 10, 2024), the highest expansion among major foreign exchange reserves holding countries. Foreign exchange reserves at US$ 644.2 billion stood equivalent of more than 10 months of imports projected for 2024-25 and more than 99 per cent of total external debt outstanding at end-December 2023 (Chart IV.20). The Indian rupee (INR) depreciated by 0.5 per cent (m-o-m) vis-à-vis the US dollar in April 2024 as most EMEs registered pressures from strengthening of the US dollar amidst heightened geopolitical tensions and waning rate cut expectations. The INR remained one of the least volatile among major currencies during the month (Chart IV.21). In terms of the 40-currency real effective exchange rate (REER), the INR depreciated by 1.1 per cent (m-o-m) in April 2024 as negative relative price differentials more than offset the appreciation of the INR in nominal effective terms (Chart IV.22). Payment Systems Digital transactions continued to expand (y-o-y) in April 2024, primarily led by the retail segment, including the Unified Payments Interface (UPI), the National Automated Clearing House (NACH) and the Bharat Bill Payment System (BBPS) [Table IV.4]. Real Time Gross Settlement (RTGS) transactions showed accelerated growth (y-o-y) while the pace of growth of Immediate Payment Service (IMPS) and National Electronic Toll Collection (NETC) moderated in April 2024 in both volume and value terms. The growth in UPI transactions remained robust, reflecting increasing digital adoption across the country on the back of growing range of account types that UPI supports − including prepaid payment instruments (PPIs), wallets, savings accounts, overdraft accounts, RuPay credit card accounts and bank credit lines. To expand the adoption and usage of UPI, the Reserve Bank held a meeting24 with various stakeholders on May 8, 2024 covering issues pertaining to UPI infrastructure upscaling, challenges faced by the UPI ecosystem along with possible solutions and measures to incorporate potential users into the digital payments ecosystem. The BBPS documented the highest value and volume of transactions during April 2024, partly buoyed by the participation of non-bank payment aggregators (PAs) in the system as operating units from April 1, 2024. Furthermore, the NPCI Bharat BillPay Limited (NBBL), a wholly owned subsidiary of the NPCI in collaboration with the State Bank of India (SBI), onboarded the SBI National Common Mobility Card25 (NCMC) on its Bharat BillPay platform for the convenience of travellers. NPCI’s wholly owned subsidiary – NPCI International Payments Ltd. (NIPL) – signed an agreement26 with the Bank of Namibia (BoN) to support them in developing an instant payment system like UPI. This initiative aims to strengthen Namibia’s financial infrastructure and foster inclusive economic growth. Additionally, India and Ghana have committed to working swiftly to operationalise UPI on Ghana’s Interbank Payment and Settlement Systems (GHIPSS) in less than six months.27 In its resolve towards customer centricity and ensuring transparency in the credit intermediation process, the Reserve Bank issued a draft circular on the regulatory framework for aggregation of loan products by lending service providers (LSPs) – ‘Digital Lending: Transparency in Aggregation of Loan Products from Multiple Lenders’28 – inviting comments and feedback from various stakeholders. Additionally, a set of guidelines in the form of frequently asked questions (FAQs)29 on Default Loss Guarantee in Digital Lending were issued by the Reserve Bank. 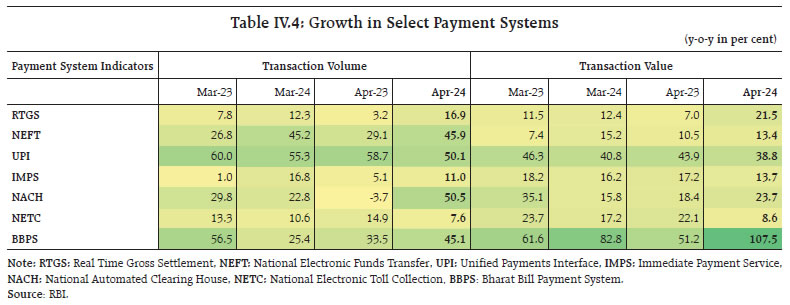 Conclusion In this milieu, recent developments in the global economy sharpen the dilemma for monetary policy authorities. In the face of lack of progress in bringing down inflation to its target, high interest rates “may need more time to do their job”.30 Confidence is low on an inertial easing of the momentum of inflation, given that it has stalled in spite of past aggressive tightening. Moreover, structural changes in the form of rising immigration to advanced economies, the muscular use of industrial policy, fiscal laxity and rewiring of supply chains as globalisation fragments are whole new dimensions to the conduct of monetary policy. Increasingly, national security and resilience are prioritised ahead of efficiency and cost effectiveness. The IMF has reported no less than 2500 industrial policy actions worldwide in 2023, of which more than two-thirds were trade distorting as they discriminated against foreign commercial interests.31 Clearly, the monetary policy dilemma calls for strategic signalling rather than a cacophony of communication. Yet, sustaining a restrictive stance might be rendered difficult by economic activity and consumer sentiment slowing, with fewer jobs being added than a month or two ago – price pressures have acutely affected “the fundamentals of life”32. Hence, rate increases to squelch the uptick in inflation are regarded as unlikely. Although hopes that the economy is on a glidepath to a soft landing are now more tempered than before, monetary policy authorities are reluctant to give up on a Goldilocks scenario that avoids a crash landing. Fearing the folly of haste, they will likely want to stay patient and high for longer than current forecasts. Markets draw hope from expectations of an eventual slowing in housing, insurance and medical costs causing a faster core disinflation. Inflation developments will likely not derail the rate cutting cycle, only delay it. Policy divergence may once again rent both sides of the Atlantic apart. As the start of monetary policy easing moves out into the horizon, emerging market central banks face the pressure of weakening currencies, pass-through to prices of imported goods and services and higher inflation. Accordingly, surprise rate increases, coordinated communication and foreign exchange market interventions are being resorted to when monetary policy tightness is increasingly viewed as hobbling the pace of economic recovery. Higher borrowing costs are curbing domestic demand and posing a threat in countries with high levels of household debt. Sharp drops in the yen, yuan and won have complicated the outlook even further, prompting both verbal and forex sale defences including to protect the acceleration of exports in the past three months. Increasingly, market expectations converge to the view that these central banks will not cut rates ahead of the US Fed in spite of high real interest rates. They state that they will not be ‘Fed-dependent’, but they will face practical limits on how far they can diverge from the Fed. Consequently, the rate easing cycle may turn out to be shallower than initially anticipated. Meanwhile, the heightened global uncertainty is sending emerging market central banks on a spree of gold buying, adding 290 tonnes in the first quarter of 2024 and accounting for a quarter of overall global gold demand. Amidst geopolitical developments and a slowing global economy, these central banks are signalling that living in challenging times calls for strategic diversification.
|