by Srijashree Sardar, Dipak R. Chaudhari and Sangeeta Das^ Decentralised finance (DeFi) seeks to disintermediate the traditional financial system. However, developments such as the FTX crypto exchange collapse, decline in Binance and episodes of instability in stablecoins have created trust deficit in the entire crypto system. Against this backdrop, the article assesses DeFi and its interlinkages with the traditional financial system. Our empirical analysis indicates that DeFi returns, and its volatility are mainly driven by speculative motive. Introduction The current monetary system has evolved through years of experience wherein the monetary and sovereign authorities are responsible for the management of currency issuance, overseeing and development of the payment systems and instilling trust in its citizens. However, post GFC and particularly in the aftermath of the COVID pandemic, a new class – cryptocurrency – emerged which posed challenges to the traditional monetary system. Although the crypto promoters drive on the decentralised ‘notion’, the concentration of power has been seen with the “whales” – persons or entities that hold a large amount of cryptocurrency, enough so that their transactions alone can affect the currency’s market. Cryptocurrency value is prone to huge gyrations. Luna, a stablecoin whose value is supposed to be pegged to the US$ fell to near zero in just few days during May 2022. Bitcoin, the major cryptocurrency, saw its value plummeting from US$ 67,550 on November 9, 2021 to US$ 19,010 on June 19, 2022 within a span of six months and crypto lender Voyager, which had more than one lakh creditors and asset value in the range of US$ 1 billion to US$ 10 billion filed for bankruptcy. The FTX crypto exchange collapse on November 11, 2022 and rapid decline in Binance, the world’s largest crypto exchange in the first quarter of 2023 spooked the entire cryptocurrency ecosystem. These developments pose regulatory challenges to authorities and policymakers due to their vulnerability and linkages with the traditional financial system. The recent fast paced increase in technology driven finance companies has led to a manifold expansion of the virtual mode in the financial system. According to the latest Bank for International Settlements Survey (CPMI, 2023) , digital payments logged record growth in 2021, and emerging economies are ahead of advanced economies in the digital payment adoption. Traditional finance met the first challenger in the form of Bitcoin in 2008, which effectively was the first usage of the blockchain technology for cryptocurrency. Thereafter, the cryptocurrency network has increased to over 10,000 cryptocurrencies globally with market capitalisation value of US$2.5 trillion, excluding stablecoins in November 2021 (Azar et al., 2022). The crypto market size was US$ 1.2 trillion on April 30, 2023 (Coinmarketcap, 2023). Apart from cryptocurrencies such as Bitcoin, Ethereum, Litecoin and Ripple, stablecoins and non-fungible tokens (NFT) are part of the blockchain ecosystem. Various claims are made on the valuation of the crypto market. According to the Financial Stability Board (2022), the crypto assets markets comprise 1 per cent of the total global financial assets. Although the number is not very large, considering its rapid expansion, it could impact traditional finance going forward. In that, the recent resurgence of decentralised finance (DeFi) provides a major challenge to the regulators worldwide. Defi refers to crypto assets where all financial transactions are performed on a computer network without any central intermediary. DeFi ecosystem consists of protocols, applications, smart contracts and total value locked (TVL). Ethereum is one of the main blockchain networks on which DeFi protocols and applications (dApps) are built. The other major DeFi blockchains are Binance smart chain (BSC), Solana, Polkadot, Avalanche, Ripple and Cronos. Although it is claimed that DeFi can complement the traditional financial activities in the form of faster fund transfers and innovation, the associated risks far outweigh the purported benefits. Most of the instruments are speculative in nature and offer arbitrage across multiple crypto assets. Higher exposure to the liquidity and market risk may lead to investor runs (BIS, 2020). Furthermore, recent episodes of crypto exchange malpractices and the declining trust in stablecoins could impact investors’ confidence and adversely impact the exposed entities in the financial system. Research in this area is limited due to several reasons – to begin with the difficulty in estimating and understanding the crypto asset price, its underlying and relationship with other asset classes. In addition, an assessment of cryptocurrencies’ exposure and interlinkages with the traditional finances in terms of quantity is mostly survey based, wherein methods, sample size and selection differ. Lastly, the regulatory and accounting framework on the crypto assets is still in the nascent stage, resulting in a credibility issue on the existing private datasets. On January 11, 2024, US securities regulator allowed bitcoin exchange traded funds with cautionary advice to investors to be careful with the risks it poses. Against this background, this article explores the crypto ecosystem, its main features vis-à-vis traditional finances, particularly the DeFi, and its interlinkages with the financial systems. The rest of the article is divided into five sections. Section 2 provides stylised facts related to the crypto ecosystem; Section 3 analyses its linkages with the traditional financial system. Section 4 discusses the data and methodology for empirical analysis while Section 5 lays out the results with concluding remarks in Section 6. II. Stylised Facts There is a frenetic race for innovation in fintech and start-up space. As a result, we are exposed to completely new and ever evolving innovative instruments. As per the IMF’s Global Financial Stability Report (GFSR) April 2022, technology driven segment has been growing much faster than traditional way of businesses (Chart 1). In the volatile crypto environment, stablecoins which are pegged to a numeraire like fiat currency or gold have also been marked by volatility and collapses. Stablecoins aim to maintain a fixed face value against fiat currencies, mainly the US dollar. They are supposed to provide a tool to the investors and traders to retain the value of the digital assets without leaving the crypto ecosystem. However, all stablecoins are not backed by fiat currency or any commodity such as a gold; they are constructed through complex algorithm based smart contracts such as Terra US$. The algorithmically backed stablecoins are designed to maintain price stability by adjusting the supply of tokens to match demand, thereby affecting the quantity of tokens held by any given user while maintaining its value/market share. 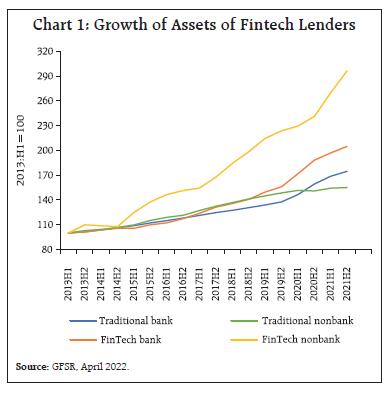 Though majority of DeFi protocols and dApps are built on Ethereum blockchain, the DeFi market capitalisation consists of multiple protocols and independent cryptos such as Uniswap, Aave etc. To understand the size of the market, the TVL, which refers to the total value of cryptos that are locked/ staked, is calculated by adding up the total value of digital assets locked on a specific DeFi platform or dApp. These assets can include cryptocurrencies, stablecoins, or other tokens that are being used as collateral for loans or provide the platform with liquidity. TVL and top-ten contributing protocols are given in Table 1. Volume and price dynamics of Ethereum (ETH), the prominent representative of the DeFi, on which the majority of DeFi protocols and applications are built on, is shown in Chart 2. Technical analysts and traders expect that price changes are positively correlated with volume. But in the case of cryptocurrency, due to its inherent volatility and unpredictability, this trend does not hold. In the overall cryptocurrency market, Bitcoin had dominant share of 87 per cent in Q4:2016. However, during the pandemic many cryptocurrencies emerged and the share of Bitcoin declined to 38 per cent in Q3:2022 (Statista, 2024). Ether from Ethereum platform gained a huge chunk of market share at the expense of Bitcoin. Another important metric to watch out is the underlying of the cryptos as in most cases, it is another cryptocurrency or algorithm (Table 2). | Table 1: Total Value Locked as on May 7, 2024 | | Rank | Protocol | US$ billion | | 1 | EigenLayer | 15.34 | | 2 | AAVE V3 | 8.65 | | 3 | JustLend | 6.26 | | 4 | MakerDAO | 5.67 | | 5 | Uniswap V3 | 3.28 | | 6 | Zircuit Staking | 3.27 | | 7 | Spark | 2.39 | | 8 | Uniswap V2 | 2.25 | | 9 | Curve DEX | 1.91 | | 10 | AAVE V2 | 1.85 | | | Others | 42.56 | | | Total | 93.43 | | Source: Defillama. |
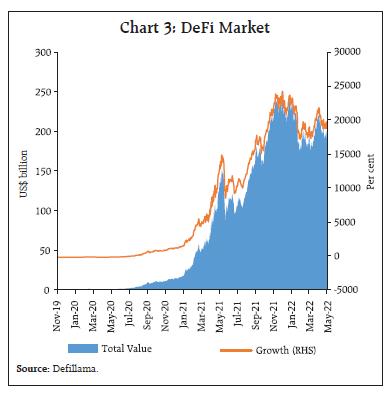
Recent growth of DeFi can be attributed to several factors, including the rise of dApps and the availability of decentralized exchanges (DEXs). In DeFi protocols, lending experienced rapid growth, going from zero to more than $50 billion in TVL in less than two years (Cornelli et al.,2024). Although, the DeFi market continues to evolve, it declined from its peak during Covid period in 2021 (Chart 3). | Table 2: Underlying of Cryptocurrencies | | Underlying | Crypto | | Pegged to fiat currency | Stablecoins such as Tether, Binance USD and USD Coin | | Pegged to metal | Pax Gold and Kinesis Gold pegged to gold | | Algorithm based stablecoins pegged to dollar (keep its value by adjusting supply of another underlying digital asset) | Terra USD | | Cryptocurrency linked to another cryptocurrency | Luna (linked to Terra) | | Source: Authors’ compilation. |
 DeFi differs from the traditional finances in that it removes all the layers of intermediaries, thereby doing away with the high costs associated with the legacy system and these benefits are transferred to the end-user (Harvey et al., 2021). DeFi provides financial services without centralised intermediaries, by operating through automated protocols on blockchains. The DeFi ecosystem revolves around two elements: (i) novel protocols for trading, lending, and investing; and (ii) stablecoins, which are crypto assets that facilitate fund transfers and aim to maintain a fixed face value vis-à-vis fiat currencies, mainly the US dollar. The key difference between DeFi and other distributed ledger technology (DLT) based centralised cryptos (CeFi) lies in whether the financial service is automated via smart contracts on a blockchain or is provided by centralised intermediaries. While DeFi records all the contractual and transaction details on the blockchain (i.e., on-chain), CeFi (Centralised Finance) relies on the private records of intermediaries, such as centralised exchanges and other platforms (i.e., off-chain). DeFi aims to provide financial services without using centralised entities. It also provides users with much greater anonymity than transactions in CeFi or traditional finance (Aramonte et al., 2021). Chart 4 represents the flowchart of work algorithm for Traditional Finance and DeFi while Table 3 provides synoptic view on differences between the DeFi and traditional finances. The DeFi space remains heavily reliant on the Ethereum blockchain (which has struggled to scale up to onboard mass users). However, once Ethereum transitions to ETH 2.0 using the ‘Proof of Stake’1 consensus mechanism, the number of users it can onboard be potentially without limitation. Moreover, other contenders are further building out the space, such as Compound, and Maker DAO, propelling DeFi to more and more users. DeFi is built on blockchain technology, and all transactions are run by smart contracts, which are basically programs, or pieces of code, stored on the blockchain and are only enacted when certain preconditions are met. The DeFi market is dominated by decentralised exchanges and lending applications (Chart 5). 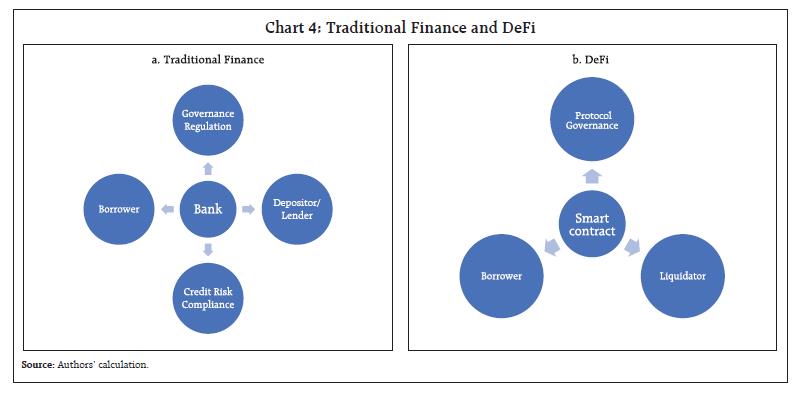
| Table 3: Financial System - Crypto based versus Traditional | | | Crypto based Financial System | Traditional Financial Services | | Decentralised Finance (DeFi) | Centralised Finance (CeFi) | | Access | World Wide Web; permissionless and anonymised | Crypto centralised exchanges (Binance, Coinbase) | Branch office; compulsory KYC and anti-money laundering | | Operation | Automated by smart contract | As per rules and regulations imposed by regulatory bodies | Mostly manual | | Instruments | Crypto assets, including stablecoins | Fiat-currency | | Record-keeping | Distributed ledger (verified by multiple network participants) (i.e., on-chain) | With centralised exchanges; No public verifiability (less transparent) (i.e., off-chain) | Centralised ledger (verified by a single trustworthy entity that operates the platform) | | Decision-making | Voting by users who own governing stakes; more transparent as the codes can be shared and verified by public. | Done by centralised intermediaries | Governed by Top Management (such as the Bank executive board) | | Risk-taking | Distributed to users | Implicit on central counterparty | Concentrated in a single trustworthy entity (Bank) | | Source: GFSR, April 2022; and BIS Quarterly Review, December 2021. | DeFi claims to offer higher efficiency and investment opportunities as it has the potential to exhibit cost-efficient financial intermediation. However, comparing costs and prices between DeFi and traditional financial institutions is complex, as the two operate in different ecosystems. DeFi poses market, liquidity, and cyber risks against a backdrop of legal uncertainties. A fall in any of the crypto assets such as stablecoin or cryptocurrency has ripple effects on the other assets such as NFTs, Metaverse tokens etc. Therefore, regulatory authorities are taking various steps to restrain crypto investment such as ban in China. On March 10, 2022, US Department of Labour released a press note cautioning pension funds to avoid investing in crypto related assets and planned an investigation in the existing investment done in the cryptos. In India, cryptos are subject to tax liability of 1 per cent tax deducted at source (TDS) and 30 per cent capital gains tax along with applicability of anti-money laundering law and advertising standards. 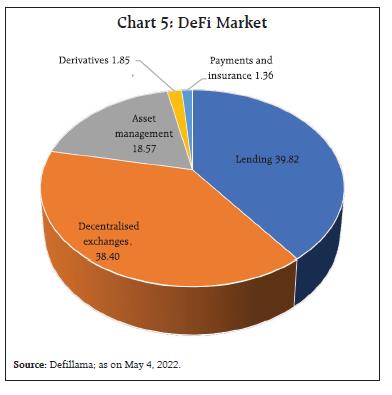 III. Crypto Linkages and Risk to Traditional Financial System Crypto linkages with the existing financial system are in the form of banking and financial sector exposure, and liquidity exposure. The biggest risk of the cryptos to traditional finance is price volatility. If we compare the returns on the various asset classes, the returns on the DeFi are the most volatile (Chart 6). Furthermore, there is a close correlation between Ethereum market capitalisation and market volatility (Chart 7). The market cap has exponentially increased post Covid period and moved in line with the volatility in the market, which indicates that the speculative motive could be the basis for the ETH expansion. Traditional financial system could be exposed to the crypto assets through multiple channels. To begin with, the deposit channel: banks hold deposits from the companies offering various crypto assets such as stablecoins and NFT. As per the Basel III Monitoring Report (September 2022), based on a survey finding, banks’ exposure to crypto assets was 0.14 per cent of the claims on the reporting banks which include deposits liabilities and assets including off balance sheet items. The exposure is in the form of crypto holding and lending to investors, corporations or financial institutions including crypto exchanges, etc. In addition, banks are involved in clearing crypto asset derivatives and futures, undertaking initial coin offerings, and issuing securities with crypto assets. Furthermore, banks are involved in insurance and other services such as custody and wallets. 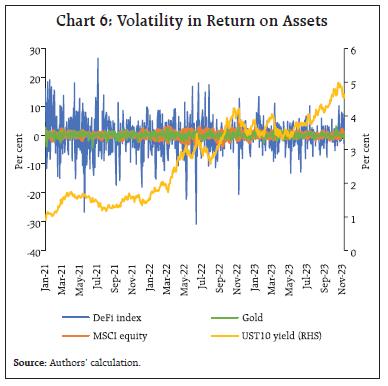 Due to the borderless feature of crypto assets, spillover by liquidity linkages across countries is considered as a major threat from the crypto ecosystem. Sudden valuation losses experienced in the various crypto assets also pose a major challenge for policymakers. In this scenario, small banks could be more susceptible. According to Bank for International Settlements (BIS, 2022) the smart contract employed by DeFi uses liquidity pools to transfer digital assets without any human intervention, as opposed to the traditional financial system where the orders are placed by matching buyers and sellers and seek consent for each transaction. In this manner, the DeFi environment poses a potential challenge to the existing financial structure. Central banks need to understand their impact on existing payments, transactions, and inter-linkages with other financial institutions and for the overall financial stability. The linkages between crypto and traditional financial systems are shown in Table 4. 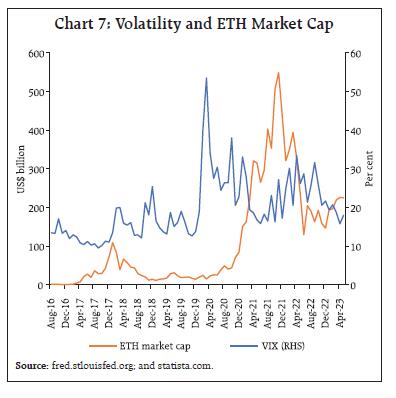
| Table 4: Linkages between Crypto and Traditional Financial Systems | | Cryptoasset Markets | Interlinkages | Traditional Financial System | | Underlying Assets | Investors may have been exposed to both sets of assets leading to contagion. | Underlying Assets | Backed and mostly unbacked crypto assets
Stablecoins backed by assets | Predominantly real economy assets | | Activities | Investors can borrow in one system and invest proceeds in other. | Activities | Trading
Lending | Trading
Lending | Asset Management
Payments
Insurance | Activity could migrate from traditional system to cryptoassets markets and vice versa. | Asset Management
Payments
Insurance | | Key Services Provider | Traditional providers may move into cryptoassets markets and vice versa. | Key Services Provider | Decentralised Finance
Unregulated centralised exchanges
Cryptoasset operators
Wallet providers | Banks
Insurers
Financial Market Infrastructure
Asset managers and investment firms | | Source: CoinMarketCap; Financial Stability Board; and authors’ compilation. | The borderless crypto ecosystem has the potential to spread to any country in the world with minimum IT infrastructure requirement. The volatility in terms of coefficient of variation in DeFi return is higher at 5.7 than 1.9 in the VIX returns, which suggests the motive of investing in DeFi as a speculative investment (a “gamble”) rather than a means of payment for real economic transactions (Auer et. al., 2022). The episodes of price volatility in the cryptos have so far been contained in a limited manner. But considering that most of the crypto related activity is mainly carried out of existing regulatory purview, it is difficult to gauge its impact. Furthermore, many crypto trading platforms such as Coinbase are listed on the stock exchanges and hedge funds are also actively involved in allocating more funds to crypto related assets (FSB, 2022). Most of the financial institutions have direct exposure to the crypto system, although the overall exposure to the total asset under management is estimated to be low (Table 5). According to Blockdata, 55 per cent of the biggest global institutions by assets are directly exposed to crypto assets or blockchain and some of these are systemically important global banks. The financial risk may increase if the exposure continues to grow. Accordingly, policies targeting fintech and traditional financial firms proportionally are the need of the hour (GFSR, April 2022). | Table 5: Exposure to Crypto and Blockchain by Major Financial Institutions | | Sr. No. | Financial Institution | Asset under Management | Funding exposure to Crypto and Blockchain | No of Investments | | (US$ billion) | (US$ million) | | | 1. | Standard Chartered | 879 | 380 | 6 | | 2. | BNY Mellon | 470 | 321 | 5 | | 3. | Citi bank | 2260 | 279 | 14 | | 4. | UBS | 1126 | 266 | 5 | | 5. | BNP Paribas | 3081 | 236 | 9 | | 6. | Morgan Stanley | 1116 | 234 | 3 | | 7. | JP Morgan Chase & Co. | 3386 | 206 | 8 | | 8. | Goldman Sachs | 1163 | 204 | 8 | | 9. | Barclays | 1842 | 196 | 22 | | 10. | MUFG, Japan | 3408 | 185 | 6 | | 11. | ING | 1147 | 170 | 6 | | 12. | BBVA, Spain | 796 | 167 | 5 | | 13. | Nomura | 432 | 146 | 5 | Note: Data is as of August 2021.
Source: Blockdata (https://www.blockdata.tech/blog/general/banks- investing-blockchain-companies). | IV. Data and Methodology DeFi claims to substitute the traditional financial system in a decentralised, open, unregulated and autonomous way, through applications mainly based on the Ethereum blockchain network. In this context, this study primarily focuses on the volatility factors of DeFi returns along with traditional asset classes returns. The Financial Stability Board (FSB) notes that the application of DeFi technology may reduce the financial instability risks associated with traditional financial institutions (FSB, 2022). Furthermore, Carter and Jeng (2021) explore whether DeFi’s promise of interoperability could help promote innovation and build a vibrant financial ecosystem. Since the nexus of financial crises, volatility factor and the resulting systemic risk has been the continuous concern in the past, this study explores if and how strongly these features are prevalent in the rapidly expanding DeFi universe. The objective of this paper is to analyse the volatility of returns in DeFi market and its relationship with different segments of the traditional financial market. Investment activities in the crypto market are strongly positively correlated with the bitcoin returns (Aiello et. al., 2023). Therefore, the choice of proxy variables is an important issue that needs to be taken into consideration. Keeping in view the fact that most of the investment in the global financial market is usually diversified in nature, we limit our choice to the selection of appropriate indices, rather than considering individual assets in a particular asset class. We consider five different asset classes and volatility indices - cryptocurrency market (Bloomberg Galaxy Crypto Index2), equity market (MSCI World Index), expectations in stock market (CBOE VIX), treasury bond market (MOVE Index) and exchange rate market (DXY Index) - to evaluate the effectiveness of decentralised finance (Bloomberg Galaxy DEFI Index3). The VIX index is computed from a panel of options prices and is a ‘risk-neutral’ implied volatility measure of the stock market. Similarly, MOVE index measures expected short term volatility in the US bond market. The indices referred for investors’ sentiments are a gauge of perceived volatility in equity and bond markets, in both directions. It is expected that the DeFi returns volatility would be positively related with the volatility indices. Gold and bank fixed deposits have been dropped considering their safe haven and risk-free status respectively. The data set spans a time period of over two and half years of daily frequency, as the DEFI index is available only from December 31, 2020. For this purpose, we obtain daily closing prices of all the indices from Bloomberg, and calculate the log return of indices by taking the natural log difference observations of two comparable periods by using the following formula: Where i represents each asset class, lnSt is today’s index value and lnSt–1 is previous day’s index value, “ln” indicates log form. The results of some descriptive statistics about the variables and their relation (in tabular and graphical form) are given in the annex (Table 1A, 2A and Chart 1.1). The test results for the breakpoint unit root test are reported in annex Table 3A. The motive for applying the breakpoint unit root test rather than the traditional Augmented Dickey Fuller (ADF) test for unit root is that the breakpoint unit root test can address the problem of structural breaks in the series. The test indicates that all the variables are stationary at level using both constant and trend. The impact of spillovers in returns of the six asset classes proxies, i.e., decentralised finance (DEFI Index), the Bloomberg Global Crypto Index (BGCI), Global Equity (MSCI World Index), volatility sentiments in stock market (CBOE VIX) and bond market (MOVE Index), exchange rate market (DXY Index) have been used. Here, one dummy variable FTX has been considered (the value ‘1’ from November 11, 2022 onwards; otherwise ‘0’) for the market downturn due to the downfall of largest global cryptocurrency exchanges, viz., FTX. FTX’s bankruptcy, and its spat with Binance, not only triggered a huge sell-off in the market but also reduced liquidity from the crypto market. An Exponential General Autoregressive Conditional Heteroskedastic (EGARCH) model has been used to capture asymmetry and leverage with appropriate restrictions imposed on the model’s parameters. Generally, asymmetry arises when the positive and negative shocks of the same indicator have an unequal impact on volatility returns. On the other hand, leverage is a special case of asymmetry and is related to increased volatility due to negative shocks to returns and a decline in volatility due to positive shocks to returns (McAleer and Hafner, 2014). As per the EGARCH (1, 1) framework proposed by Nelson (1991), we estimate the following DEFI Index volatility equation for the study: The above equation is a mean equation. It indicates that average return on the DEFI index at time ‘t’ (DeFit) is dependent on its own lag, overall cryptocurrency index (BGCI), exchange rate DXY Index, MSCI World Index, CBOE volatility Index (VIX), Treasury market MOVE Index, FTX dummy and the error term (εt). Further, the εt is dependent on some lagged information (Ω–1) and is assumed to be normally distributed with zero mean and its variance (ht). Here, the variance equation for EGARCH model can be written as: This model differs from the GARCH variance structure because of the log of the conditional variance. This implies that the leverage effect is exponential, rather than quadratic and the forecast of conditional variances would definitely be non-negative. The presence of leverage effect can be tested by α2< 0. The impact is asymmetry if α2 ≠ 0. V. Results The following estimation result indicates the significance of all five asset classes and FTX dummy on DeFi returns (Table 6). The EGARCH estimation result indicates that all variables except DXY and VIX have statistically significant coefficients in the mean equation while all the three coefficients of ARCH, GARCH and leverage effects as well as the coefficients of our study variables except BGCI are significant in the variance equation. In the mean equation, BGCI (cryptocurrency market) has positive and significant association with DeFi in the mean equation reflecting the greater integration between these two markets but has no significant impact in the variance equation. The DXY and VIX coefficients are not significant in the mean equation but have positive influence on DeFi market in the variance equation which can be seen as evidence of increasing volatility in DeFi with respect to the volatility of foreign exchange market and stock market. The coefficients of MSCI World Index returns are positive and significant in both the mean and variance equations, which illustrates that global equity market has significant co-movement with decentralised finance. Likewise, as for the liquidity purpose, MOVE index (US treasury market) volatility is positively correlated with DeFi market volatility in the variance equation. Further, the FTX dummy is highly significant on the DeFi returns and negative shock since the entire cryptocurrency market has turned red hot and traditional finance became stronger. | Table 6: EGARCH (1,1) Estimation Results | | Variable | Coefficient | Std. Error | z-Statistic | Probability | | Dependent variable: DeFi | | Mean Equation | | DeFi (-1) | -0.045*** | 0.015 | -2.939 | 0.003 | | BGCI | 1.110*** | 0.019 | 59.272 | 0.000 | | DXY | 0.279 | 0.184 | 1.513 | 0.130 | | VIX | 0.009 | 0.019 | 0.465 | 0.642 | | MSCI Equity | 0.270* | 0.144 | 1.870 | 0.062 | | MOVE Index | -0.030* | 0.017 | -1.729 | 0.084 | | FTX | -0.275** | 0.116 | -2.375 | 0.018 | | Variance Equation | | C | 1.741*** | 0.193 | 9.041 | 0.000 | | ARCH{1} | 0.406*** | 0.072 | 5.679 | 0.000 | | LEVERAGE {1} | 0.103** | 0.047 | 2.187 | 0.029 | | GARCH{1} | 0.130* | 0.077 | 1.690 | 0.091 | | BGCI | 0.009 | 0.009 | 0.941 | 0.347 | | DXY | 0.353*** | 0.119 | 2.955 | 0.003 | | VIX | 0.054*** | 0.010 | 5.645 | 0.000 | | MSCI_Equity | 0.607*** | 0.082 | 7.408 | 0.000 | | MOVE_Index | 0.051*** | 0.010 | 4.848 | 0.000 | | Residual Diagnostics | | Akaike info criterion | -4.825 | Adjusted R-squared | 0.709 | | Durbin-Watson stat | 1.86 | Log-likelihood | -1715 | | Q2 (36) | 26.35 (0.88) | ARCH-LM | 0.107 (0.744) | | Note: ***, **, and * indicate significance level at 1 per cent, 5 per cent and 10 per cent, respectively. | In the variance equation, GARCH and ARCH coefficients are positive as expected, but the leverage coefficient is also positive, contrary to a priori expectations. Negative leverage indicates that high negative returns are followed by higher volatility than the positive ones, that is, the large unanticipated downward shocks increase the variance. However, it does not have to be the case in each market and in all times (Black 1976; Figlewski and Wang, 2000; Herbert et al., 2019). Since we are covering the crisis period (COVID), there may be some anomalies for which the leverage coefficient is positive but highly significant. This implies the downward movement of DeFi returns is followed by higher volatility than upward movement of the same magnitude. Conditional Variance: The graph below depicts GARCH conditional volatility of Bloomberg Galaxy DeFi Index return. The volatility in the conditional variance graph depicts a declining trend as we move from the initial phase of the pandemic towards the post pandemic period i.e., from 2020 to 2022, but again increased in the period of Fed’s monetary policy rate hikes and FTX contagion (Chart 8). VI. Conclusion Distributed Ledger Technology and smart contracts promise innovation in the form of DeFi, which could lower transaction cost and improve accessibility. However, purely technological aspects have limitations and in financial facets they do not match with the vision and framework of traditional finance. So far, the experience shows that the vulnerabilities of DeFi outweigh the benefits advocated for DeFi. From the empirical analysis, we observed that DeFi price volatility and volatility in the financial market asset classes are positively correlated. Our findings suggest that the interest in cryptocurrencies is driven by speculative motive rather than a means of payment for real economic transactions. The findings are in accordance with a survey by UK FCA that majority of investors (38 per cent) investing in cryptoassets taking it as a ‘gamble to make or lose money’ indicating the risk seeking behaviour (FCA, 2021). As the crypto ecosystem lacks accountability and stability and is marked by regulatory ambiguity, retail investors need to be more cautious. Some cryptos may be backed by underlying; however, if the underlying itself is another unstable digital asset with no transparency and central bank back up, the crypto system is prone to crisis without safeguards. “The term cryptocurrency, private cryptocurrency is a fashionable way of describing what is otherwise 100 per cent speculative activity” (Das, 2023). The borderless, volatile DeFi needs global regulation; however, to regulate first there should be clarity of the risky asset (IMF, 2023). The recent collapse of FTX and Binance exposed the limitations of the country specific rules/bans and grave risks they entail. As DeFi continues to evolve and mature, and its interaction with the traditional financial system grows, its utility against risks demands further analysis. References: Aiello, D., Baker, S. R., Balyuk, T., Di Maggio, M., Johnson, M. J., & Kotter, J. D. (2023). Who Invests in Crypto? Wealth, Financial Constraints, and Risk Attitudes (No. w31856). National Bureau of Economic Research. Aramonte, S., Huang, W., & Schrimpf, A. (2021). DeFi Risks and the Decentralisation Illusion. BIS Quarterly Review, 21. Arslanian, H. (2022). Decentralised Finance (DeFi). The Book of Crypto: The Complete Guide to Understanding Bitcoin, Cryptocurrencies and Digital Assets (pp. 291-313). Cham: Springer International Publishing. Auer, R., Cornelli, G., Doerr, S., Frost, J., & Gambacorta, L. (2022). Crypto Trading and Bitcoin Prices: Evidence from a New Database of Retail Adoption (No. 1049). Bank for International Settlements. Azar, P. D., Baughman, G., Carapella, F., Gerszten, J., Lubis, A., Perez-Sangimino, J. P., ... & Rappoport W, D. E. (2022). The Financial Stability Implications of Digital Assets. FRB of New York Staff Report, (1034). BIS. (2022). Annual Economic Report 2022. https://www.bis.org/publ/arpdf/ar2022e.htm Black F. (1976). Studies of Stock Price Volatility Changes. Proceedings of the 1976 Meeting of the Business and Economic Statistics Section, 177-181. Carter, N., & Jeng, L. (2021). DeFi protocol risks: The paradox of DeFi. Regtech, suptech and beyond: innovation and technology in financial services” riskbooks–forthcoming Q, 3. Coinmarketcap, (2023). https://coinmarketcap.com/ Cornelli, G., Gambacorta, L., Garratt, R., & Reghezza, A. (2024). Why DeFi lending? Evidence from Aave V2 (No. 1183). Bank for International Settlements. Das, S. (2023). “G20 for a Better Global Economic Order during India’s Presidency” speech delivered at 17th K P Hormis Commemorative Lecture https://www.rbi.org.in/Scripts/BS_SpeechesView.aspx?Id=1356 Defillama, https://defillama.com/, 2022. FCA (2021). Research Note: Cryptoasset consumer research. https://www.fca.org.uk/publications/research/research-note-cryptoasset-consumer-research-2021. Figlewski, Stephen & Wang, Xiaozu (2000). Is the ‘Leverage Effect’ a Leverage Effect? SSRN 256109 https://ssrn.com/abstract=256109. Financial Stability Board (2022). Assessment of Risks to Financial Stability from Crypto-assets. https://www.fsb.org/wp-content/uploads/P160222.Pdf. Global Financial Stability Report, April 2022: Shockwaves from the War in Ukraine Test the Financial System’s Resilience. (2022). https://www.imf.org/en/Publications/GFSR/Issues/2022/04/19/global-financial-stability-report-april-2022 Harvey, Campbell R., Ashwin Ramachandran, & Joey Santoro. (2021). DeFi and the Future of Finance. John Wiley & Sons. Herbert, W. E., Ugwuanyi, G. O., & Nwaocha, E. I. (2019). Volatility Clustering, Leverage Effects and Risk-Return Trade-Off in the Nigerian Stock Market. Journal of Finance and Economics. 2019, 7(1), 1-13. IMF (2023). https://www.imf.org/en/News/Podcasts/All-Podcasts/2023/11/09/shaktikanta-das-gov-talks McAleer, M., & Hafner, C. M. (2014). A one-line derivation of EGARCH. Econometrics, 2(2), 92-97. Nelson, D. B. (1991). Conditional Heteroscedasticity in Asset Returns: A New Approach, Econometrica: Journal of the Econometric Society, 59(2), 347-370. Statista. (2024). https://www.statista.com/statistics/730782/cryptocurrencies-market-capitalization/
Annex | Table 1A: Descriptive Statistics of Variables | | | DEFI_INDEX | BGCI | DXY | VIX | MSCI_EQUITY | MOVE_INDEX | | Mean | -0.05 | 0.05 | 0.02 | -0.05 | 0.01 | 0.15 | | Median | -0.02 | 0.08 | 0.03 | -0.93 | 0.03 | 0.13 | | Maximum | 26.63 | 19.83 | 1.64 | 48.02 | 4.93 | 21.46 | | Minimum | -30.85 | -25.78 | -2.14 | -22.04 | -3.73 | -18.45 | | Std. Dev. | 5.95 | 4.53 | 0.46 | 7.36 | 0.98 | 5.03 | | Skewness | -0.28 | -0.59 | -0.34 | 1.01 | -0.06 | 0.33 | | Kurtosis | 6.00 | 6.61 | 4.42 | 7.50 | 4.61 | 4.65 | | Jarque-Bera | 279.31 | 431.79 | 73.85 | 730.66 | 78.37 | 94.15 | | Probability | 0.00 | 0.00 | 0.00 | 0.00 | 0.00 | 0.00 |
| Table 2A: Correlation Analysis | | | DEFI | BGCI | DXY | VIX | MSCI-Equity | MOVE | | DEFI | 1 | | | | | | | | - | | | | | | | BGCI | 0.84 | 1 | | | | | | | (0.00) | - | | | | | | DXY | -0.20 | -0.23 | 1 | | | | | | (0.00) | (0.00) | - | | | | | VIX | -0.27 | -0.30 | 0.24 | 1 | | | | | (0.00) | (0.00) | (0.00) | - | | | | MSCI-Equity | 0.38 | 0.41 | -0.49 | -0.70 | 1 | | | | (0.00) | (0.00) | (0.00) | (0.00) | - | | | MOVE | -0.15 | -0.11 | 0.29 | 0.37 | -0.32 | 1 | | | (0.00) | (0.00) | (0.00) | (0.00) | (0.00) | - | | Note: Figures in parentheses indicate probability value at 5 per cent significance level. | | Table 3A: Unit Root Test - ADF Breakpoint Test with Trend and Intercept | | Variable | t-statistic | Probability | | DeFi | -29.411* | 0.000 | | BGCI | -24.843* | 0.000 | | MSCI Equity | -22.082* | 0.001 | | VIX | -26.902* | 0.002 | | MOVE Index | -24.106* | 0.004 | | DXY | -21.023* | 0.000 | | Note: * indicates significance level at 1 per cent. |
| Table 4A: Multicollinearity Test - Variance Inflation Factors (VIF) | | Variable | Coefficient of Variation | VIF | | DeFi | 0.000 | 1.33 | | BGCI | 0.000 | 1.41 | | DXY | 0.034 | 1.47 | | VIX | 0.000 | 2.22 | | MSCI_EQUITY | 0.021 | 2.41 | | MOVE_INDEX | 0.000 | 1.39 | | FTX | 0.013 | 1.17 | | Note: No evidence for multicollinearity since VIF for all the covariates are much less than the value 10. |
|