by Sourajyoti Sardar, Aditya Mishra, Manu Swarnkar, and Tushar B. Das^ The article explores regional variations in consumer confidence in India, analysing households’ sentiment across various survey parameters. The survey results indicate that sentiments vary across regions, with one region more optimistic about the current situation and another about the future. The analysis suggests that regional price pressures, income, and employment conditions shape the overall economic perspective, with this relationship becoming more pronounced during the pandemic. I. Introduction Consumer confidence surveys attempt at gauging household sector’s opinion on the overall economic conditions and the health of the economy from the perspective of consumers. The socioeconomic status of individuals plays a significant role in shaping their macroeconomic expectations and perceptions (Das, 2017). Variations in socioeconomic conditions among individuals can lead to significant differences in their outlook (Mankiw et al., 2003; Souleles, 2004; Puri and Robinson, 2007; Dominitz and Manski, 2007). In a vast country like India, regional differences can further contribute to this heterogeneity due to differences in their socioeconomic characteristics. Regional differences can arise from variations in per capita income, health and education standards, industrialisation levels, employment opportunities, infrastructure, and savings and consumption behaviour of households, among other factors. There is a strong correlation between consumer confidence and economic activity (Kilic and Cankaya, 2016). Consumer confidence data contain valuable lead information about economic conditions (Kumar et al., 2019). However, economic activity alone does not provide a comprehensive understanding of the factors influencing consumer confidence. Furthermore, local business cycles may not align perfectly with national cycles (Owyang et al., 2004), and consumer confidence can respond differently to changes in employment and consumption depending on geographic location (Guo, 2016). Ohlan (2012) found that the Southern region of India tends to have more balanced socioeconomic development compared to the Central and Northern regions, highlighting the importance of considering regional variations. The southern and western parts of India demonstrate higher degrees of industrialisation, evident in a larger concentration of factories despite having a lower proportion of the overall population (Chart B1 in Annex B). Additionally, these regions have a higher proportion of urban dwellers and significantly higher incomes. For instance, Karnataka, Kerala, and Tamil Nadu alone have a combined gross state domestic product (GSDP) higher than 13 eastern states, including the Northeast, as well as states like West Bengal, Odisha, Bihar, Jharkhand, and Andaman and Nicobar Islands1. Furthermore, the average regional consumer price indices (CPI-U) compiled using state-wise weights for urban areas also exhibit varying rates of inflation. This article employs qualitative information from the Consumer Confidence Survey (CCS) conducted by the Reserve Bank of India (RBI) to analyse regional variations in consumer sentiments in India. Introducing the newly designed “Regional Sentiment Indicator” (RSI), this study utilises qualitative data analysis methods, including coherence analysis and ordered logistic regression, to investigate variations in survey responses across different regions. Section II of this article offers an overview of both the data and the techniques employed in the study. The subsequent sections of the paper provide an overview of the regional variations in sentiments across various survey indicators (Section III), analyse the relationship between survey responses in different regions (Section IV), and study the regional patterns in the perception and outlook of the general economic situation (Section V). This section sheds further light on variations in sentiments among different occupation and income categories. Finally, the article concludes with the major findings and policy implications of the study (Section VI). II. Data and Methodology The CCS gathers information on households’ current perceptions compared to a year ago, along with their expectations for the year ahead on key macroeconomic indicators like the general economic condition, employment scenario, price level of the economy, as well as individual households’ income and spending. Respondents express their sentiments on these parameters on a three-point scale. Using these data, RBI compiles two consumer confidence indices: The Current Situation Index (CSI)2 and the Future Expectation Index (FEI). The respondent-level data of CCS, available in RBI’s Database on Indian Economy3, have been used for this article. Detailed survey description is provided in Annex A. Since March 2021, the consumer confidence survey has been conducted in 19 cities. However, to ensure a longer time series, 13 common cities are considered for this study. These cities are divided into 4 regions, viz., north (Delhi, Jaipur, and Lucknow), south (Bengaluru, Hyderabad, Chennai, and Thiruvananthapuram), east (Kolkata, Guwahati, and Patna) and west (Mumbai, Ahmedabad, and Bhopal) and have been surveyed since September 2017. The study covers 34 rounds beginning from September 2017. Responses of survey parameters are solicited on a three-point scale (viz., improved/ will improve, worsened/ will worsen and remained/ will remain same). The survey results are usually converted into a single quantitative number using the ‘Net- Response’ which is defined as the percentage of the respondents reporting a negative sentiment for a parameter subtracted from the percentage reporting a positive sentiment for that parameter. Net Responses can range from -100 to +100 (see Annex A for details). To analyse regional variations, net responses for each parameter are calculated for all four regions across the 34 survey rounds. The paper introduced a novel metric, specifically the ‘Regional Sentiments Indicator’ (RSI), to analyse these regional variations. The RSI, expressed as a percentage, shows how many times the net response of a region scores better (in terms of optimism or less pessimism) than the all-India average for a specific parameter (e.g., income situation, employment condition) within a given time frame (a set of survey rounds). The RSI scale ranges from 0 to 100, with 0 representing the most pessimistic or least optimistic scenario, and 100 signifying the most optimistic or least pessimistic scenario. The concept is extended to the CSI and FEI indices in order to measure how many times the regional CSI/FEI scores better than the all-India CSI/FEI within a specific time frame, which is also expressed as a percentage. The RSI is derived as given below: Next, we analyse the relationship between various parameters, using ‘coherence coefficient’, a statistic commonly used to assess similarity. The coherence coefficient is computed as the percentage of identical responses for two variables out of the total number of responses in a specific survey round, thereby indicating alignment between the two parameters. To understand the factors that condition the respondents’ views on the general economic situation, we employ ordered logistic regression. The dependent variable (views on the general economic situation) is ordered in three categories: “improved/ will improve” (coded as 1), “remained the same/ will remain the same” (coded as 2), and “worsened/ will worsen” (coded as 3). We investigate this variable separately for two different time horizons, representing perceptions and expectations. We include region (North, South, East, and West), annual income (categorised as less than ₹1 lakh, ₹1 lakh to ₹3 lakhs, ₹3 lakhs to ₹5 lakhs, and more than ₹5 lakhs), and occupation (Daily Workers, Employed, Self Employed/Business, Homemakers, Retired/ Pensioners, and Others) as explanatory variables. We present region-wise predicted probabilities for respondents’ perceptions and expectations regarding the general economic situation during three distinct periods: pre-pandemic, pandemic, and post-pandemic. To interpret the outcomes of the parameter estimates, we use odds ratios.4 An odds ratio greater than 1 implies increasing odds of being in a higher category with a unit increase in the predictor, whereas an odds ratio less than 1 implies decreasing odds of being in a higher category with a unit increase in the predictor. The three-point outcomes of respondents’ views on the general economic situation are categorised as follows: [1 - ‘Optimistic’], [2 - ‘Neutral’], and [3 - ‘Pessimistic’]. The COVID-19 pandemic had a profound impact on both the global and domestic economic conditions. Evidence suggests that it affected Indian households differently during its various phases (Sardar et al., 2023). To capture regional divergence during normal economic cycles and economic turmoil caused by the pandemic, we divide the study period, starting from September 2017, into three distinct time periods: pre-pandemic (up to March 2020), pandemic (May 2020 to January 2022), and post-pandemic (March 2022 onwards). The period after the Omicron wave in January 2022 is considered the post-pandemic period. III. Regional Variation in Consumer Confidence III.1 Regional Variation in Overall Confidence Consumer confidence5 mirrors the regional variation in income inequality, price dynamics, industrialisation, urbanisation etc., alluded to in Section I. Based on the CSI, the current consumer confidence levels in the south and west regions were less pessimistic than the all-India average for 94 per cent and 74 per cent of the time, respectively. In the western region, most of the survey rounds with lower regional CSI than the all-India CSI occurred during the pandemic period from May 2020 to January 2022. Conversely, the CSI for the northern region remained below the all-India CSI for 15 consecutive rounds, starting from September 2020. In the case of northern region, consumer confidence stood better than the all-India average in less than 30 per cent of all the survey rounds. Meanwhile, consumer confidence in the eastern region was lower than the all-India CSI for 85 per cent of the survey rounds (Table 1, Chart 1, and Chart C1 in Annex C). 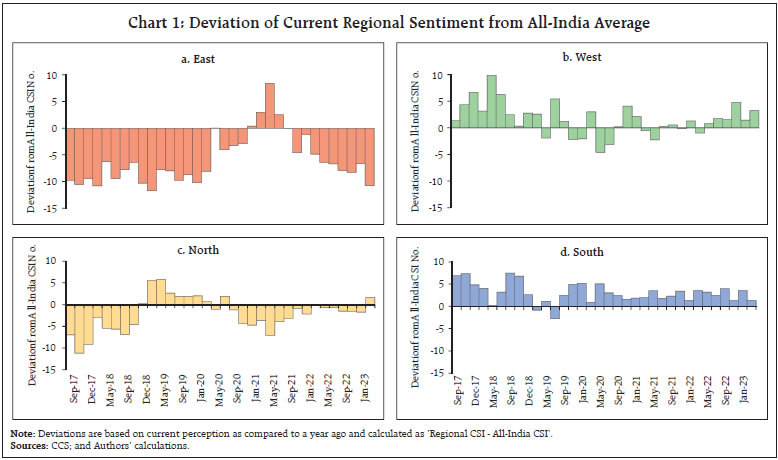 On the contrary, although consumers in the southern region consistently showed optimism in their current perception (in terms of CSI) compared to those in all other regions, their outlook (measured by FEI) did not match their current perceptions regarding economic indicators. Only for 37 per cent of the times, their outlook was more optimistic than the national average. Similarly, there is a contrast in the northern region, where respondents were more optimistic about the future but usually downbeat about their current situation. Regarding the year-ahead outlook, the sentiment in the western region was better than the all-India average for 97 per cent of the survey period. Conversely, the FEI for the east region remained lower than the all-India FEI for all the 34 rounds (Table 1, Chart 2, and Chart C2 in Annex C). III.2 Regional Variation Among Survey Parameters Generally, the results obtained from summarising the indices align with the majority of regional-level parameters, although some differences arise regarding their levels of optimism or pessimism. The summary indices are created by taking the average of net responses from five key parameters and as such the direction of movement (whether it’s towards optimism or pessimism) in these summary indices may not be fully reflected in each individual parameter. In the northern region, despite muted sentiments regarding current employment and income, it retained the highest level of optimism regarding the overall economic situation. A higher proportion of households in this region expressed less pessimism about price levels compared to the national average. It appears that households’ views on the current general economic state are mainly shaped by perceptions of pricing rather than employment circumstances or household income. Since the onset of the pandemic, while consumers’ sentiments on other parameters remained mostly below the all-India average for the northern region, their sentiment on price levels remained mostly above the all-India average, despite some decline. Their perspective on inflation also tended to be less pessimistic than the national average most of the time. In contrast to their current views, households in the northern region are optimistic about the upcoming year, showing improved sentiment regarding future income and employment (Table 1, Chart C1 to C18 in Annex C). In contrast, the southern region exhibits a lower RSI value for the current period’s general economic situation, standing at 56. This appears to be on account of a higher percentage of households perceiving increased prices in essential expenses in the southern region compared to the national average. However, Southern households displayed significant optimism about present employment and income conditions, yielding the highest RSI among all regions. Additionally, the positive outlook on income prompted increased non-essential spending during the current period, partially offsetting price pressures. Conversely, although future income projections suggest restrained non-essential expenditures in the upcoming year, less pessimism regarding prices has led to decreased spending on essential items (Table 1, Chart C1 to C18 in Annex C). The western region tends to be less pessimistic in its assessment of the general economic situation, on account of favourable survey responses on employment conditions, income scenarios, and price levels across most survey rounds. The RSI for the current period’s general economic situation in the western region is 71, the second highest among the regions. Households in the west are the most optimistic about the economic outlook, with the RSI for the future general economic situation reaching 97. Similar to the northern region, the lower price pressure in the western region results in reduced essential spending (Table 1, Chart C1 to C18 in Annex C). | Table 1: Regional Sentiment Indicator | | (in per cent) | | Parameters | Period | Region | | North | South | East | West | | General Economic Situation | Current Period as compared to one year ago | 88 | 56 | 3 | 71 | | Employment Scenario | 6 | 100 | 3 | 88 | | Price Levels | 88 | 18 | 0 | 76 | | Inflation | 85 | 56 | 24 | 12 | | Household Income | 3 | 94 | 38 | 79 | | Overall Spending | 18 | 76 | 100 | 12 | | Essential Spending | 6 | 82 | 100 | 15 | | Non-Essential Spending | 56 | 71 | 50 | 29 | | Current Situation Index | 29 | 94 | 15 | 74 | | General Economic Situation | One year ahead from now | 79 | 68 | 0 | 97 | | Employment Scenario | 41 | 85 | 0 | 94 | | Price Levels | 74 | 41 | 18 | 56 | | Inflation | 97 | 53 | 18 | 9 | | Household Income | 41 | 41 | 3 | 94 | | Overall Spending | 74 | 6 | 71 | 76 | | Essential Spending | 74 | 15 | 82 | 71 | | Non-Essential Spending | 62 | 21 | 32 | 79 | | Future Expectations Index | 71 | 38 | 0 | 97 | | Sources: CCS; and Authors’ calculations. | IV. Assessing Regional Variation Among Households’ Sentiment Using Coherence Analysis This section focuses on coherence analysis, exploring the connections among diverse economic factors such as the general economic situation, employment scenario, income, spending, and price levels, and their distinct impacts across regions. Through a thorough investigation, this section attempts to examine the relationships between these variables, especially during pre-pandemic, pandemic, and post-pandemic periods, unveiling valuable trends and regional drivers (Table D1 in Annex D). The key discoveries from this analysis are outlined below. a) Strong coherence exists between the general economic situation and employment scenario across all regions, especially during the pandemic, with the northern and eastern regions showing peak coherence. b) The relationship between the sentiment on households’ own income and their view of the overall employment situation, although relatively high during the pandemic, has returned to pre-pandemic levels for all regions, with the strongest link observed in the northern region. c) Alignment of sentiment between price levels and general economic situation surged during the pandemic, remaining high thereafter, notably in the eastern region, impacting consumer perceptions. d) Essential expenditures primarily drive overall spending, showing high coherence with price levels across regions, indicating price inelasticity. Non-essential spending, however, is more price elastic, showing less alignment with price levels. e) During the pandemic, coherence between price levels and non-essential spending deteriorated across regions, persisting post-pandemic. Overall spending is less correlated with non-essential spending compared to essential spending, a trend continuing post-pandemic. f) Divergence in spending patterns, notably in the eastern region, indicates increased essential spending due to price pressure, coupled with decreased non-essential spending, driven by heightened pessimism regarding employment and income during and post-pandemic periods. V. How Different Groups Perceive General Economic Situation in Each Region? This section analyses consumers’ sentiments regarding the general economic situation, which constitutes one of the five survey parameters across three distinct time periods. To explore this aspect, we employ ordinal logistic regression to determine if the regional distribution significantly influences perceptions and outlook concerning the general economic situation – a key variable of interest. Additionally, we incorporate income and occupation categories as explanatory variables. We use computed odds ratios from regression to provide a comparative assessment of the level of pessimism within a particular “group” – for instance, households residing in the east region – concerning the general economic situation, in relation to the other groups. The predicted probabilities derived from the logistic regression indicate that, for all three time periods, the eastern region reported higher pessimism regarding the general economic situation compared to other regions (Chart 3). When considering the households’ current perceptions, during the pre-pandemic period, the odds of being pessimistic were 0.48 times lower for households in the north, 0.55 times lower for households in the south and the west, in comparison to households in the east region (Table 2). However, as the pandemic unfolded, these odds ratios increased towards the reference region (i.e., east). The southern regions exhibited the least pessimism among the surveyed regions. This trend persisted throughout the post-pandemic period. 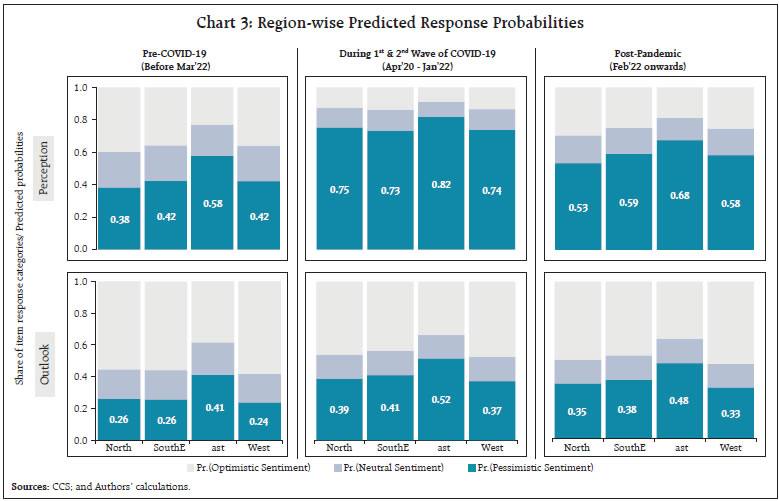 On the other hand, when analysing households’ outlook across the survey parameters, the predicted probabilities indicated a generally positive sentiment, with optimism prevailing. However, during the pandemic, optimism declined significantly but remained higher than pre-pandemic levels. The odds of being pessimistic about the economic outlook were 0.53 times lower for households in the north, 0.50 times lower for households in the south, and 0.46 times lower for households in the west compared to those in the eastern region during the pre-pandemic period (Table 2). Similar to the current perception findings, the odds ratios for all regions increased during the pandemic and remained relatively stable thereafter. Throughout the study period, households in the western region displayed the lowest level of pessimism regarding the economic outlook. Sentiments based on income and occupation categories showed remarkable similarities across regions, indicating consistent consumer behaviour among respective classes throughout the regions. As household income increased, the level of optimism also improved, although all income classes experienced a decline in sentiment during the pandemic, and the sentiments have not yet fully returned to pre-pandemic levels. Notably, in the post-pandemic period, the gap between sentiments among different income classes widened, with higher-income groups displaying less pessimism compared to lower-income groups. A similar pattern emerged in the one-year-ahead outlook, with higher-income groups being significantly less likely to express pessimism after the pandemic, compared to earlier (Table E1 and E2 in Annex E). | Table 2: Odds of Negative Sentiments for General Economic Situation | | | Pre-COVID-19
(Before Mar-2020) | COVID-19 Period
(Apr 2020 - Jan 2022) | Post-pandemic
(Feb 2022 onwards) | Odd Ratio
(95% CI*) | p-value | Odd Ratio
(95% CI*) | p-value | Odd Ratio
(95% CI*) | p-value | | Dependent Variable: Current Perception on General Economic Situation | | Independent Variables | | Region | | East | Reference | | Reference | | Reference | | | North | 0.481
(0.461, 0.501) | 0.000 | 0.706
(0.662, 0.753) | 0.0000 | 0.610
(0.570, 0.653) | 0.000 | | South | 0.546
(0.526, 0.567) | 0.000 | 0.609
(0.573, 0.648) | 0.0000 | 0.740
(0.693, 0.790) | 0.000 | | West | 0.551
(0.529, 0.573) | 0.000 | 0.624
(0.586, 0.665) | 0.0000 | 0.701
(0.656, 0.750) | 0.000 | | Dependent Variable: 1-Year Ahead Expectations on General Economic Situation | | Independent Variables | | Region | | East | Reference | | Reference | | Reference | | | North | 0.527
(0.506, 0.549) | 0.000 | 0.613
(0.583, 0.645) | 0.000 | 0.633
(0.595, 0.674) | 0.000 | | South | 0.504
(0.485, 0.523) | 0.000 | 0.659
(0.628, 0.692) | 0.000 | 0.686
(0.646, 0.729) | 0.000 | | West | 0.462
(0.444, 0.481) | 0.000 | 0.564
(0.536, 0.592) | 0.000 | 0.547
(0.514, 0.582) | 0.000 | Note: * Indicates confidence interval.
Sources: CCS; and Authors’ calculations. | When examining sentiments by occupation categories concerning the current general economic situation, retired individuals were the least optimistic before the pandemic, followed by the self-employed. However, during the pandemic when containment measures were in place to control infections, the self-employed category became the least optimistic, with daily workers ranking second. After the Omicron wave of COVID in January 2022, and with the easing of restrictions, the self-employed category exhibited the fastest recovery in current perceptions. Nevertheless, daily workers continued to be among the most pessimistic occupation categories, alongside retired individuals. VI. Conclusion This article analysed the regional variations in consumer confidence and related survey parameters, indicating the impact of regional differences in income inequality, price dynamics, industrialisation, and urbanisation. The south and west regions demonstrate relatively higher consumer confidence levels than the all-India average, while the northern region exhibits intermittent optimism. The coherence analysis highlights the strong influence of price levels on consumers’ perceptions of the general economic situation, especially in the eastern region. The relationship between households’ sentiment on their own income and their view on overall employment scenario, although relatively high during the pandemic, has returned to pre-pandemic levels for all regions, with the strongest link observed in the northern region. The study also reveals that overall spending is primarily driven by essential expenditures, which are mostly price inelastic, while non-essential spending shows less alignment with price levels. The higher income groups displayed more optimism post-pandemic. References: Celik, S., Aslanoglu, E. and Uzun, S. (2010). Determinants of Consumer Confidence in Emerging Economies: A Panel Cointegration Analysis. Topics in Middle Eastern and North African Economies, 12. Das, A., Lahiri, K., and Zhao, Y. (2017). Asymmetries in Indian Inflation Expectations. In Workshop on “Forecasting Issues in Developing Economies”. IMF, Washington DC. Dominitz, J., and Manski, C. F. (2007). Expected equity returns and portfolio choice: Evidence from the Health and Retirement Study. Journal of the European Economic Association, 5(2-3), 369-379. Fernandez, R., Immervoll, H., Pacifico, D., Browne, J., Neumann, D., and Thévenot, C. (2018). Faces of Joblessness in Spain: A People-centred perspective on employment barriers and policies. Guo, J. (2016). Regional Differences in Consumer Confidence, Consumption, and Employment: 2001- 2014. Yale University. Kilic, E. and Cankaya, S. (2016). Consumer confidence and economic activity: a factor augmented VAR approach. Applied Economics, 48:32, 3062-3080. Kumar, N., Singh, D.P. and Mishra, A. (2019). Efficacy of the Consumer Confidence Survey in Forecasting Macro-Economic Conditions. RBI Bulletin, Vol. 73(12). Mankiw, N. G., Reis, R., and Wolfers, J. (2003). Disagreement about inflation expectations. NBER macroeconomics annual, 18, 209-248. Ohlan, R. (2013). Pattern of regional disparities in socio-economic development in India: District level analysis. Social Indicators Research, 114, 841-873. Owyang, M. T., Piger, J., and Wall, H. J. (2005). Business cycle phases in US states. Review of Economics and Statistics, 87(4), 604-616. Puri, M., and Robinson, D. T. (2007). Optimism and economic choice. Journal of financial economics, 86(1), 71-99. Sardar, S., Sanyal, A., and Das, T.B. (2023). Did COVID-19 Affect Households Differently? Understanding Heterogeneity in Consumer Confidence. RBI Working Paper Series No. 06, 06/2023. Souleles, N. S. (2004). Expectations, heterogeneous forecast errors, and consumption: Micro evidence from the Michigan consumer sentiment surveys. Journal of Money, Credit and Banking, 39-72.
Annex-A: Survey Description I. Survey Coverage and Questionnaire Since its inception in June 2010, the survey coverage has been gradually expanded and currently, since March 2021, it is conducted in 19 cities, viz., Ahmedabad, Bengaluru, Bhopal, Bhubaneswar, Chandigarh, Chennai, Delhi, Guwahati, Hyderabad, Jammu, Jaipur, Kolkata, Lucknow, Mumbai, Nagpur, Patna, Raipur, Ranchi and Thiruvananthapuram. In each survey round, around 6,100 households are sampled, using a hybrid two stage sampling design. At the first stage in a city, the polling booths are selected by systematic random sampling, arranging all polling booths as per their constituencies. In the second stage, 15 respondents are selected from each selected polling booth area, following the right-hand rule. The households are asked about their current perception and one-year ahead outlook on five major parameters viz., general economic situation, employment scenario, price level, household’s income and spending. In addition, the survey also elicits responses on rate of price change and households’ own essential and non-essential spending. The responses are recorded on a three-point scale (i.e., improve/ will improve, worsened/ will worsen and remained/ will remain same). II. Consumer confidence indices The survey responses are summarised using “net response”, which is defined as the percentage of respondents reporting a decrease (negative), subtracted from the percentage reporting an increase (positive). Net Responses can take values from –100 to +100. To summarise the consumers’ confidence on various parameters, two consumer confidence indices are formulated, viz., the Current Situation Index (CSI), which reflects consumer confidence for the current period as compared to one year ago, and the Future Expectations Index (FEI), reflecting the outlook for one year ahead. The indices are calculated as follows: Overall Index = 100 + Average (Net Response of selected parameters) where, Net Response = Positive sentiments (per cent) – Negative sentiments (per cent) The CSI and FEI summarise the current perception and one-year ahead outlook, respectively, on five major parameters, viz., economic conditions, employment, price level, income and spending. The CSI and the FEI can take values between 0 to 200. An index value below 100 indicates pessimism, whereas that above 100 signals optimism.
Annex-B: Regional Variation
Annex-C: Regional Consumer Confidence
Annex-D: Coherence Between Survey Parameters | Table D1: Coherence Between Survey Parameters - Regions Wise | | Parameter combination | Period | Current Period as compared to One Year Ago | | North | South | East | West | Overall | | | Pre-pandemic | 56.6 | 54.8 | 60.2 | 61.6 | 57.8 | | General Economic Situation vs Employment Scenario | Pandemic | 76.4 | 66.9 | 74.9 | 71.2 | 71.8 | | | Post-Omicron | 65.2 | 56.2 | 66.9 | 65.9 | 62.8 | | | Pre-pandemic | 42.6 | 42.1 | 59.4 | 44.8 | 45.7 | | General Economic Situation vs Price Levels | Pandemic | 71.0 | 68.9 | 78.7 | 68.7 | 71.0 | | | Post-Omicron | 55.3 | 57.3 | 67.4 | 58.2 | 58.6 | | | Pre-pandemic | 46.4 | 41.9 | 40.0 | 42.4 | 42.7 | | Household Income vs Employment Scenario | Pandemic | 63.9 | 54.9 | 55.7 | 56.7 | 57.9 | | | Post-Omicron | 47.3 | 41.8 | 45.4 | 42.7 | 44.1 | | | Pre-pandemic | 44.4 | 42.9 | 39.7 | 46.3 | 43.6 | | Household Income vs Non-essential Spending | Pandemic | 53.6 | 52.3 | 55.6 | 59.1 | 55.0 | | | Post-Omicron | 48.5 | 42.4 | 50.1 | 47.8 | 46.7 | | | Pre-pandemic | 69.3 | 78.8 | 85.0 | 73.3 | 76.2 | | Price Levels vs Overall Spending | Pandemic | 55.1 | 59.7 | 68.2 | 51.5 | 57.7 | | | Post-Omicron | 72.8 | 72.7 | 73.0 | 72.9 | 72.8 | | | Pre-pandemic | 72.5 | 84.2 | 87.4 | 78.9 | 80.7 | | Price Levels vs Essential Spending | Pandemic | 65.1 | 71.5 | 78.7 | 64.0 | 69.0 | | | Post-Omicron | 81.0 | 82.5 | 86.9 | 80.9 | 82.4 | | | Pre-pandemic | 36.7 | 48.3 | 51.5 | 44.6 | 45.2 | | Price Levels vs Non-essential Spending | Pandemic | 13.6 | 19.8 | 11.7 | 13.0 | 15.0 | | | Post-Omicron | 19.1 | 26.0 | 15.6 | 21.8 | 21.4 | | | Pre-pandemic | 88.2 | 88.0 | 92.1 | 86.7 | 88.4 | | Overall Spending vs Essential Spending | Pandemic | 83.6 | 80.1 | 84.6 | 78.9 | 81.4 | | | Post-Omicron | 88.2 | 85.6 | 83.8 | 87.9 | 86.6 | | | Pre-pandemic | 51.1 | 60.9 | 60.0 | 60.1 | 58.3 | | Overall Spending vs Non-essential Spending | Pandemic | 43.1 | 44.2 | 27.5 | 42.4 | 40.7 | | | Post-Omicron | 37.3 | 43.5 | 28.6 | 38.0 | 38.0 | | | Pre-pandemic | 67.5 | 64.3 | 67.8 | 71.8 | 67.5 | | General Economic Situation vs Employment Scenario | Pandemic | 70.9 | 64.2 | 71.3 | 69.5 | 68.5 | | | Post-Omicron | 69.2 | 64.1 | 69.8 | 72.1 | 68.5 | | | Pre-pandemic | 33.7 | 30.8 | 49.5 | 33.1 | 35.1 | | General Economic Situation vs Price Levels | Pandemic | 44.6 | 43.7 | 56.5 | 41.2 | 45.3 | | | Post-Omicron | 40.8 | 41.4 | 52.7 | 38.4 | 42.2 | | | Pre-pandemic | 51.8 | 53.2 | 47.1 | 53.9 | 52.1 | | Household Income vs Employment Scenario | Pandemic | 49.2 | 46.6 | 45.4 | 47.6 | 47.3 | | | Post-Omicron | 49.7 | 45.3 | 46.1 | 51.5 | 48.2 | | | Pre-pandemic | 49.0 | 49.3 | 46.4 | 51.2 | 49.2 | | Household Income vs Non-essential Spending | Pandemic | 44.0 | 38.8 | 43.9 | 45.8 | 42.8 | | | Post-Omicron | 47.9 | 33.3 | 45.8 | 45.7 | 42.4 | | | Pre-pandemic | 66.2 | 74.3 | 75.9 | 71.6 | 72.0 | | Price Levels vs Overall Spending | Pandemic | 59.0 | 57.4 | 59.9 | 58.9 | 58.6 | | | Post-Omicron | 69.5 | 62.7 | 65.9 | 69.2 | 66.8 | | | Pre-pandemic | 67.6 | 77.0 | 78.4 | 73.0 | 74.0 | | Price Levels vs Essential Spending | Pandemic | 62.8 | 61.3 | 65.3 | 62.9 | 62.8 | | | Post-Omicron | 73.4 | 67.1 | 75.0 | 72.2 | 71.4 | | | Pre-pandemic | 43.7 | 51.5 | 51.3 | 51.4 | 49.6 | | Price Levels vs Non-essential Spending | Pandemic | 30.3 | 29.2 | 25.9 | 33.8 | 30.2 | | | Post-Omicron | 34.2 | 28.8 | 25.4 | 40.4 | 32.8 | | | Pre-pandemic | 91.8 | 89.6 | 92.0 | 91.5 | 91.0 | | Overall Spending vs Essential Spending | Pandemic | 89.5 | 85.1 | 87.4 | 88.0 | 87.4 | | | Post-Omicron | 91.8 | 88.1 | 86.2 | 92.9 | 90.0 | | | Pre-pandemic | 55.9 | 65.2 | 63.6 | 66.0 | 63.0 | | Overall Spending vs Non-essential Spending | Pandemic | 47.1 | 47.2 | 45.0 | 53.6 | 48.5 | | | Post-Omicron | 47.3 | 46.6 | 42.0 | 53.6 | 47.9 | | Sources: CCS; and Authors’ calculation. |
Annex-E: Results of Ordinal Logistic Regression | Table E1: Odds of Negative Sentiments for Current Period | | | Pre-COVID-19
(Before Mar-2020) | COVID-19 Period
(Apr 2020 - Jan 2022) | Post-pandemic
(Feb 2022 onwards) | Odd Ratio
(95% CI) | p-value | Odd Ratio
(95% CI) | p-value | Odd Ratio
(95% CI) | p-value | | Dependent Variable: Current Perception on General Economic Situation | | | Independent Variables | | Region | | East | Reference | | Reference | | Reference | | | North | 0.481
(0.461, 0.501) | 0.0000 | 0.706
(0.662, 0.753) | 0.0000 | 0.610
(0.570, 0.653) | 0.0000 | | South | 0.546
(0.526, 0.567) | 0.0000 | 0.609
(0.573, 0.648) | 0.0000 | 0.740
(0.693, 0.790) | 0.0000 | | West | 0.551
(0.529, 0.573) | 0.0000 | 0.624
(0.586, 0.665) | 0.0000 | 0.701
(0.656, 0.750) | 0.0000 | | Income | | ₹1 lakh or less | Reference | | Reference | | Reference | | | ₹1 to less than 3 lakhs | 0.803
(0.782, 0.825) | 0.0000 | 0.910
(0.872, 0.948) | 0.0000 | 0.815
(0.776, 0.856) | 0.0000 | | ₹ 3 lakh to 5 lakhs | 0.689
(0.657, 0.723) | 0.0000 | 0.713
(0.667, 0.762) | 0.0000 | 0.630
(0.591, 0.671) | 0.0000 | | ₹5 lakh or more | 0.709
(0.660, 0.762) | 0.0000 | 0.670
(0.61, 0.736) | 0.0000 | 0.496
(0.450, 0.546) | 0.0000 | | Education | | Daily Workers | Reference | | Reference | | Reference | | | Employed | 0.909
(0.868, 0.952) | 0.0001 | 0.928
(0.863, 0.997) | 0.0405 | 0.817
(0.756, 0.884) | 0.0000 | | Homemakers | 1.092
(1.045, 1.142) | 0.0001 | 1.085
(1.011, 1.164) | 0.0231 | 1.040
(0.965, 1.119) | 0.3046 | | Retired/Pensioners | 1.237
(1.157, 1.323) | 0.0000 | 0.843
(0.759, 0.936) | 0.0014 | 1.006
(0.893, 1.135) | 0.9176 | | Self Employed/ Business | 1.051
(1.001, 1.103) | 0.0452 | 1.091
(1.012, 1.176) | 0.0226 | 0.840
(0.773, 0.912) | 0.0000 | | Others | 0.769
(0.728, 0.812) | 0.0000 | 0.855
(0.787, 0.928) | 0.0002 | 0.724
(0.663, 0.790) | 0.0000 | | Sources: CCS; and Authors’ calculation. |
| Table E2: Odds of Negative Sentiments for One Year Ahead | | | Pre-COVID-19
(Before Mar-2020) | COVID-19 Period
(Apr 2020 - Jan 2022) | Post-pandemic
(Feb 2022 onwards) | Odd Ratio
(95% CI) | p-value | Odd Ratio
(95% CI) | p-value | Odd Ratio
(95% CI) | p-value | | Dependent Variable: 1-Year Ahead Expectations on General Economic Situation | | | Independent Variables | | Region | | East | Reference | | Reference | | Reference | | | North | 0.527
(0.506, 0.549) | 0.0000 | 0.613
(0.583, 0.645) | 0.0000 | 0.633
(0.595, 0.674) | 0.0000 | | South | 0.504
(0.485, 0.523) | 0.0000 | 0.659
(0.628, 0.692) | 0.0000 | 0.686
(0.646, 0.729) | 0.0000 | | West | 0.462
(0.444, 0.481) | 0.0000 | 0.564
(0.536, 0.592) | 0.0000 | 0.547
(0.514, 0.582) | 0.0000 | | Income | | 1 lakh or less | Reference | | Reference | | Reference | | | ₹1 to less than 3 lakh | 0.826
(0.804, 0.849) | 0.0000 | 0.932
(0.901, 0.964) | 0.0000 | 0.848
(0.810, 0.887) | 0.0000 | | ₹3 lakh to 5 lakh | 0.740
(0.704, 0.778) | 0.0000 | 0.731
(0.691, 0.774) | 0.0000 | 0.665
(0.625, 0.707) | 0.0000 | | ₹5 lakh or more | 0.747
(0.693, 0.805) | 0.0000 | 0.656
(0.604, 0.712) | 0.0000 | 0.579
(0.526, 0.637) | 0.0000 | | Education | | Daily Workers | Reference | | Reference | | Reference | | | Employed | 0.905
(0.862, 0.949) | 0.0000 | 0.842
(0.794, 0.893) | 0.0000 | 0.846
(0.785, 0.912) | 0.0000 | | Homemakers | 0.973
(0.930, 1.019) | 0.2443 | 0.873
(0.825, 0.925) | 0.0000 | 0.900
(0.839, 0.966) | 0.0033 | | Retired/Pensioners | 1.213
(1.134, 1.298) | 0.0000 | 0.906
(0.829, 0.990) | 0.0289 | 1.056
(0.943, 1.182) | 0.3477 | | Self Employed/ Business | 1.016
(0.967, 1.067) | 0.5280 | 0.920
(0.865, 0.978) | 0.0073 | 0.904
(0.836, 0.978) | 0.0120 | | Others | 0.745
(0.703, 0.788) | 0.0000 | 0.769
(0.718, 0.823) | 0.0000 | 0.703
(0.645, 0.765) | 0.0000 | | Sources: CCS; and Authors’ calculation. |
|