Global growth was resilient in the first quarter of 2024. Many central banks have pivoted towards a less restrictive monetary policy stance in response to the fall in inflation in their economies. In India, high-frequency indicators suggest the real GDP growth in Q1:2024-25 is broadly maintaining the pace it achieved in the preceding quarter. The prospects for agriculture are brightening with the early landfall of the southwest monsoon. Headline inflation is gradually easing, driven by sustained softening of its core component, although the path of disinflation is interrupted by volatile and elevated food prices. Introduction In 1915, the poet Robert Frost wrote about two roads diverging in a yellow wood and not being able to travel both.1 A century and a decade later, a "Frost" inflection moment has arrived, riding on the tides of monetary policy with profound implications for the global economy as it ripples across asset and currency markets. For the first time in almost five years, the European Central Bank (ECB) joined Canada, Switzerland and Sweden among advanced economies (AEs) – the Bank of England is expected to follow soon - and Brazil, Mexico, Chile, Hungary and the Czech Republic among emerging market economies (EMEs) to lower its policy rates by a quarter point and begin the reversal of a historic series of rate increases. In response to a more than 2.5 percentage points fall in inflation, 'dialing back' has begun, but "what is uncertain is the speed of travel and the time it will take"2. The ECB cautioned that it was not pre-committing to a particular rate path and that further moves would depend on the data that are received. Europe faces the same stickiness in wages and prices of services as the US – in fact, both headline and core inflation in the euro zone ticked up in May. Euro area headline inflation is likely to stay above the target well into 2025, going by the ECB's own forecasts. Yet growth has largely stalled since late 2022, barring the slender improvement in the first quarter of 2024, in spite of job creation and wage growth remaining strong on both sides of the Atlantic. Against that backdrop, the ECB's action appears pragmatic and precautionary as it weighs the balance of risks in the shifting dynamics of inflation in forward-looking indicators versus the impact of the high costs of credit on economic activity. This action sets the stage for a variance from the US Fed, which is not expected to follow suit for months. Although core inflation eased in the US in its April and May readings, the consumer remains the key protagonist in the 'no landing' narrative that continues to mark the underlying resilience of economic activity. Yet, signs of a slowing down are taking hold in spite of the Fed delaying arrival at the rate-cutting party. The key evidence is weak personal consumption expenditure in April. Retail sales also flattened in that month. According to the San Francisco Fed, households burned through the last of their US $ 2.1 trillion of pandemic era excess saving in March, pushing them more and more to rely on credit cards. Consequently, accounts are becoming delinquent at a pace last seen in 2011. People who took out loans to buy cars are falling back on repayments, forcing them to sell their vehicles3. Although non-farm payrolls for May surprised on the upside, job openings have also fallen to pre-pandemic levels and concerns are mounting that this is a precursor to lost jobs4. As households' balance sheets weaken, the key circuit breaker has to be the resumption of the decline in inflation and a renewed rise in disposable incomes. The downward revision in the GDP for the first quarter of 2024 and the tumbling of the manufacturing purchasing managers index into negative territory for the second consecutive month in May have added to concerns that the lagged effects of tightening monetary policy are taking effect. Shrill cries are being heard among Wall Street economists that the Fed should begin easing before things go further south. Financial markets are clearly reflecting the divergence. Bond yields climbed to new highs even as stock indices faltered as risk-off sentiment spread. Even low-rated bonds have been swept up in the rally. As market expectations of interest rates embedded in swap curves diverge, so do financial conditions on either side of the Atlantic, although transatlantic currency movements are likely to be small. Carry trades have gained traction to exploit interest rate differences across currency markets. In the carry trade heartland – emerging markets – there has been a strong comeback, especially where interest rates are high and central banks speak cautiously. The Institute of International Finance (IIF) has predicted that capital flows to emerging markets may rise by a third to US $ 903 billion in 2024 if global growth holds up. In the east, the Japanese yen has slid towards 34-year lows, with interventions having only a fleeting effect. Market pressures are mounting to weaken the renminbi so as to reflect the gap in bond yield differentials with the US in spite of tight daily fixings by the People's bank of China. In a development that will cast a shadow on commodity markets in which metal prices are already on the rise, OPEC plus members agreed to extend deep cuts in oil production to the end of 2025 to shore up prices amidst weak global demand and increased supply from other parts of the world. This would keep more than 3 million barrels a day of crude off the market until the end of next year. Eight members, including Saudi Arabia, Russia, Iraq and the UAE would unwind some voluntary cuts from October. It is no surprise, therefore, that the United Nations drew attention in early June 2024 to the veneer of resilience masking both short-term risks and structural vulnerabilities in the global economy as it braces for the lagged effects of past monetary policy tightening5. In its view, underlying price pressures are still elevated in many countries. A further escalation of conflicts risks disrupting energy markets and renewing inflationary pressures worldwide. The prolonged period of high borrowing costs and tight credit conditions present strong headwinds to the world economy already saddled with high levels of debt and starved of investment − including for fighting climate change and making meaningful progress towards the sustainable development goals (SDGs). Meanwhile, geopolitical fragmentation is a growing risk to global trade and industrial production. Labour market conditions are expected by the UN to deteriorate in many developing economies. The firming up of food prices from the second half of 2023 is becoming a significant driver of food insecurity more recently in the developing world, worsening living conditions. An estimated 238 million people experienced acute food insecurity in 2023 alongside the aggravation of poverty, especially in low-income countries facing a decline in official development assistance (ODA). A further reduction in ODA in conjunction with the weakening trend of global investment will risk reversing the hard-earned development gains over several decades gone by. Shifts in supply chains are posing threats to exports from developing economies, although the revival in international tourism strikes a positive note. For this group of countries, dealing with balance of payments concerns and debt sustainability risks will be the challenge of 2024. They will need a broad range of tools, including capital flow management, macroprudential policies and exchange rate management to minimize adverse spillover risks from the divergence that is manifesting itself across shores of the Atlantic. Building buffers is accordingly assuming priority, especially as fiscal space is shrinking amidst higher interest rates and tighter liquidity. The structural challenge is to somehow scale up climate finance to US $ 150 trillion by 2050 for energy transition alone, with US $ 5.3 trillion required annually to transform the global energy sector alone, according to the UN. Overall, it believes that while the world economy avoided the worst-case scenario of a recession in 2023, a protracted period of low growth looms large. In India, real GDP growth surged in 2023-24 to its highest rate since 2016-17, barring the post-COVID rebound in 2021-22, and stunned all projections. There is increasing evidence that in the post-pandemic years, a trend upshift is taking shape, which is shifting India's growth trajectory from the 2003-19 average of 7 per cent to the 2021-24 average of 8 per cent or even more, powered by domestic drivers. More recent indicators suggest that private consumption is resuming its role as the main driver of demand and is getting broad-based to include rural consumers. The fast moving consumer goods sector is gearing up for a strong turnaround on expectations of pick-up in public welfare spending. A drop in walk-in clientele is being compensated for by e-commerce platforms, especially in heatwave conditions. Investment has maintained steady growth; some moderation in the more recent period could be on account of transitory uncertainty weighing on investment decisions but this too shall pass. A strong revival in private investment has to become the most important factor driving growth in the years to come, especially as public finances consolidate. Government consumption spending picked up modestly towards the close of 2023-24, reflecting the sustained focus on capital expenditure which is a positive for the medium-term prospects of the economy and investor sentiment. In a pleasant surprise, net exports have improved their contribution to GDP, especially high-end manufacturing. India has begun to move downstream and engage in exports of finished goods through a rise in the share of pure backward global value chain (GVC) participation, incentivized by export-linked schemes. The services sector is also witnessing a compositional change. GVC participation in services has shown a gradual maturing from low value-added business process outsourcing services to high value-added services such as those provided by global capability centres (GCCs) that have evolved from cost-saving entities to hubs for innovation and high-value activities and are spreading to tier-II cities. Increasingly, the focus is likely to shift to export of services and the leveraging of skilled workforces. India's hospitality industry is seeking to expand the frontiers of tourism in the country. India has the largest tourism and travel sector in south Asia. An ambitious target of adding US $ 1 trillion to GDP through tourism has been set for 2047 by making India a major tourist destination. On the production side, manufacturing has led the expansion in gross value added (GVA), with construction keeping pace. For both, the near-term prospects look bright. In fact, in the case of the latter, India's commercial realty landscape in satellite and tier-II cities is undergoing a significant transformation fueled by infrastructure development in the form of road networks and metro connectivity, strategic urban planning and relatively lower cost of living. Services maintained expansion at pre-pandemic trend rates, and were led by finance, insurance, real estate and business services. Although agriculture and allied activities remained muted, there is considerable optimism about a better performance in 2024-25. The India Meteorological Department (IMD) got it right – the southwest monsoon set in over Kerala two days ahead of its normal arrival. The timely arrival of monsoon rains bodes well for kharif sowing and for the replenishment of reservoirs, which makes the foodgrains target of 340 million tonnes for the 2024-25 crop year (July –June) appear achievable. El Nino conditions, associated with deficient rainfall are likely to turn ENSO neutral during the early part of the monsoon season. The neutral Indian Ocean Dipole (IOD) conditions that prevail currently will turn positive during the monsoon as predicted by climate model forecasts and bring generous rainfall. This will also allay the effects of the severe heat wave that prevailed across northwest, central and eastern parts of the country prior to the onset of the monsoon, with temperatures soaring to 50 degrees celsius and even above in the north. Scientists warn that extreme summer heat has become a public health hazard. India is particularly vulnerable to losing labour productivity due to heatwaves as a large section of its workforce is engaged in outdoor work at this time of the year, as in agriculture, construction and mining. It is estimated that every degree of rise in temperature above 27 degrees celsius lowers labour productivity by 2-4 per cent. These effects are more pronounced in the northern part of the country than in the coastal peninsula. India loses around a quarter of its physical labour supply on very hot days. Added to output effects, this spills over into inflation and to investments in construction and logistics. In the context of promoting resilience to climate change, the recent milestone achieved by India is noteworthy – it added over 10 giga watts of solar capacity in the first quarter of 2024, marking the highest quarterly installation to date. This represents a close to 400 per cent year-on-year (y-o-y) increase. There is a substantial pipeline of large-scale projects for 2024, positioning India to be among the top three solar markets globally, with streamlined auctions and attractive tariffs revitalising the drive. In sync with these developments, greater focus on putting in place transmission infrastructure and mechanism for faster land acquisition become necessary. India has substantial investment opportunities totalling US $ 500 billion by 2030 in the clean energy value chain, including renewables, green hydrogen, electric vehicles and infrastructure transition. As discussed in Section III, a nowcast of economic activity i.e., based on more current high frequency indicators, suggests the real GDP growth in Q1:2024-25 is broadly maintaining the pace it achieved in the preceding quarter. There is, however, a structural break in the formation of GDP since the pandemic. First quarter GDP has tended to record some loss of momentum relative to other quarters since the onset of the pandemic. Hence, some moderation in speed relative to the growth of 7.8 per cent in Q4:2023-24 can be expected in the actual outturn when the National Statistical Office (NSO) releases its estimate in the end of August. A silver lining for the trajectory of GDP in 2024-25 is halting descent of headline inflation in its May 2024 reading. The fifth consecutive month of decline, albeit grudging, opens up space for aggregate demand to benefit from price/ cost reductions. The fact that the ongoing disinflation is being driven by the softening of the core component of consumer price index (CPI) inflation to a new low validates the stance of monetary policy. As long as food price pressures persist, however, the goal of aligning inflation with its target remains a work in progress. Set against this backdrop, the remainder of the article is structured into four sections. Section II covers the rapidly evolving developments in the global economy. An assessment of domestic macroeconomic conditions is set out in Section III. Section IV encapsulates financial conditions in India, while the last Section sets out concluding remarks. II. Global Setting Global economic activity exhibited resilience as reflected in an increasing number of central banks pivoting towards a less restrictive monetary policy stance. In its latest Global Economic Prospects (GEP), the World Bank revised upwards the global growth projection by 20 basis points (bps) to 3.1 per cent in 2024, reflecting expansions of trade and investment (Table II.1). Growth in AEs is projected at 1.5 per cent in 2024, while the emerging-market and developing economies (EMDEs) are expected to grow by 4.0 per cent. Global growth in 2025 is forecasted to be at 3.2 per cent. Even as inflation started to exhibit signs of sustained moderation, growth in major economies, including the UK and euro area, turned positive in Q1:2024. Our model-based nowcast, augmented with the latest high frequency data points to a positive but moderating global growth momentum during Q2:2024 (Chart II.1). 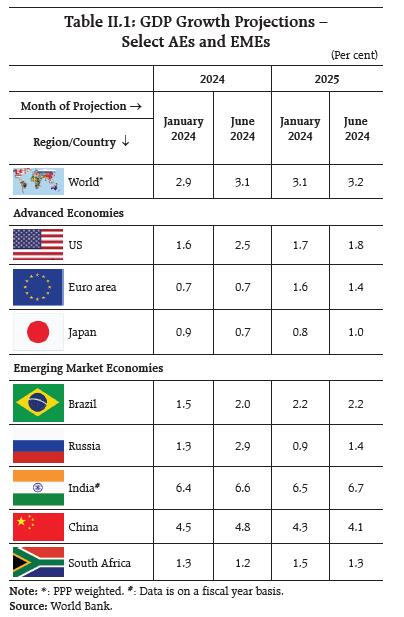 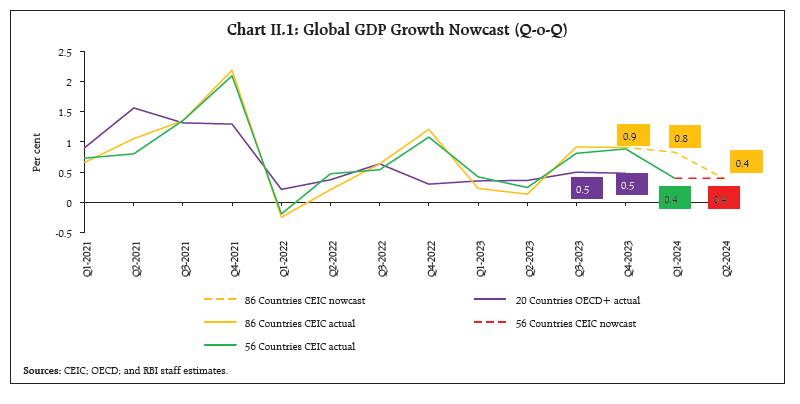 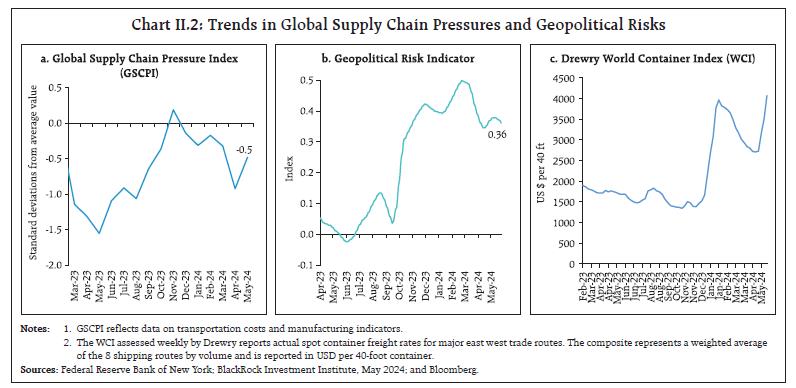 The global supply chain pressures index (GSCPI) recorded an uptick in May 2024 after declining for two consecutive months (Chart II.2a). Geopolitical tensions eased marginally, although the geopolitical risk indicator remained significantly higher than its level recorded a year ago (Chart II.2b). Logistics disruptions led to hardening of shipping costs in the second half of May 2024, imparting upside bias to import costs (Chart II.2c). Consumer sentiments remained pessimistic and fell in the US to their lowest level in five months on account of a rise in the unemployment rate, slow income growth, high interest rates and the still uncertain inflation outlook (Chart II.3a). Financial conditions continued to remain tight across advanced and emerging economies during May 2024, except in Brazil and India (Chart II.3b). 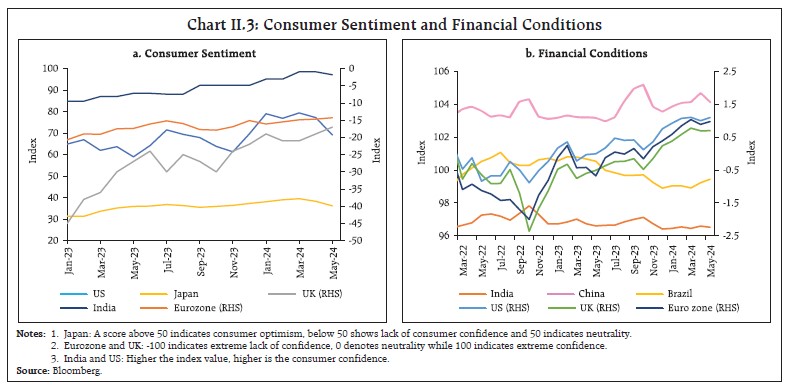 The global composite purchasing managers index (PMI) witnessed a sequential uptick for the seventh successive month, rising to a 12-month high in May 2024. The global manufacturing PMI edged up to a 22-month high in May, remaining above the neutral mark for the fourth successive month as output and new orders expanded at a quicker pace (Chart II.4). The services PMI remained above its manufacturing counterpart and accelerated to a 12-month high in May. The overall improvement in business conditions also reflects a decline in the uncertainty tracker faced by corporates to its lowest level since March 2018 (Chart II.5). The composite PMI for export orders remained in expansionary territory in May 2024, although both manufacturing and services export orders moderated slightly on a sequential basis (Chart II.6). 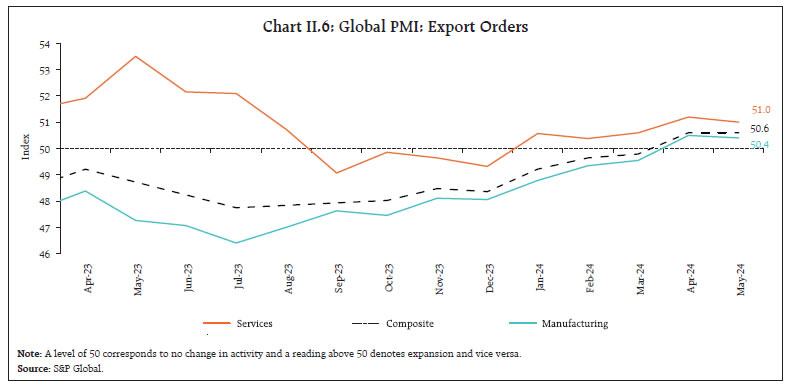 Global commodity prices remained volatile in May and early June. The Bloomberg Commodity Price Index recorded an increase of 5.5 per cent during May 1-20 but corrected towards end-May and early June to erase most of its gains (Chart II.7a). The biggest fall was in the case of oil prices, with Brent oil prices declining by 8.9 per cent (m-o-m) in May. Oil prices continued to moderate in early June after the meeting of OPEC+6. Brent oil prices at US$ 79.6 as on June 10, 2024 indicated that the market priced in the unwinding of "voluntary" cuts starting October (Chart II.7b). The Food and Agriculture Organization's (FAO's) food price index rose by 0.9 per cent (m-o-m) in May 2024, primarily driven by increase in the prices of cereals (6.3 per cent) but partially offset by a fall in sugar prices (-7.5 per cent). The index, however, stood 3.4 per cent below its corresponding value a year ago, due to decline in sugar and cereals prices on a y-o-y basis (Chart II.7c). Helped by weakness in the US dollar and treasury yields, gold prices reached their all-time high levels in May, but corrected subsequently (Chart II.7d). 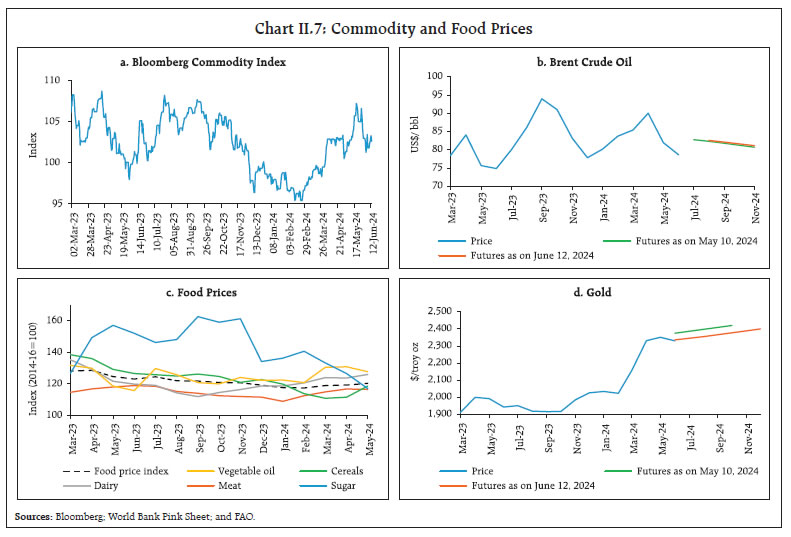 Major economies continue to experience disinflation albeit at a tardy pace. The World Bank GEP projected global inflation to moderate to 3.5 per cent in 2024, and further to 2.9 per cent in 2025. In the US, CPI inflation moderated to 3.3 per cent in May from 3.4 per cent in April, while the headline personal consumption expenditure (PCE) inflation remained unchanged at 2.7 per cent in April. As per flash estimates, euro area inflation edged up to 2.6 per cent in May from 2.4 per cent in April. Inflation in Japan (CPI excluding fresh food) eased to 2.2 per cent in April, while in UK it softened to 2.3 per cent in April (Chart II.8a). Among EMEs, Brazil experienced an increase in inflation in May, while it remained steady in China. Inflation moderated in South Africa in April, whereas it inched up in Russia (Chart II.8b). Core and services inflation remained higher than headline inflation across major AEs barring Japan (Chart II.8c and II.8d). 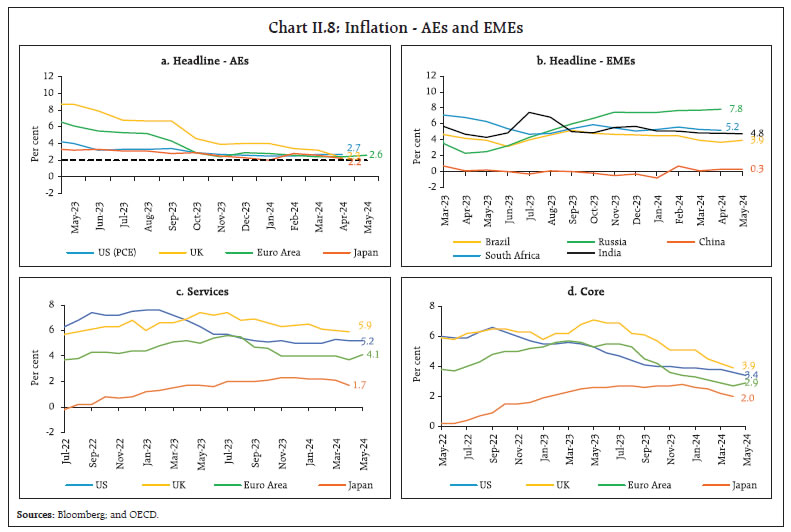 Global equity markets rallied in May, with the Morgan Stanley Capital International (MSCI) world index rising by 3.8 per cent amid somewhat easing geopolitical tensions and optimism on imminent rate cuts in the US following other AEs (Chart II.9a). The markets continued to gain through early June pricing in cooler than expected US inflation data and the US Fed policy announcement. Equity markets in EMEs, however, witnessed corrections in the last week of May over political developments across geographies, but they partly recouped in early June. The US government securities (G-secs) yields – both 10-year and 2-year – softened by 18 bps and 16 bps, respectively, in May as financial markets accounted for the release of PCE inflation data on expected lines (Chart II.9b). The yields, however, exhibited volatility in June tracking incoming data. In the currency markets, the US dollar lost some strength after being lifted by stronger than expected non-farm payrolls in May, due to increased bets over the rate cuts by the Fed. The MSCI currency index for EMEs witnessed some moderation in the second half of May, exacerbated by increased capital outflows from the EMEs, mainly in the equity segment (Chart II.9c and II.9d). 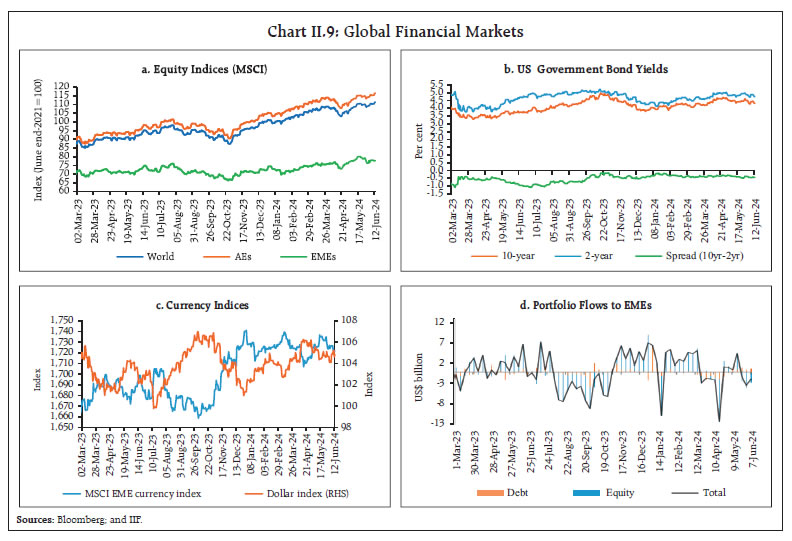 Select AEs and EMEs reduced their benchmark rates in their latest meetings as indications of a durable disinflation started to emerge. The Governing Council of the ECB decided to lower the three key interest rates by 25 bps each in its June meeting as the outlook for inflation improved markedly since September 2023. Canada cut its policy rate by 25 bps in June to boost growth as inflation receded, reiterating that monetary policy need not be overly restrictive. The Czech Republic and Sweden also lowered their policy rates by 50 bps and 25 bps, respectively, in their May meetings (Chart II.10a). The US Federal Reserve, on the other hand, maintained the federal funds rate steady at 5.25-5.50 per cent in its June meeting. Amongst EME central banks, Chile and Hungary cut their benchmark rates by 50 bps each in their May meetings, while Brazil and Peru reduced the policy rates by 25 bps each in their May meetings (Chart II.10b). Most other central banks retained their restrictive policy stances in the pending last mile of disinflation. 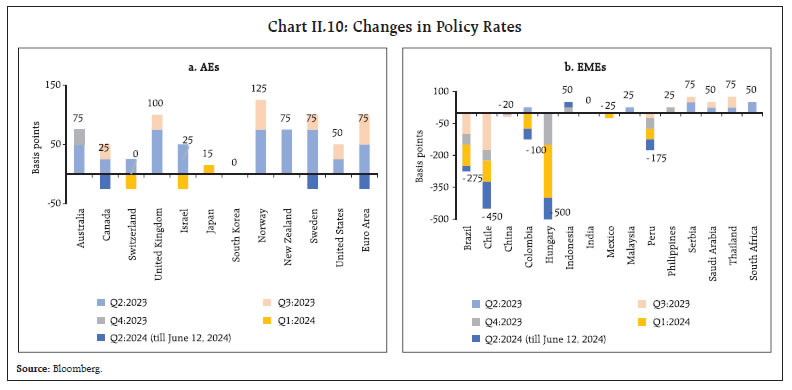 III. Domestic Developments The Indian economy turned in a solid macroeconomic performance in the face of geopolitical headwinds and the build-up of supply chain pressures (Chart III.1a). The May 2024 round of the urban consumer confidence survey points towards sustained optimism even though perceptions on the current situation recorded a sequential moderation (Chart III.1b). According to the economic activity index (EAI), GDP growth in Q1:2024-25 is likely to remain close to 7.4 per cent (Chart III.1c and Chart III.1d). Projections from the in-house dynamic stochastic general equilibrium (DSGE) model suggest that GDP growth may reach 7.6 per cent (y-o-y) and headline CPI inflation may moderate to 4.4 per cent (y-o-y) during 2024-25 (Table III.1 and Chart III.2).7 During 2025-26, GDP is projected to grow at 6.4 per cent while headline CPI inflation may moderate further to 4 per cent. | Table III.1: Baseline Projections | | (y-o-y in per cent) | | Periods | GDP Growth | CPI Inflation | | Q2: 2024-25 | 7.4 | 4.5 | | Q3: 2024-25 | 8.4 | 4.3 | | Q4: 2024-25 | 6.8 | 4.0 | | FY 2024-25 | 7.6 | 4.4 | | Q1: 2025-26 | 6.5 | 3.9 | | Q2: 2025-26 | 6.5 | 4.0 | | Q3: 2025-26 | 6.4 | 4.0 | | Q4: 2025-26 | 6.3 | 4.1 | | FY 2025-26 | 6.4 | 4.0 |
Aggregate Demand According to the provisional estimates (PE) of national income released on May 31, 2024 India's real gross domestic product (GDP) registered a growth of 8.2 per cent for 2023-24 as compared with 7 per cent a year ago. GDP growth has been revised upwards by 0.6 percentage points from the second advance estimates (SAE). The higher revised growth is primarily due to an upward revision in the growth of private final consumption expenditure (PFCE) and exports. Government final consumption expenditure (GFCE) and gross fixed capital formation (GFCF), however, have been revised downwards in the PE as compared with the SAE. 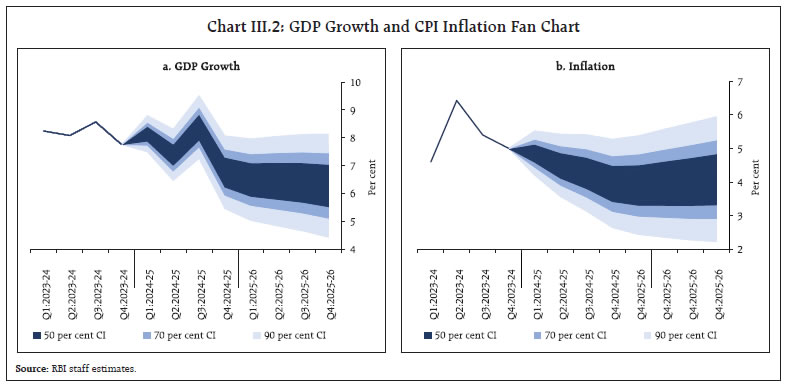 Turning to the quarterly growth trajectory, the Indian economy expanded at 7.8 per cent in Q4:2023-24 as compared with 8.6 per cent in Q3:2023-24. GDP growth in Q4:2023-24 is estimated to be higher by 190 bps than the implicit growth rate of 5.9 per cent in the SAE (Chart III.3). PFCE growth remained resilient at 4.0 per cent during Q4:2023-24 after accelerating in Q3. GFCE grew marginally at 0.9 per cent in Q4:2023-24 following a contraction in the previous quarter. With construction activity moderating in Q4:2023-24, fixed investment growth decelerated to 6.5 per cent from 9.7 per cent in the preceding quarter. Exports and imports grew robustly at 8.1 per cent and 8.3 per cent, respectively. This led to net exports contributing positively to GDP growth in Q4:2023-24 after remaining in contraction in the preceding three quarters. High frequency indicators point towards sustained momentum in domestic demand conditions during Q1:2024-25. E-way bills grew by 17 per cent (y-o-y) in May 2024, with sequential growth in both inter- and intra-state E-way (Chart III.4a). Toll collections increased by 8.7 per cent (y-o-y) in May 2024 (Chart III.4b). Automobile sales recorded a growth of 9.3 per cent (y-o-y) in May 2024, led by passenger vehicles segment as well as two-and-three wheelers, even as growth for entry level vehicles continued to remain weak (Chart III.5a). Domestic tractor sales increased to a seven-month high in May 2024 as the timely arrival of the southwest monsoon (SWM) and the onset of the kharif season sowing buoyed farmer sentiments (Chart III.5b). Vehicle registrations moderated in May 2024, mainly in the non-transport vehicles segment as extreme heat reduced walk-ins and registrations (Chart III.5c). Within petroleum consumption, sales of diesel, used mainly in commercial vehicles including trucks, and motor spirit (petrol), recorded a series high (beginning April 1998) indicating strong transport activity (Chart III.5d). 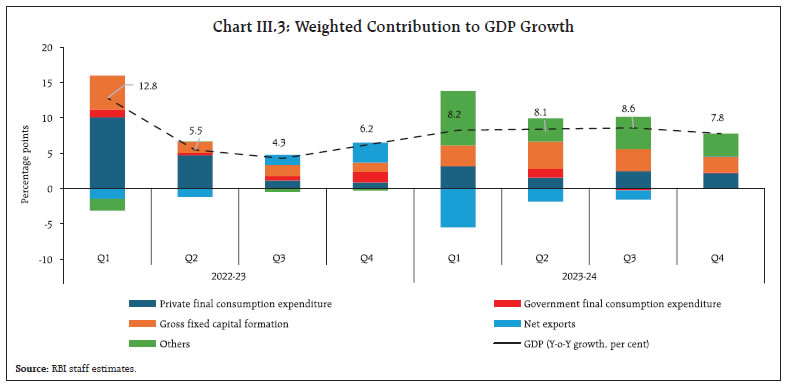 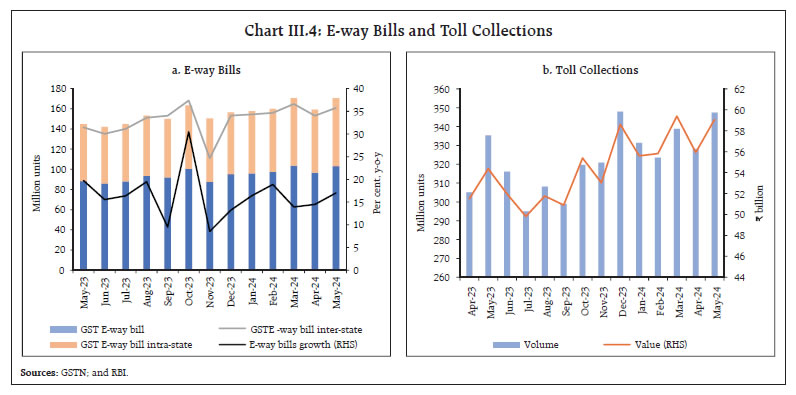 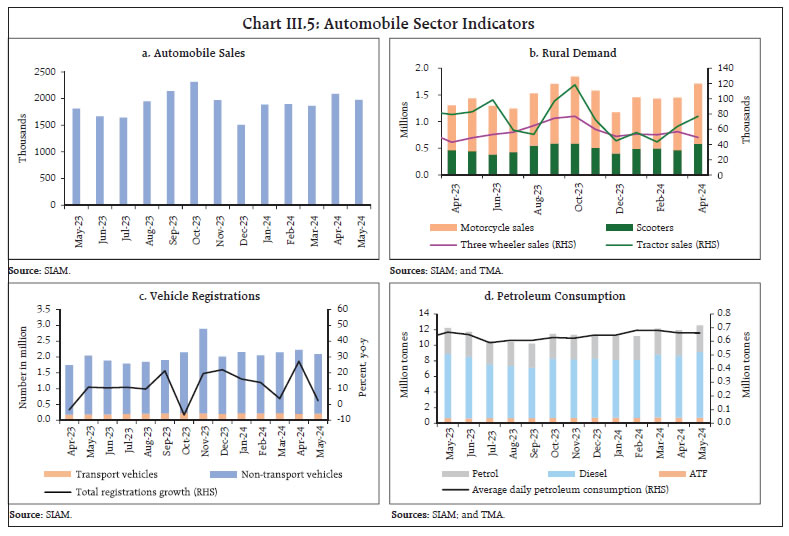 Renewable energy accounted for 71 per cent of total power generation capacity added in 2023-24. This surge in renewables pulled the share of coal and lignite below 50 per cent of India's total installed capacity in April 2024 (Chart III.6a). Some recent initiatives towards clean energy augur well for India's climate action performance going forward. Bids for 47.5 GW of renewable energy were issued in 2023-24, three times the amount typically added annually in the last three years.8 In the rooftop solar segment, around 14.3 lakh applications were received under PM Surya Ghar Yojana (PMSGY) scheme till June 06, 20249 to provide further boost to renewables' capacity addition (Chart III.6b). Under the National Green Hydrogen Mission, the government has allocated tenders to incentivise the production of 4.12 lakh tonnes of green hydrogen annually. Additionally, tenders have been issued to develop an electrolyser manufacturing capacity of 1,500 MW per year to bolster India's hydrogen generation capacity. Public preferences for clean transportation showed healthy momentum as evident from growth in EV and hybrid registrations in 2024 (1 Jan - 14 June), driven by two and three-wheeler segments. Total EV registrations are likely to surpass 1 million by the end of June 2024, almost equivalent to the entire year number for 2022 (Chart III.6c). As per the data from the Centre for Monitoring Indian Economy (CMIE), the all-India unemployment rate (UR) declined to a 20-month low of 7 per cent, driven by lower UR in rural areas (Chart III.7a). The labour participation rate (LPR) recorded a marginal decline while the employment rate (ER) increased vis-à-vis the preceding month, leading to the lower unemployment rate (Chart III.7b). In May 2024, organised manufacturing employment recorded the fastest expansion in 18 months, driven by new orders and favourable demand expectations as captured by the PMI employment outlook. Services job creation expanded to its strongest since August 2022, led by robust increase in new business segment (Chart III.8). The household work demand under the Mahatma Gandhi National Rural Employment Guarantee Act (MGNREGA) witnessed an increase of 26.4 per cent (m-o-m) in May, reflecting the seasonal pattern in agricultural production (Chart III.9). MGNREGA employment, however, declined by 14.3 per cent on a y-o-y basis in May 2024. India's merchandise exports at US$ 38.1 billion grew by 9.1 per cent (y-o-y) in May 2024, which was higher than the growth of 1.1 per cent in April (Chart III.10). Merchandise exports registered a broad-based expansion as 20 out of 30 major commodities (accounting for 80.8 per cent of the export basket) registered expansion on a y-o-y basis. Petroleum products, engineering goods, electronic goods, drugs and pharmaceuticals, and readymade garments supported export growth, while spices, other cereals, gems and jewellery, oil meals and marine products dragged it down in May (Chart III.11). Merchandise imports at US$ 61.9 billion expanded by 7.7 per cent (y-o-y) in May, driven by a positive momentum (Chart III.12). Among the 30 major commodities, 16 commodities (accounting for 69.6 per cent of the import basket) registered growth on a y-o-y basis. Petroleum, crude and products, transport equipment, electronic goods, vegetable oils and pulses contributed to import growth, while coal, gold, fertilisers, iron and steel, and chemical material and products were the main drags in May (Chart III.13). The merchandise trade deficit widened to a 7-month high of US$ 23.8 billion in May 2024, up from US$ 19.1 billion a month ago. The oil deficit reached an all-time high of US$ 13.2 billion in May, with its share in the total deficit rising to 55.4 per cent (Chart III.14). Petroleum products were the largest source of the trade deficit in 2024-25 so far (April-May), followed by electronic goods (Chart III.15). In April 2024, services exports increased by 17.7 per cent (y-o-y) to US$ 30.3 billion, while services imports rose by 19.1 per cent (y-o-y) to US$ 16.6 billion (Chart III.16). As a result, net services export earnings grew at 15.9 per cent (y-o-y) to US$ 13.7 billion in April 2024. 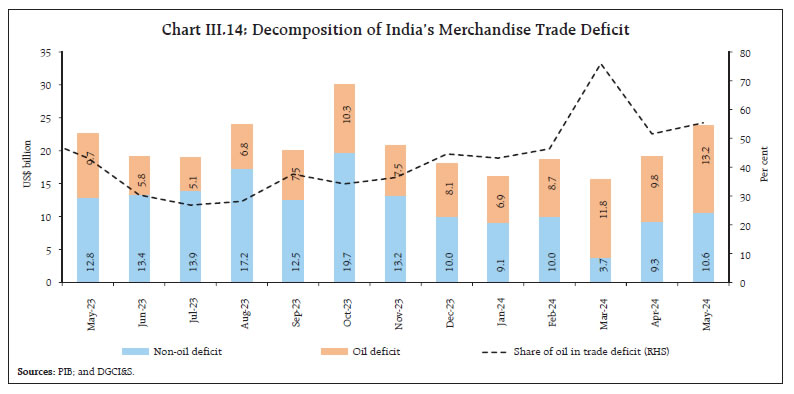 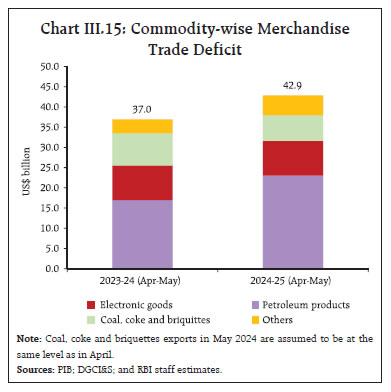 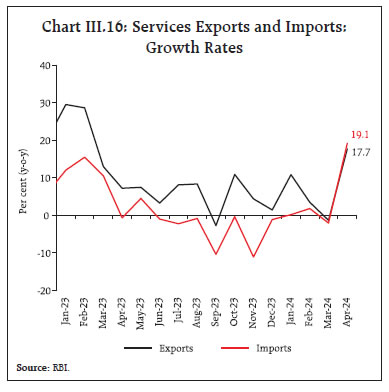 The key deficit indicators, viz., gross fiscal deficit (GFD), revenue deficit (RD) and primary deficit (PD) of the Union Government showed an improvement in 2023-24 as per the provisional accounts (PA) vis-à-vis the revised estimates (RE). This improvement was brought about by broad-based growth in revenue receipts and a slowdown in the growth of revenue expenditure in PA over RE of 2023-24 (Table III.2). Additionally, the upward revision in GDP as per the provisional estimates (PE) vis-à-vis the second advance estimates (SAE) for 2023-24 also contributed towards the improvement in the GFD-GDP ratio in 2023-24 (PA). Accordingly, the GFD was placed at 5.6 per cent of GDP in 2023-24 (PA) as against 5.9 per cent of GDP as per the 2023-24 (RE). | Table III.2: Key Indicators of the Union Government (as a per cent of GDP) | | | 2022-23 | 2023-24 | 2024-25 | | | Actuals | BE | RE | PA | BE | | 1 | 2 | 3 | 4 | 5 | 6 | | 1. Fiscal Deficit | 6.45 | 5.92 | 5.90 | 5.60 | 5.14 | | 2. Revenue Deficit | 3.97 | 2.88 | 2.86 | 2.59 | 1.99 | | 3. Primary Deficit | 3.00 | 2.34 | 2.31 | 2.00 | 1.51 | | 4. Gross Tax Revenue | 11.33 | 11.14 | 11.70 | 11.73 | 11.69 | | 5. Non-Tax Revenue | 1.06 | 1.00 | 1.28 | 1.36 | 1.22 | | 6. Revenue Expenditure | 12.81 | 11.61 | 12.05 | 11.83 | 11.15 | | 7. Capital Expenditure | 2.75 | 3.32 | 3.23 | 3.21 | 3.39 | | (i) Capital Outlay | 2.32 | 2.77 | 2.75 | 2.67 | 2.87 | Notes: 1. GDP used for 2023-24(BE) and 2024-25(BE) is as per Union Budget 2023-24 and 2024-25, respectively.
2. For 2023-24 (RE) the GDP is as per Second Advance Estimates (SAE) released by NSO on February 29, 2024. For 2023-24 (PA) the GDP used is the Provisional Estimates (PE) released by NSO on May 31, 2024.
Sources: Union Budget Documents; and Controller General of Accounts (CGA). | 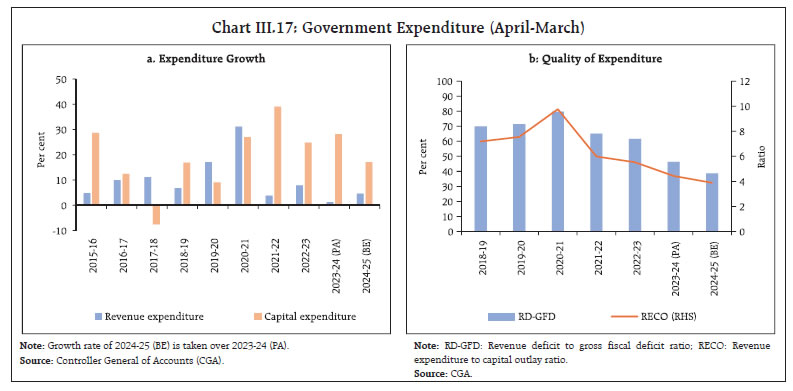 On the expenditure side, the y-o-y growth of the total expenditure slowed down to 5.9 per cent in 2023-24 (PA). While revenue expenditure growth was restricted to 1.2 per cent, the thrust on capital expenditure continued (Chart III.17a). Capital outlay (viz., capital expenditure less loans and advances) continued to record steady improvement, underscoring the Government's emphasis on strengthening medium to long term growth. Consequently, the ratio of revenue expenditure to capital outlay (RECO) and RD-GFD have been trending down, which serve as indicators of improvement in the quality of Government expenditure (Chart III.17b). Similarly, on the receipts front, the revenue receipts witnessed a y-o-y growth of 14.5 per cent in 2023-24 (PA), led by healthy growth in net tax revenue and non-tax revenue at 10.9 per cent and 40.8 per cent, respectively. During April 2024, the major deficit indicators such as GFD, RD and PD as per cent of their respective budget estimates recorded an increase over the corresponding month of the previous year. On the receipts side, gross tax revenue was higher than a year ago, with direct taxes and indirect taxes growing by 14.1 per cent and 20.3 per cent, respectively. Similarly, non-debt capital receipts and non-tax revenue recorded a y-o-y expansion of 62.1 per cent and 149.1 per cent, respectively. Conversely, total expenditure growth during April 2024 was higher than in the previous year, attributable to a growth in revenue expenditure and capital expenditure by 43.7 per cent and 26.5 per cent, respectively. The gross GST collection (Centre plus States) grew by 9.96 per cent (y-o-y) to ₹1.73 lakh crore in May 2024, mainly driven by a robust increase in the domestic transactions. Attributable to a consistently strong performance, the gross GST collection during April-May 2024-25 (₹3.83 lakh crore) posted a growth of 11.3 per cent over the corresponding period of 2023-24 (Chart III.18). As per the PA, the consolidated GFD of States and UTs was 3.0 per cent of GDP in 2023-24, aligning with the fiscal responsibility legislation limit. It, however, increased marginally from a year ago, primarily driven by higher capital expenditure. Within revenue receipts, lower grants from the Union government on account of cessation of GST compensation and the tapering of finance commission grants outweighed increase in tax and non-tax revenues. On the other hand, States' revenue expenditure declined in 2023-24 (PA), while capital expenditure rose to 2.9 per cent (y-o-y) of GDP, aided by the 'Scheme for Special Assistance to States for Capital Investment'. The States' combined GFD-GSDP ratio for 2024-25 is budgeted at 3.0 per cent, unchanged from the level in 2023-24 (PA) [Table III.3]. 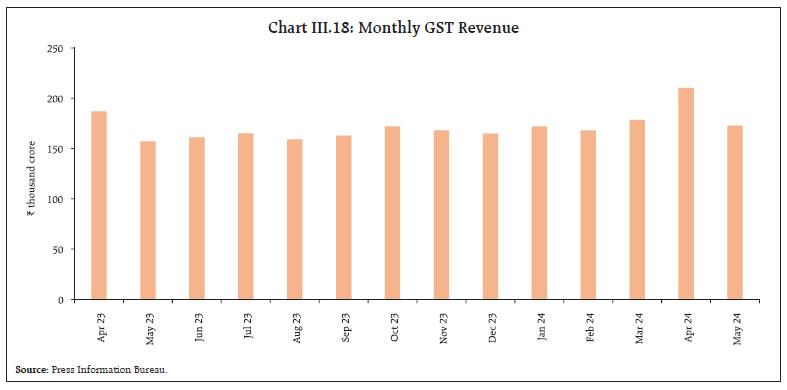
| Table III.3: States' Key Fiscal Indicators | | (Per cent of GDP/GSDP) | | Indicator | 2022-23 | 2023-24 | 2024-25 | | Actuals | BE | RE | PA | BE | | Revenue Receipts | 13.6 | 14.3 | 13.8 | 13.4 | 13.5 | | Tax Revenue | 10.1 | 10.4 | 10.4 | 10.4 | 10.5 | | Non-Tax Revenue | 1.0 | 1.2 | 1.1 | 1.1 | 1.1 | | Grants | 2.5 | 2.7 | 2.3 | 1.9 | 1.9 | | Revenue Expenditure | 13.8 | 14.4 | 14.3 | 13.6 | 13.7 | | Capital Expenditure | 2.5 | 3.2 | 3.0 | 2.9 | 2.9 | | Of which: | | | | | | | Capital Outlay | 2.2 | 2.9 | 2.7 | 2.6 | 2.6 | | Revenue Deficit | 0.2 | 0.1 | 0.5 | 0.2 | 0.2 | | Gross Fiscal Deficit | 2.7 | 3.1 | 3.3 | 3.0 | 3.0 | | Primary Deficit | 1.0 | 1.4 | 1.6 | 1.4 | 1.3 | Note: Data for 2022-23, 2023-24 (BE) and 2023-24(PA) pertain to 31 States/ UTs and for 2023-24 (RE) and 2024-25 (BE) pertain to 27 States/UTs. Data for 2023-24 (RE) and 2024-25(BE) is taken as a per cent of GSDP.
Sources: Budget documents of the States; and Comptroller and Auditor General of India. | Rising capital expenditure and lower revenue spending have improved the quality of the States' expenditure over the past few years, as reflected in lower revenue expenditure to capital outlay (RECO) ratio and higher share of capital outlay in total expenditure (COTE) [Chart III.19]. Aggregate Supply Aggregate supply, measured by GVA at basic prices, expanded by 7.2 per cent in 2023-24 as per the PE, as compared with a growth of 6.7 per cent in the preceding year. GVA growth was revised upwards by 30 bps from 6.9 per cent in the SAE. In Q4:2023-24, real GVA growth stood at 6.3 per cent, substantially higher than the implicit growth rate of 5.4 per cent in the SAE. However, it shed momentum on the back of deceleration in the industrial and the services sectors (Chart III.20). Agriculture exhibited a modest pick-up in growth to 0.6 per cent from 0.4 per cent in Q3:2023-24. Manufacturing GVA growth moderated, owing to inching up of input costs which dented profitability of listed manufacturing companies. The real GVA growth of the unorganised manufacturing sector, however, entered positive territory after remaining in contraction during the previous three quarters. While growth of the mining and quarrying sectors slowed sequentially, it remained stronger than in Q4:2022-23 supported by robust production of coal and natural gas. Growth in electricity, gas, water supply, and other utility services remained resilient at 7.7 per cent. The services sector grew by 7.0 per cent, with financial, real estate and professional services recording an acceleration over the previous quarter, backed by upbeat credit and deposit growth and an improvement in the performance of information technology (IT) companies. Public administration, defence, and other services (PADO) recorded an expansion due to an uptick in government expenditure and a recovery in other services. Construction activity continued to expand, albeit with some moderation. However, the growth in trade, hotels, transport, communication, and services related to broadcasting moderated both on a sequential and y-o-y basis. 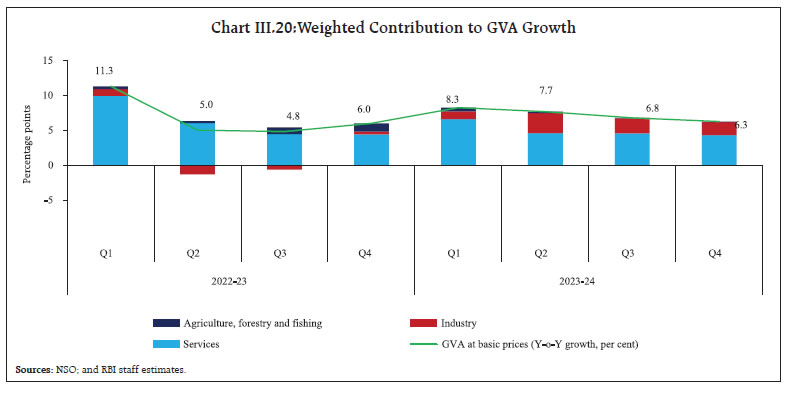 The third advance estimates (AE) of agricultural crop production placed foodgrains output during 2023-24 at 328.9 million tonnes, marginally lower (-0.3 per cent) than the final estimates of 2022-23 (Chart III.21). This positively reflects upon the increased resilience of foodgrains production to weather conditions despite a below normal and erratic monsoon in the El Nino year. While production of wheat and rice increased, it was offset by a decline in the production of pulses and coarse cereals. The production of pulses was 6 per cent lower than in the previous year, mainly attributable to a decline in area under the crop. Commercial crops recorded a fall in production across all crops, notably sugarcane, which declined by 9.8 per cent in 2023-24 from a record production in the previous year. Oilseeds production also declined by 4.3 per cent, mainly contributed by a fall in the production of soybean (-12.9 per cent). 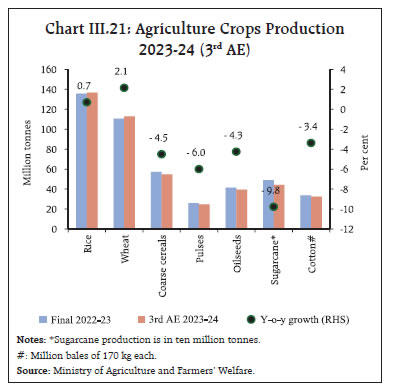 Horticulture crops recorded a decline in production in 2023-24 for the first time since 2002-03. As per the 2nd AE, the production of horticultural crops during 2023-24 is estimated to have declined by 0.9 per cent compared to the final estimates of 2022-23, led by lower production of onion (-19.8 per cent) and potato (-5.6 per cent) [Chart III.22]. Production of fruits, on the other hand, increased by 2.2 per cent over 2022-23. The overall yield of the horticulture crops declined by 1.6 per cent in 2023-24 over 2022-23, whereas the overall area is estimated to have increased by 0.7 per cent. 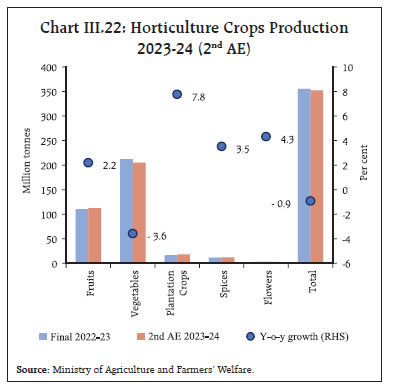 The IMD, has forecasted above normal SWM with 61 per cent probability for the rainfall to be above normal,10 for the first time in the last eight years. The IMD also expects rain-favouring La Niña conditions and positive Indian Ocean Dipole (IOD) conditions to develop during the monsoon season. The spatial distribution of rainfall suggests that rainfall is most likely to be above normal over central India and the southern peninsula, normal over northwest and below normal over northeast India. The rainfall over the monsoon core zone (MCZ), consisting of most of the rainfed agriculture areas in the country, is expected to be above normal. The forecast of above normal SWM is expected to augur well for the upcoming kharif sowing. As of June 15, 2024, the SWM has already entered central India and the cumulative rainfall (since June 01, 2024) stood at 16 per cent below the long period average (LPA) as against 51 per cent below LPA during the corresponding period of the previous year. The reservoir levels continue to be below the decadal average. The water storage level in major reservoirs in the country stood at 22 per cent of total reservoir capacity (Chart III.23). Despite a sequential moderation, the headline PMI for manufacturing remained in expansion in May 2024 (Chart III.24a). Future output expanded to among its highest level in nearly nine-and-a-half years, reaching 67.4 in May on favourable demand conditions and innovation. The PMI for services also continued to expand albeit at a slower pace, driven by growth in new business. (Chart III.24b). Indicators of freight transport accelerated in May 2024. Cargo traffic at major ports increased by 3.7 per cent led by cargoes of coal and petroleum, oil and lubricants (POL) [Chart III.25a]. Railway freight traffic also increased led by a surge in coal traffic (Chart III.25b). The construction sector emitted mixed signals, with steel consumption posting 11.6 per cent growth in May 2024, while cement production growth remained muted at 0.6 per cent in April 2024 (Chart III.26). Available high frequency indicators for the services sector recorded expansion in May 2024 indicating sustained momentum in economic activity (Table III.4). Inflation Headline inflation, as measured by y-o-y changes in the all-India CPI11, softened to 4.7 per cent in May 2024 – the lowest in the last 12 months – from 4.8 per cent in April (Chart III.27). This 8 bps softening in inflation came from a favourable base effect of 56 bps more than offsetting a positive momentum of 48 bps on account of an m-o-m increase of 68 bps in food, 80 bps in fuel and 24 bps in the core group (i.e., excluding food and fuel). Food inflation (y-o-y) remained unchanged at 7.9 per cent in May. In terms of sub-groups, inflation edged up in respect of cereals, egg, fruits and pulses while meat and fish, milk, sugar, spices, non-alcoholic beverages and prepared meals witnessed a moderation in inflation. Vegetable prices recorded a double digit y-o-y inflation for the seventh consecutive month. Edible oils remained in deflation, albeit at a slower rate than a month ago (Chart III.28). Fuel deflation narrowed to (-)3.8 per cent in May from (-)4.0 per cent in April, mainly due to an increase in inflation in kerosene prices under the public distribution system (PDS). Inflation in terms of electricity prices remained elevated in double digits while LPG prices continued to record double digit deflation. Core inflation eased further to 3.0 per cent in May from 3.2 per cent in April, the lowest in the current CPI (2012=100) series, with 7 out of 9 sub-groups registered a softening. Inflation in pan, tobacco and intoxicants remained unchanged while that in personal care and effects recorded a marginal increase (Chart III.29). In terms of regional distribution, rural inflation at 5.3 per cent was higher than urban inflation (4.2 per cent) in May 2024. Majority of the states faced inflation less than 6 per cent (Chart III.30). High frequency food price data for June so far (up to 12th) show that cereal prices recorded increases, mainly in respect of rice and wheat. Pulses prices registered a broad-based increase and edible oil prices also picked up due to rising mustard oil prices. Amongst key vegetables, tomato, onion and potato prices recorded further increases in June (Chart III.31). Retail selling prices of petrol and diesel in the four major metros remained steady in June so far (up to 12th). While kerosene prices registered a decline in line with moderation in international prices, LPG prices were kept unchanged (Table III.5). The PMIs for May 2024 indicated an uptick in input costs across manufacturing and service sector firms. Output prices also picked up pace in both manufacturing and services (Chart III.32). During Q4:2023-24, the all-India house price index (HPI)12 increased by 4.1 per cent (y-o-y), up from 3.8 per cent in the previous quarter, but lower than 4.6 per cent recorded a year ago (Chart III.33). In the May 2024 round of the Reserve Bank's inflation expectations survey of households (IESH), their current inflation perceptions moderated by 10 bps to 8.0 per cent. Their three-months and one-year ahead inflation expectations, however, increased by 20 bps and 10 bps, respectively (Chart III.34). | Table III.5: Petroleum Products Prices | | Item | Unit | Domestic Prices | Month-over-month (per cent) | | Jun-23 | May-24 | Jun-24^ | May-24 | Jun-24^ | | Petrol | ₹/litre | 102.92 | 100.91 | 100.91 | 0.0 | 0.0 | | Diesel | ₹/litre | 92.72 | 90.72 | 90.72 | 0.0 | 0.0 | | Kerosene (subsidised) | ₹/litre | 44.12 | 50.03 | 46.61 | 0.9 | -6.0 | | LPG (non-subsidised) | ₹/cylinder | 1113.25 | 813.25 | 813.25 | 0.0 | 0.0 | ^: For the period June 1-12, 2024.
Note: Other than kerosene, prices represent the average Indian Oil Corporation Limited (IOCL) prices in four major metros (Delhi, Kolkata, Mumbai and Chennai). For kerosene, prices denote the average of the subsidised prices in Kolkata, Mumbai and Chennai.
Sources: IOCL; Petroleum Planning and Analysis Cell (PPAC); and RBI staff estimates. |
IV. Financial Conditions System liquidity remained in deficit during late April and May on account of the build-up in government cash balances due to advance tax payments and goods and services tax (GST) related outflows, sluggish government spending and higher currency outgo. It turned surplus from June 2, 2024 with the usual drawdown in government cash balances at the month end. Reflecting these shifts, the average daily net injection under the liquidity adjustment facility (LAF) averaged ₹0.76 lakh crore during May 16 to June 12, 2024 as against average daily net injection of ₹0.80 lakh crore during April 16 – May 15, 2024 (Chart IV.1). The Reserve Bank injected liquidity into the banking system during May 16 to June 12, 2024 through two main variable rate repo (VRR) operations and four fine-tuning VRR operations of 2 to 4 days maturity, cumulatively amounting to ₹5.72 lakh crore. The demand for funds was robust as reflected in the high bid-cover ratios in main and fine-tuning VRR operations. As liquidity conditions turned into surplus in early June, the Reserve Bank conducted two variable rate reverse repo (VRRR) auctions of 3 days maturity each on June 4, 2024 cumulatively absorbing ₹0.44 lakh crore. 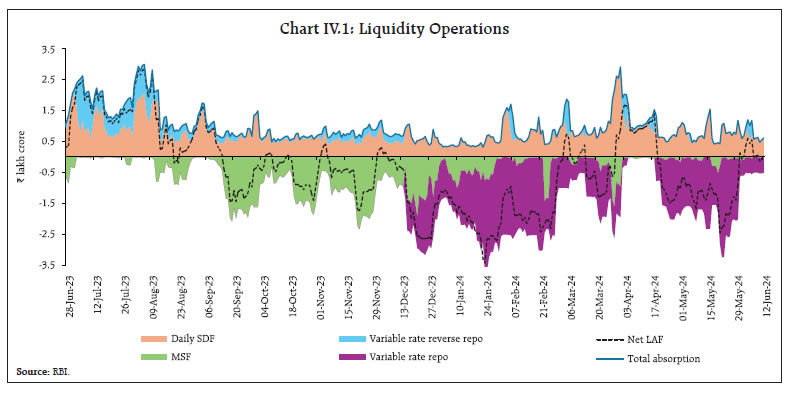 Borrowings under the marginal standing facility (MSF) increased to a daily average of ₹10,001 crore during May 16 to June 12, 2024 amidst tight liquidity conditions as compared with ₹5,850 crore during April 16 to May 15, 2024. Of the average total absorption at ₹0.77 lakh crore during May 16 to June 12, 2024, the placement of funds under the standing deposit facility (SDF) constituted 94 per cent as compared with 92 per cent of the average total absorption during April 16 to May 15, 2024. The remaining amount was mopped up through fine-tuning VRRR operations conducted on June 4, 2024. Reflecting the liquidity dynamics, the weighted average call rate (WACR) – the operating target of monetary policy – broadly remained within the LAF corridor and averaged 6.57 per cent during May 16 to June 12, 2024 almost the same as during April 16 - May 15, 2024 (Chart IV.2a). In the last week of May and early June, liquidity conditions eased which softened the WACR considerably except on May 31 on account of banks borrowing heavily for cash reserve ratio (CRR) maintenance at the beginning of the reserve maintenance cycle. Rates in the collateralised segment – the triparty and market repo – moved in tandem with the WACR. On an average basis, the triparty repo traded 2 basis point (bps) below the policy rate and the market repo rate traded at the policy repo rate during May 16 to June 12, 2024 (Chart IV.2b). 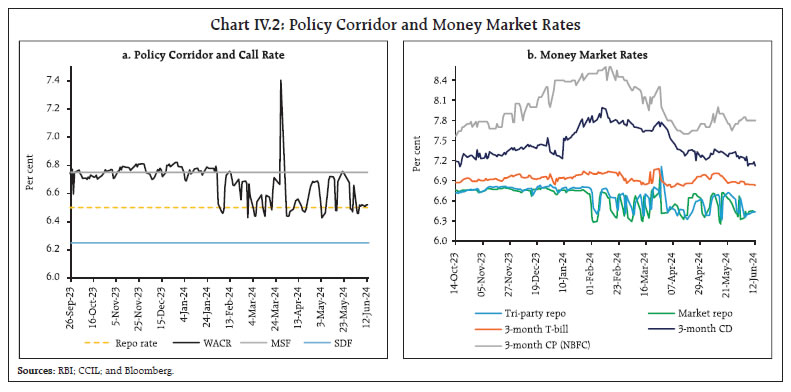 Across the term money market segment, yields on 3-month treasury bills (T-bills) and rates on certificates of deposit (CDs) eased while rates on commercial paper (CP) for non-banking financial companies (NBFCs) hardened during May 16 to June 12, 2024. The yield on the 3-month T-bill softened in response to the announcement of reduced supply of shorter-dated T-bills for Q1:2024-25 on May 17, 2024. Reflecting this, the average risk premia in the money market (3-month CP minus 91-day T-bill) increased to 92 bps during May 16 – June 12, 2024 from 79 bps during April 16 – May 15, 2024. Financial conditions, however, remained congenial, with the term spread (10 year G-sec minus 91 day T-bills) narrowing to 14 bps from 18 bps during April 16 - May 15, 2024. In the primary market, fund mobilisation through issuances of CDs gained momentum in May, following a slack in April. Banks issued CDs worth ₹1.25 lakh crore during 2024-25 (up to May 31), higher than ₹0.95 lakh crore in the corresponding period of the previous year (Chart IV.3). On the other hand, issuances of CPs at ₹2.18 lakh crore during 2024-25 (up to May 31) stood lower than ₹2.29 lakh crore in the corresponding period of the previous year. 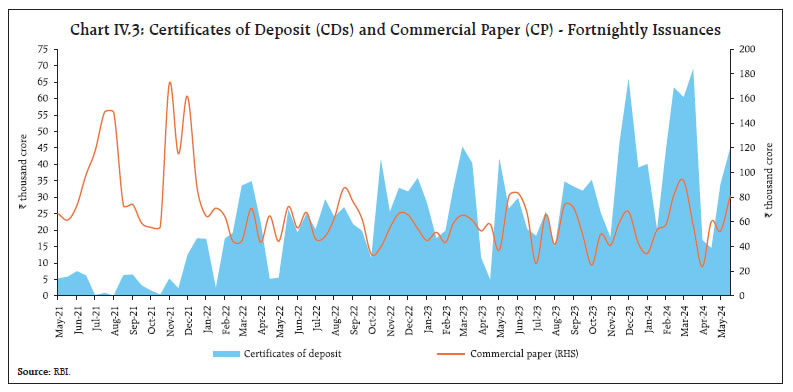 The yield on the 10-year Indian benchmark (7.10 GS 2034) G-sec softened to 7.01 per cent on June 12 from 7.03 per cent on May 15 due to a decline in crude oil prices, larger-than-expected dividend transfer by the Reserve Bank for 2023-2413 giving additional fiscal space to the government, positive sentiment on the inclusion of Indian G-sec in global bond indices in June and a stable rupee. The benchmark 10-year bond yield eased further on India's sovereign rating outlook upgrade by S&P Global Ratings for to 'positive' from 'stable' (Chart IV.4a). Yields softened across the term structure, barring around the 10-year maturity (Chart IV.4b).  The Government of India announced five buyback auctions for an aggregate amount of ₹2.3 lakh crore during May and early June 2024. The buyback offers were announced in the backdrop of the government's improved cash position and with an aim to retire some of its debt ahead of schedule in a bid to proactively manage debt. The response, however, to the buyback offers has been tepid. The Reserve Bank of India accepted offers aggregating ₹0.3 lakh crore against the notified amount of ₹2.3 lakh crore. Buybacks are part of an active debt consolidation strategy that have a liquidity impact but should not be construed as liquidity management operations. Corporate bond yields softened while risk premia hardened across diverse maturity profiles and ratings during May 16 to June 12, 2024 (Table IV.1). The yield on 5-year AAA rated corporate bond softened, tracking the movement in the 5-year G-Sec yield. Reserve money (RM), excluding the first-round impact of change in the CRR, recorded a growth of 7.5 per cent (y-o-y) as on June 7, 2024 (6.8 per cent a year ago) [Chart IV.5]. The growth in currency in circulation (CiC), the largest component of RM, increased to 5.2 per cent (y-o-y) as on June 7, 2024 from 3.0 per cent on May 17, 2024, on account of the base effect of the withdrawal of ₹2000 banknotes14 – 97.82 per cent has been returned to the banking system mostly in the form of deposits (as on May 31, 2024). | Table IV.1: Financial Markets - Rates and Spread | | Instrument | Interest Rates (per cent) | Spread (bps) (Over Corresponding Risk-free Rate) | | Apr 16, 2024 – May 15, 2024 | May 16, 2024 – June 12, 2024 | Variation | Apr 16, 2024 – May 15, 2024 | May 16, 2024 – June 12, 2024 | Variation | | 1 | 2 | 3 | (4 = 3-2) | 5 | 6 | (7 = 6-5) | | Corporate Bonds | | (i) AAA (1-year) | 7.82 | 7.86 | 4 | 65 | 72 | 7 | | (ii) AAA (3-year) | 7.99 | 7.91 | -8 | 71 | 75 | 4 | | (iii) AAA (5-year) | 7.91 | 7.82 | -9 | 61 | 65 | 4 | | (iv) AA (3-year) | 8.59 | 8.56 | -3 | 131 | 139 | 8 | | (v) BBB- (3-year) | 12.17 | 12.16 | -1 | 489 | 499 | 10 | Note: Yields and spreads are computed as averages for the respective periods.
Sources: FIMMDA; and Bloomberg. | 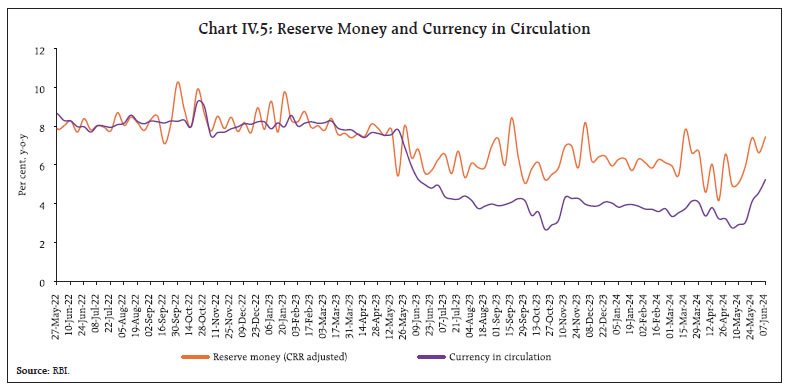 On the sources side (assets), RM comprises net domestic assets (NDA) and net foreign assets (NFA) of the Reserve Bank. While the growth in foreign currency assets (accounting for more than 90 per cent of NFA) which had been declining since March 2024, inched up during May 2024; gold, the other major component of NFA, has registered double digit growth since February 2024 (Chart IV.6). Money supply (M3) rose by 10.9 per cent (y-o-y) as on May 31, 2024 (10.5 per cent a year ago).15 Aggregate deposits with banks, the largest component of M3, increased by 11.7 per cent (11.2 per cent a year ago). Scheduled commercial banks' (SCBs') credit growth stood at 16.1 per cent as on May 31, 2024 (15.4 per cent a year ago) [Chart IV.7]. SCBs' deposit growth (excluding the impact of the merger), which recorded an increase in the wake of withdrawal of ₹2000 banknotes, remained in double digits in May 2024 (Chart IV.8). As on May 31, 2024 the system level incremental credit-deposit ratio stood at 90.8 per cent (Chart IV.9). With the statutory requirements for CRR and statutory liquidity ratio (SLR) at 4.5 per cent and 18.0 per cent, respectively, around 77 per cent of deposits were available with the banking system for credit expansion as on May 31, 2024. The deposit base was supplemented by CDs issuances. In Q4:2023-24, bank credit to the agricultural sector recorded the strongest y-o-y expansion since the pandemic. Robust credit growth was witnessed for industry during the past seven quarters, coupled with continued double digit bank credit growth in housing and non-housing personal loan segments. (Chart IV.10). Private corporate sector credit growth remained buoyant in H2:2023-24, possibly pointing towards capacity augmentation by the private sector (Chart IV.11a). Working capital loans have been decelerating since Q2:2022-23, indicating effective management of cash flows by the private corporates (Chart IV.11b). In response to the cumulative 250 bps hike in the policy repo rate since May 2022, banks have revised their repo-linked external benchmark-based lending rates (EBLRs) upward by the same magnitude. The 1-year median marginal cost of funds-based lending rate (MCLR) increased by 175 bps during May 2022 to May 2024. Consequently, the weighted average lending rate (WALR) on fresh rupee and outstanding rupee loans increased by 204 bps and 111 bps, respectively, during May 2022 to April 2024. The weighted average domestic term deposit rate (WADTDR) on fresh deposits and outstanding deposits increased by 245 bps and 188 bps, respectively, during the same period (Table IV.2). 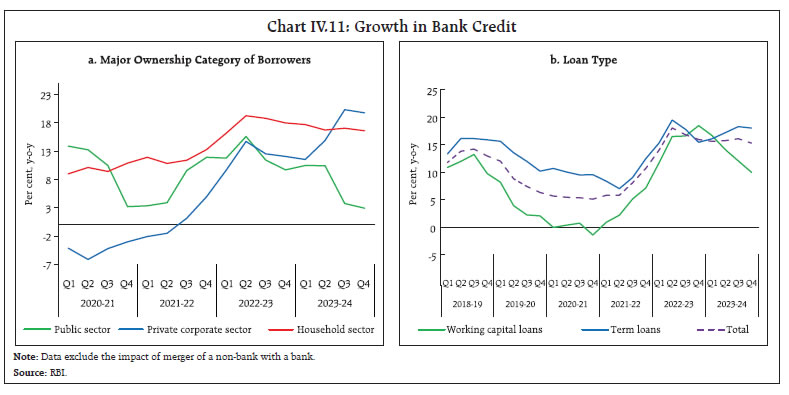
| Table IV.2: Transmission to Banks' Deposit and Lending | | (Variation in basis points) | | Period | Repo Rate | Term Deposit Rates | Lending Rates | | WADTDR - Fresh Deposits | WADTDR - Outstanding Deposits | EBLR | 1-Yr. MCLR (Median) | WALR - Fresh Rupee Loans | WALR - Outstanding Rupee Loans | Easing Phase
Feb 2019 to Mar 2022 | -250 | -259 | -188 | -250 | -155 | -232 | -150 | Tightening Period
May 2022 to Apr 2024 | +250 | 245 | 188 | 250* | 175* | 204 | 111 | Note: Data on EBLR pertain to 32 domestic banks.
*: Data on EBLR and MCLR pertain to May 2024.
WALR: Weighted Average Lending Rate. WADTDR: Weighted Average Domestic Term Deposit Rate;
MCLR: Marginal Cost of Funds-based Lending Rate; EBLR: External Benchmark based Lending Rate.
Source: RBI. | The pass-through to WALR on fresh rupee loans and WADTDR on fresh deposits was higher for public sector banks than private banks, while transmission to WALR on outstanding loans was higher for private banks (Chart IV.12). Reflecting transmission of policy rates to lending and deposit rates, the share of bank loans and deposits bearing higher interest rates has steadily increased between March 2022 and March 2024 (Chart IV.13). Also, there was some moderation in growth of savings deposits vis-à-vis other forms of deposits (Chart IV.14). Corporate leverage in manufacturing companies, as reflected in their debt-to-equity ratio16, continued to fall as companies capitalised their higher profits (Chart IV.15a). Even as the share of fixed assets in total assets remained broadly stable, outstanding fixed assets rose by 7.9 per cent (y-o-y) during H2:2023-24 (Chart IV.15b). Retained earnings continued to be a major source of funds for capital expenditure and for other non-current investments (Chart IV.15c and IV.15d). 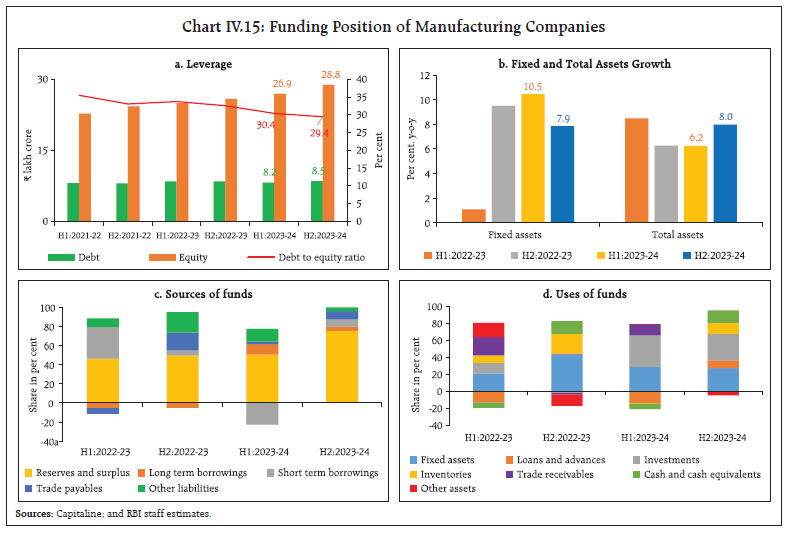 During May-June 2024 so far, Indian equity markets exhibited sharp oscillations. After registering losses in the first half of May 2024, markets advanced following the record dividend transfer by the Reserve Bank. Market capitalisation of Indian listed companies surpassed US$ 5 trillion for the first time. Thereafter, markets declined in the last week of May 2024 amidst weak global cues but began June 2024 on a positive note, scaling fresh peaks following the exit polls and better-than-expected Q4:2023-24 domestic GDP data. Markets, however, registered a sharp decline following the announcement of the outcome of Lok Sabha elections but recovered subsequently amidst growing expectations of policy stability as the new Government took charge (Chart IV.16). Overall, the benchmark BSE Sensex increased by 3.4 per cent since end-April 2024 to close at 76,693 on June 14, 2024. Market volatility in India, as captured by VIX, more than doubled to 26.8 on June 4, 2024 but eased subsequently to 12.82 on June 14, 2024. Mutual funds made net purchases of ₹60,048 crore in May-June 2024 so far as against net sales by foreign portfolio investors (FPIs) of ₹33,272 crore. Gross inward foreign direct investment (FDI) remained strong at US$ 7.3 billion in April 2024 (US$ 7.4 billion a year ago) [Chart IV.17a]. Manufacturing, financial services, business services, electricity and other energy, and computer services sectors accounted for more than 80 per cent of the FDI equity flows. Among the major source countries were Singapore, Mauritius, Cyprus, the US and the Netherlands, contributing more than 80 per cent of the flows. Net FDI (net inward FDI minus net outward FDI) improved to US$ 4.0 billion in April 2024 from US$ 2.8 billion a year ago, due to moderation in repatriation and outward FDI by India. 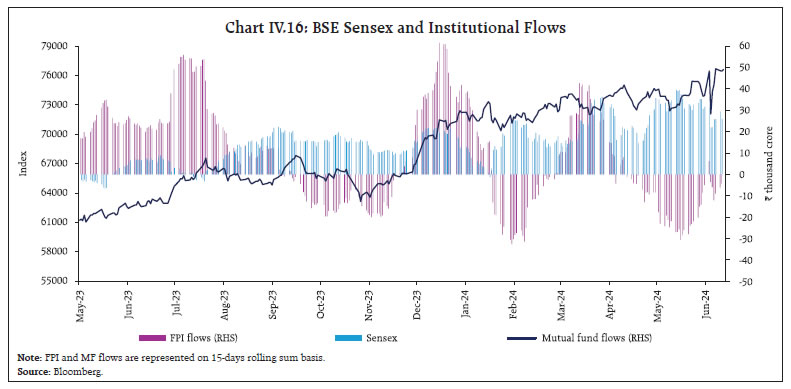 Global FDI flows are undergoing a structural shift, reshaped by forces of geopolitics, digitisation and green energy transition. As per fDi Intelligence17, around 16,427 greenfield FDI projects worth US$ 1.3 trillion were announced globally in 2023. India maintained its position as an attractive destination country within Asia-Pacific (APAC) in terms of the magnitude of FDI projects (a share of 24 per cent in APAC) and FDI capital investments (a share of 19 per cent in APAC) [Chart IV.17b]. Among industries, capital intensive sectors like renewables, batteries, communications and semiconductors dominated the FDI landscape in 2023. 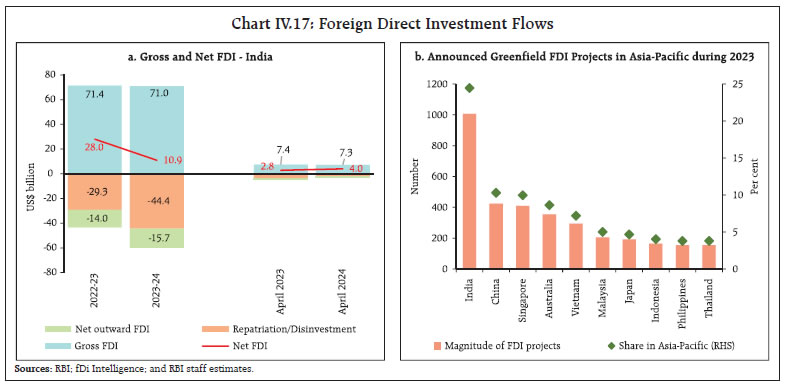 Foreign portfolio investments (FPI) in India remained negative for two consecutive months in May 2024. Net FPI outflows amounted to US$ 1.5 billion in May 2024, led by the equity segment (Chart IV.18a). Equities recorded net outflows of US$ 3.0 billion, in line with most EMEs. With net inflows of US$ 1.5 billion, however, the debt segment maintained its positive trajectory evident since April 2023, barring the month of April 2024. Within equities, financial services, information technology (IT), and oil, gas and consumable fuels recorded the highest outflows, while capital goods, consumer services and realty sectors received the highest inflows during May 2024 (Chart IV.18b). FPI flows turned positive with net inflows of US$ 0.4 billion in June 2024 (up to June 13). 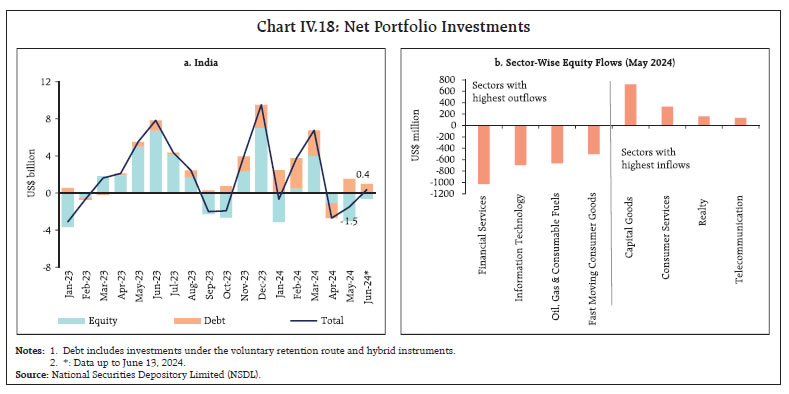 External commercial borrowings (ECB) registrations slowed to US$ 4.3 billion during April 2024 (US$ 7.7 billion in March 2024 and US$ 5.4 billion in April 2023). After adjusting for principal repayments of US$ 3.5 billion, net ECB inflows remained positive for the fourth successive month (Chart IV.19a). ECBs raised in April 2024 were largely intended for working capital needs (Chart IV.19b). They also had wider weighted average interest margins (Chart IV.19c). India's foreign exchange reserves rose to an all-time high of US$ 655.8 billion on June 7, 2024 equivalent of around 11 months of imports projected for 2024-25 and more than 100 per cent of total external debt outstanding at end-December 2023 (Chart IV.20a). Among major foreign exchange holding countries, India added highest reserves worth US$ 33.4 billion, marking an increase of 5.4 per cent during the calendar year 2024 (Chart IV.20b). The Indian rupee (INR) remained one of the least volatile major currencies and appreciated modestly by 0.02 per cent (m-o-m) vis-à-vis the US dollar in May 2024 (Chart IV.21). The INR appreciated by 1.2 per cent (m-o-m) in May 2024 in terms of the 40-currency real effective exchange rate (REER), supported by positive relative price differentials and the appreciation of the INR in nominal effective terms (Chart IV.22). Payment Systems Digital payment system indicators across all the major categories sustained growth (y-o-y) in May 2024, mostly led by the retail segment, including the Unified Payments Interface (UPI), the Bharat Bill Payment System (BBPS) and the National Electronic Funds Transfer (NEFT) [Table IV.3]. The UPI processed a record 14.04 billion transactions in May 2024 as the platform's reach continued to extend into the rural economy. The BBPS expanded strongly in transactions during May 2024 with the nearing of the timeline, i.e., June 30, 202418 to integrate with the API (Application Programming Interface) 1.1 enhancement to enable billers of certain new categories as well as enhance the bill payment experience for customers in the existing and new categories (e-challan, bulk electricity payment, corporate credit cards, etc.). Additionally, the BBPS recorded a pick up (y-o-y) in ticket size in May 2024, reflecting significant progress in its scope, reach and utility. Among other modes, the NEFT expanded at a faster rate (y-o-y), while the National Electronic Toll Collection's (NETC) growth slowed in May 2024 in terms of volume.  Based on the latest available data for April 2024, there was an increase (y-o-y) in the number of credit cards (18.5 per cent), point of sale (PoS) terminals deployed (12.8 per cent), Bharat quick-response (QR) codes (11.5 per cent) and UPI QR codes (22.5 per cent), thereby advancing digitalisation. To further improve the digital infrastructure, the Reserve Bank introduced three significant initiatives19: the PRAVAAH portal, the Retail Direct Mobile App, and the FinTech and EmTech repositories. The PRAVAAH portal seeks to facilitate online applications for various regulatory approvals in an efficient manner; the Retail Direct Mobile App would offer retail investors a convenient and easy way to access the retail direct platform for trading G-Secs; and finally, the Fintech and EmTech repositories would gather data on the Indian FinTech Sector and adoption of emerging technologies (like artificial intelligence, machine learning, cloud computing, etc.) by regulated entities, respectively, to help design appropriate policy approaches. In an effort towards maintaining a balance between optimising benefits of FinTech and minimising idiosyncratic risks they pose to the financial system, the Reserve Bank encouraged self-regulation in the FinTech sector and released the 'Framework for Recognising Self-Regulatory Organisation(s) for FinTech Sector' (SRO-FT framework) on May 30, 2024.20 The framework outlines the characteristics and process for recognising SRO-FT(s) and their broad functions, governance standards, eligibility criteria and expectations. In the statement on developmental and regulatory policies21 dated June 7, the Reserve Bank proposed setting up a Digital Payments Intelligence Platform to mitigate payment fraud risks; inclusion of recurring payments (without any fixed periodicity), for e.g., replenishment of balances in FASTag, the National Common Mobility Card (NCMC), and UPI Lite wallet with auto-replenishment facility under the e-mandate framework to enhance the ease of digital payments. The Reserve Bank also announced the launch of global hackathon "HaRBInger 2024 – Innovation for Transformation" - with two themes viz., 'Zero Financial Frauds' and 'Being Divyang Friendly' to enhance safety and security of digital transactions and prioritise inclusivity for persons with physical disabilities. With regard to strengthening the global digital infrastructure, the National Payments Corporation of India's (NPCI) wholly owned subsidiary, NPCI International Payments Ltd. (NIPL), announced partnership22 with the Central Reserve Bank of Peru (BCRP) to enable the deployment of a UPI-like real-time payments system in Peru, making it the first country in South America to adopt the globally recognised UPI technology. V. Conclusion Amidst these global and domestic developments, the monetary policy committee (MPC) of the Reserve Bank met during June 5-7, 2024 in its second bi-monthly meeting for the year 2024-25. It voted to keep the policy repo rate unchanged at 6.50 per cent and reiterated its stance of remaining focused on withdrawal of accommodation to ensure that inflation progressively aligns to the target, while supporting growth. In the committee's assessment, domestic economic activity is resilient. High frequency indicators of activity reflect a sustained momentum in manufacturing and services. The prospects for agriculture are brightening with the expectations of an above-normal SWM and the actual landfall ahead of its schedule. This should augur well for spurring rural demand and, in turn, support private consumption. The MPC also expected investment activity to be bolstered by strong balance sheets of banks and corporates, the policy emphasis on infrastructure spending, and rising business optimism. Notwithstanding risks from geopolitical tensions, volatility in international commodity prices, and geoeconomic fragmentation, the MPC expected real GDP to rise by 7.2 per cent in 2024-25, over and above the growth rate of 8.2 per cent achieved in the year gone by. Headline inflation was projected to ease from 5.4 per cent in 2023-24 to 4.5 per cent in 2024-25, with evenly balanced risks from the rising incidence of adverse climate events, pressures from input costs and volatility in crude prices and financial markets on the one hand, and the benign effects of the monsoon on food prices on the other. In the view of the MPC, although headline inflation is gradually easing, driven by softening in its core component, the path of disinflation is interrupted by volatile and elevated food inflation which may cause it to reverse after a temporary fall below the target during the second quarter of 2024-25. Consequently, a resolute commitment to a durable alignment of headline inflation with the target will warrant careful monitoring of spillovers from food price pressures to core inflation and inflation expectations. This necessitates a continuation of the disinflationary stance as in the words of Shri Shaktikanta Das, Governor, RBI, "...there is still work to be done. …monetary policy remains squarely focused on price stability to effectively anchor inflation expectations and provide the required foundation for sustained growth over a period of time".
|