by Sreerupa Sengupta and Vineet Kumar Srivastava^ This article documents the KLEMS framework of labour accounts and examines the role of labour and its composition on the trajectory of GVA growth in India. There is a structural shift in employment from agriculture to construction and services and an increased workforce regularisation in the manufacturing sector. The workforce distribution across education categories shows an increase in the level of educational attainment. Labour input on an average contributed thirty per cent to output growth during 1980-81 to 2021-22; out of this, employment contributed twenty-five per cent and an additional five per cent was attributed to the improvement in labour quality. Introduction Key policy debates on growth and welfare occur at the intersection of the production process and labour market. Labour productivity plays a key role in sustained high economic growth. In this context, an assessment of labour composition (or labour quality) is essential for several reasons. First, labour and capital are necessary factor inputs used in the production process, but unlike capital, labour is not well represented in the National Accounts Statistics (NAS). Second, as the frontier of skills is evolving rapidly, India has witnessed an increase in regular employment specially in the manufacturing sector. The labour input unadjusted for quality does not consider the skill dimension. Conventional measures of labour productivity growth measure output per unit of employment by solely looking at labour as a homogenous unit. “As a result, an hour worked by a highly experienced surgeon and an hour worked by a newly hired teenager at a fast-food restaurant are treated as equal amounts of labour” (OECD, 2001). Hence, it is essential to measure the labour composition index that would assess the impact of labour quality on output growth. Further, measuring the labour composition index can be a starting point for measuring the effect of intangible investment and building up the human capital index, which is an important measure of welfare and sustainability. Against this backdrop, the objective of this paper is to present the long term trend of labour input growth – an implicit indicator of human capital for the working population of India. The labour input has two components: employment and labour quality index. Employment measures the number of persons employed by sectors of the economy, whereas the labour quality index depicts the contribution of knowledge and skills that empower the working population to drive economic growth and productivity. The labour quality index explicitly accounts for the heterogeneity of workforce by assigning weights to different workers based on their wage shares which are associated with educational qualification and industry type. By including labour quality in labour input estimation, a change in the proportion of low-skilled to high-skilled workers indicates an increase in labour or productivity greater than the growth in the number of persons employed. In India, production and output related statistics are obtained from NAS. The labour market data, on the other hand, is available from household-level employment survey rounds conducted by National Sample Survey Office (NSSO) and Periodic Labour Force Surveys (PLFS). The NAS does not have comprehensive information on labour accounts, and hence, integrating labour market statistics with NAS would be instrumental in understanding crucial policy questions on the issues of inclusive growth, distribution, and productivity. This article presents the India KLEMS framework that constructs labour accounts consistent with NAS and examines the role of labour and its composition on the trajectory of GVA growth in India. There are various measurement challenges in designing the labour accounts for India in alignment with the NAS framework. First, NAS data are published annually, while labour force surveys in India prior to 2017-18 were carried out five years apart. Furthermore, the earnings or income data for the self-employed workers are not available separately in the NAS and are included in mixed income. To fill this gap, an attempt has been made in the India KLEMS database to construct the annual time series of labour accounts consistent with the NAS classification of industries. The labour input accounts are computed for aggregate and subsectors of the economy. The time period of the study is 1980-81 to 2021-22. Following the growth accounting framework, this paper analyses the contribution of labour input and its composition (labour quality) to GVA growth. There has been a notable shift in employment from agriculture to the construction and services sectors and an increased regularisation of the workforce in the manufacturing sector. The empirical analysis suggests that for the total economy, labour quality on an average increased by 0.7 per cent per annum from 1980-81 to 2021-22. There is a general increase in education levels for all workers, especially those employed in capital-intensive manufacturing and services sectors. The labour quality index shows higher growth in capital-intensive manufacturing and service sectors, while construction and agriculture sectors exhibit lower growth attributed to the prevalence of low-skilled workers. The growth accounting exercise shows that employment contributed around 25 per cent to output growth, with labour quality contributing an additional five per cent to output growth on an average from 1980-81 to 2021-22. The rest of the article is arranged as follows. Section II describes the KLEMS methodology and data sources used to construct the labour input index in India. Section III presents some stylised facts on labour quality in India during 1980-81 to 2021-22. Section IV presents the findings on the contribution of labour input and its composition to output growth for aggregate and disaggregated sectors. The final section concludes and highlights some outstanding issues in integrating KLEMS’s labour accounts with the NAS framework. II. Methodology and Dataset Following Jorgenson et.al. (1987) and the EU KLEMS Manual, the India KLEMS framework has designed the labour input index that estimates employment growth adjusted for quality (KLEMS Manual, 2024). This framework gives each worker type a varied weight based on the level of education attained by the workers. The growth of the labour input index is given as – Where L is the aggregate labour index, Hijt indicates the total persons worked by a particular education type ‘i’ in industry ‘j’ in period ‘t’. i = 1,2…n and denotes the number of education categories. j = 1,2,….n and denotes the number of industries. Σ denotes summation over all education categories. υ̅l is the average proportion of labour compensation value that goes toward each category of employment. This is given as- Here, vi is the value share of labour for the ith education category. wi is the wage rate of labour for the ith education category. The weighting structure implies that workers who get a higher wage will have a relatively higher influence on the labour input index. It follows from equation (1) that the growth in the labour quality index can be expressed as Where Qlt is the quality index of labour. In equation (2), the first item on the right-hand side represents the change in labour input, whereas the second term represents the change in the total number of employees. The difference between the two gives the labour quality index, which measures the effect of changes in the educational attainment of the country’s labour force. Once the employment and labour composition (or labour quality) index is constructed, following the growth accounting framework by Jorgenson et al. (2005), the relative contribution of employment and labour quality to output growth is estimated. The output growth of an industry is computed as a weighted share of factor input growth and total factor productivity (TFP) growth. Compensation of factor inputs is used as weights. The output growth accounting decomposition is represented by the following equation:  Where ΔlnYt is the growth in output growth for the total economy. ΔlnKt and ΔlnLt represents growth of primary factor inputs- capital (K) and labour (L). ΔlnLQt denotes growth of labour quality. υ̅ is two-period average compensation shares of factor inputs (labour and capital) in gross value added. TFPt is the total factor productivity growth. All variables are indexed over time t. By implementing equation (3), we can compute the proportion of output growth that is accounted by growth in employment, labour quality, capital and TFP growth, respectively. For computing the labour quality index, the data required is the number of persons employed and earnings (labour compensation) by educational qualifications of the workers across different industries. It is important to note that there are several issues in constructing a consistent time series of employment and earnings data for India. For instance, the back series of employment data is based on quinquennial employment survey rounds of NSSO, which were published with a gap of five years from 1980 to 2011; from 2017 onwards, the PLFS provides annual employment series. Further, there is a large informal labour market in India, and the information on the earnings of different categories of workers, especially self-employed workers, is not consistently available in NAS and labour force survey rounds. To fill this gap, the following treatments are done in KLEMS framework: (a) For employment time series, worker participation rates are taken from seven unit-level Employment-Unemployment Survey (EUS) rounds published by NSSO (32nd to 68th round) and five Periodic Labour Force Survey (PLFS) (2017-18 to 2021-22). As different labour force survey rounds use different national industry classifications (NICs), a concordance has been worked out among NIC 1970, NIC 1987, NIC 1998, and NIC 2007 industry classifications. The number of employed people is then estimated by applying the worker participation rates from EUS to the population estimates from the census for the relevant period. For years in-between the major employment rounds, the employment estimates are derived by interpolation. For non-census years population projection data are obtained from World Bank estimates. In order to coincide with National Accounts estimates, the interpolation is centred around October, which is the midpoint of Indian financial year (April-March)(KLEMS Manual 2024). (b) When the time series of employment is obtained, the next step is to account for the heterogeneity of worker groups. Skills are measured in terms of educational characteristics in India KLEMS framework. The educational categories are: (i) below primary (ii) primary (iii) middle, (iv) secondary and higher secondary, and (v) above higher secondary.1 (c) The wages of casual and regular workers based on their education levels are obtained from employment survey rounds. However, the income of self-employed workers is not observable directly and has to be estimated econometrically. For deriving the income of self-employed persons, the standard practice in the EU KLEMS methodology is followed in India KLEMS, where first the sample selection bias is corrected by using Heckman’s two-step technique (Heckman, 1976). Thereafter, the Mincer wage function has been used on earnings of casual and regular workers. The resulting data is utilised to find the corresponding earnings of self-employed workers with similar traits (Aggarwal and Erumban, 2013). The control variables used in the regression are dummy variables on age, marital status, rural or urban location, gender and type of household. Finally, when wages are obtained as per educational distribution for casual, regular and self-employed workers, then the labour quality index is calculated using equations (1) and (2) stated above. III. Stylised Facts on Employment Quality Over the years, there has been a perceptible shift in the employment structure in India. The agriculture sector continues to be the largest employment generator, though the share of employment in agriculture reduced from 68.5 per cent in 1983-84 to 42.8 per cent in 2021-22. The workforce that transitioned away from agriculture found opportunities in non-farm sector specially in construction and services (Goldar et.al., 2017). Construction sector accounted for 2.3 per cent of total economy employment in 1983-84 and its share increased to 12.3 per cent in 2021-22. The employment share of services sector increased from 17.7 per cent to 33.5 per cent during the same period. The share of manufacturing employment remained range bound (Chart 1). 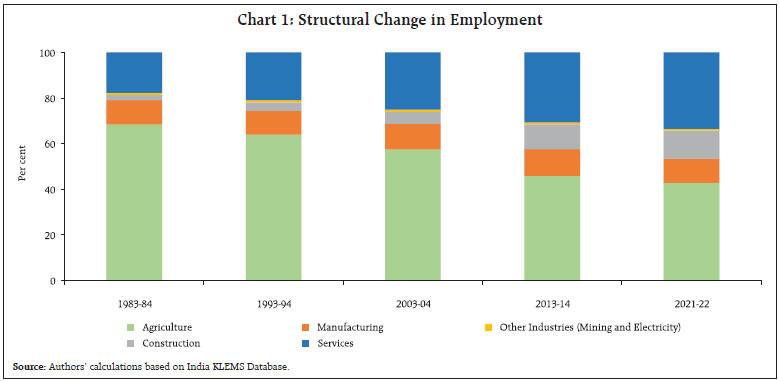 Next, we examine the quality of employment across sub-sectors of the economy. The selected attributes are: a) nature of employment, b) education profile of workers, and c) compensation paid to workers. The nature of employment is a widely used proxy for measuring job quality in developing nations. The labour market in India has three types of workers – regular, casual and self-employed. Regular employment is considered more stable and of better quality than casual and self-employment as most regular workers have written job contracts (Nayyar, 2012; Dewan and Peek, 2007; Papola and Sharma; 2015). Workers’ educational qualifications are considered indicators of job quality, as workers with higher education secure better quality jobs in terms of job security, benefits, and higher wages (Aggarwal and Goldar, 2019). The compensation paid to workers gives an idea of whether labour income can support the minimum standard of living and indicates job quality (Jackson and Kumar, 1998). III.1 Nature of Employment The first aspect of job quality relates to the nature of employment. The labour force survey data show that a major share of workforce in India is engaged in the informal/unorganised sector. The share of regular worker has been increasing and those of casual and self-employed workers have been declining over time. The share of self-employed and casual workers combined declined from 86.8 per cent in 1980-81 to 77 per cent in 2021-22. In contrast, the share of regular workers increased from 13.2 per cent in 1980-81 to 22.9 per cent in 2021-22 (Chart 2). 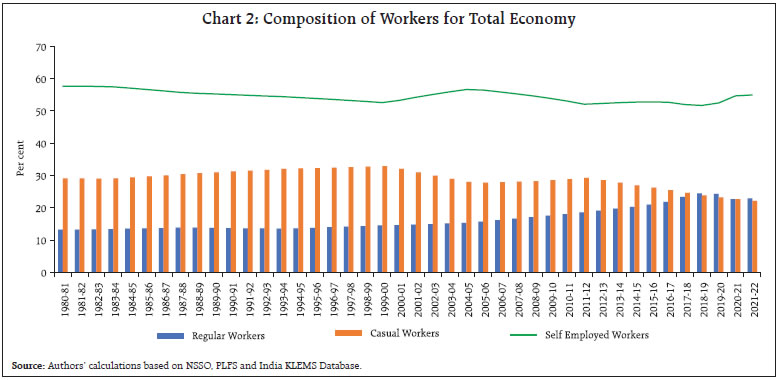 The pattern observed on greater regularisation of workforce came from manufacturing and services sectors. In manufacturing, the share of regular workers increased significantly from 27.6 per cent in 1980-81 to 49.9 per cent in 2021-22. In the services sector, the share of regular workers expanded from 44.8 per cent in 1980-81 to 48.1 per cent in 2021-22. Agriculture and construction sectors have a high share of informal workers. In agriculture, the share of self-employed workers increased from 63.6 per cent in 1980-81 to 78.2 per cent in 2021-22. The construction sector, which has become one of the fastest-growing sectors in terms of employment generation, has mostly casual workers. The share of casual workforce in the construction sector was 71.2 per cent in 1980-81, which increased to 82.3 per cent in 2021-22 (Chart 3). III.2 Education Attainment of Workers The second attribute of job quality is the educational attainment of workers. When we analyse the distribution of the workforce by broad education categories from 1983-84 till 2021-22, it is observed that the general level of education for all workers has increased. There has been a decrease in the share of workers with below primary education and a corresponding increase in the share of workers with above higher secondary or tertiary education, during the same period. Among disaggregated sectors, the skill intensities of sectors are quite different. The agriculture sector has the largest workforce with primary education. On the other hand, the number of workers with middle, secondary and higher secondary degrees in the manufacturing sector has increased sharply. The services sector has the largest share of tertiary-educated workers. The employment share in services sector with above higher secondary education was around 10 per cent in 1983-84 which expanded to 30 per cent in 2021-22. This suggests that service sector jobs are becoming high-skill intensive in nature, whereas job requirements in the manufacturing sector remain medium skill intensive (Chart 4). III.3 Labour Income Share The third aspect of job quality relates to the workers’ compensation. In 1981-82, the labour income shares in GVA ranged from 80 per cent in construction to 38 per cent in manufacturing (Table 1). Due to structural change and increasing capital intensity across sectors, the labour income share declined by 2.2 per cent for the total economy,1.4 per cent for agriculture, 12.7 per cent for mining and quarrying, 6.4 per cent for manufacturing, 2.7 per cent for construction and 2.6 per cent for services sectors between 1981-82 to 2021-22 (Table 1). The International Labour Organisation (ILO) (2014) finds that across developed and emerging nations, if the growth rate of real wages is slower than labour productivity growth, then the labour income share declines. Examining wage productivity data for India, Goldar and Das (2020) find that real wage growth lagged behind labour productivity growth for the total economy and subsectors for India, with the divergence being the sharpest in the manufacturing sector. 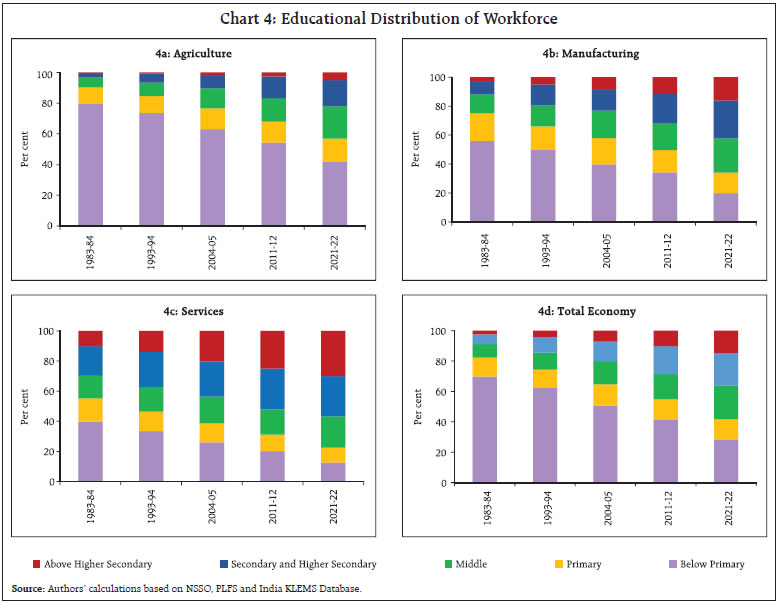
| Table 1: Sector Wise Share of Labour Income | | (Per cent) | | | 1981-82 | 1991-92 | 2001-02 | 2021-22 | | Total Economy | 54.1 | 53.6 | 50.8 | 51.9 | | Agriculture | 57.5 | 56.2 | 55.2 | 56.1 | | Mining and Quarrying | 37.3 | 32.1 | 34.2 | 24.6 | | Manufacturing | 37.9 | 33.9 | 32.0 | 31.5 | | Construction | 80.0 | 80.3 | 77.9 | 77.3 | | Services | 57.0 | 58.6 | 53.2 | 54.4 | Note: Labour and Capital Income adds up to 100.
Source: Authors’ calculations based on India KLEMS Database. | Next, we combine the three attributes of job quality for disaggregated sectors and identify sectors that have a relatively higher proportion of skilled workers, pay higher wages, and employ more of regular workers. Within manufacturing, capital-intensive industries like chemicals, machinery, and pulp and paper products employ relatively high skilled workers. Within the services sector, business and financial services, health, education, and telecommunication provide higher quality of employment, measured in terms of the level of education, proportion of regular workers and average wage per day (Table 2). | Table 2: Quality of Employment and Sectoral Distribution - 2021-22 | | Sectors with Relatively Higher Share of High Skilled Workers | Proportion of Regular workers | Average wage per day | | 1 | Pulp, Paper, Printing and Publishing | High | High | | 2 | Coke, Refined Petroleum Products | High | Low | | 3 | Chemicals and Chemical Products | High | High | | 4 | Rubber and Plastic Products | High | Low | | 5 | Basic and Fabricated Metal Products | High | Low | | 6 | Machinery | High | High | | 7 | Electrical and Optical Equipment | High | Low | | 8 | Transport Equipment | High | Low | | 9 | Electricity, Gas and Water Supply | High | High | | 10 | Post and Telecommunication | High | High | | 11 | Financial Services | High | High | | 12 | Business Services | High | High | | 13 | Public Administration and Defense | High | Low | | 14 | Education | High | High | | 15 | Health and Social Work | High | High | Note: Sectors are classified as high when the level of education, proportion of regular workers and the wage rate are above total economy average. Similarly, sectors are classified as low if the level of higher education is high, the proportion of casual workers is low, and the average wage is below the national average.
Source: Authors’ computation from India KLEMS database. | IV. Labour Quality Growth and its Contribution to GVA Growth IV.1 Growth in Employment It is observed that the average employment growth for the total economy was 2.7 per cent per annum during 1980-81 to 2021-22, mostly driven by the construction and services sectors. All services subsectors recorded employment growth above 3 per cent per annum, on an average. Within the services sectors, employment growth was the fastest in business services, construction, electrical and optical equipment, and financial services subsectors (Table 3 and Chart 5). IV.2 Growth in the Labour Quality Index For the total economy, the labour quality index has increased on an average by 0.7 per cent per annum from 1980-81 to 2021-22. Among broad sectors, the growth of the labour quality index has been relatively high for manufacturing and mining (Table 4). At the disaggregated industry level, the improvement in labour quality was the fastest in capital-intensive manufacturing sectors such as chemicals, machinery, and transport equipment. Among the services sector, subsectors like health, social work and telecommunication recorded the fastest growth in the labour quality index (Chart 6). Subsectors like business, education and financial services, however recorded slower growth in the quality index as these sectors already have a very high share of skilled workers (Krishna et al., 2016). | Table 3: Employment Growth: Broad sectors | | (Annual Average, Per cent) | | Subsectors | 1980-81 to 1999-00 | 2000-01 to 2021-22 | 1980-81 to 2021-22 | | Total Economy | 2.8 | 2.5 | 2.7 | | Agriculture | 1.0 | -0.1 | 0.4 | | Manufacturing | 2.6 | 2.0 | 2.3 | | Construction | 5.9 | 6.2 | 6.1 | | Mining and Quarrying | 2.8 | -1.8 | 0.5 | | Electricity, Gas and Water Supply | 1.8 | 3.6 | 2.7 | | Services | 3.5 | 2.9 | 3.2 | | Source: Authors’ computation from India KLEMS database. |
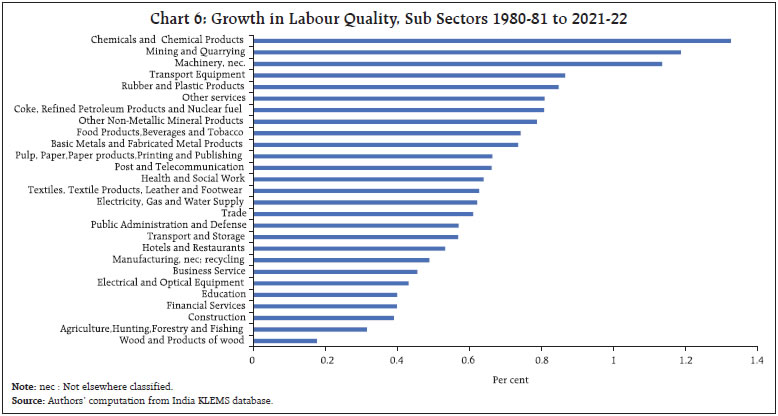
| Table 4: Labour Quality Growth: Broad Sectors | | (Annual Average, Per cent) | | | 1980-81 to 1999-00 | 2000-01 to 2021-22 | 1980-81 to 2021-22 | | Total Economy | 0.72 | 0.60 | 0.66 | | Agriculture | 0.28 | 0.34 | 0.32 | | Manufacturing | 0.87 | 0.63 | 0.74 | | Construction | 0.46 | 0.33 | 0.39 | | Mining and Quarrying | 0.74 | 1.58 | 1.19 | | Electricity, Gas and Water Supply | 0.83 | 0.44 | 0.62 | | Services | 0.55 | 0.59 | 0.56 | | Source: Authors’ computation from India KLEMS data 2024. | IV. 3 Labour Input’s Contribution to Output Growth The growth accounting decomposition from 1980-81 to 2021-22 shows that the labour quality index contributed around five per cent to output growth on average. Employment contributed around one-fourth of output growth during the same period. The contribution of labour was relatively high during the 1980s, and since the mid-1990s, capital deepening has become the leading contributor to output growth. The contribution of labour input is still very significant and accounted for 30 per cent of output growth during the study period (Chart 7). 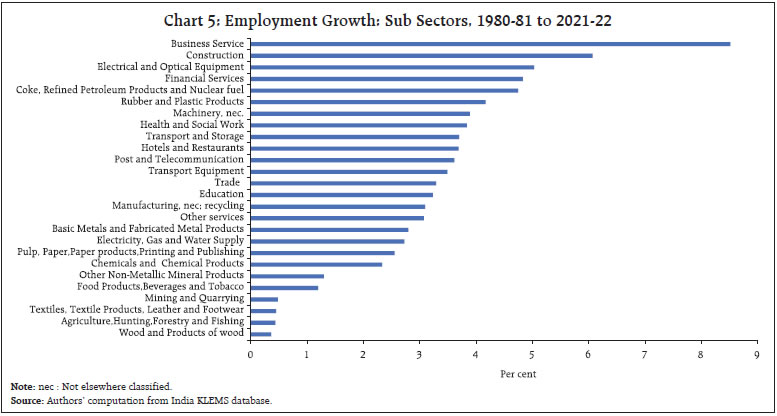
 Within manufacturing, the contribution of labour quality to output growth was high for textiles, pulp, paper products, and machinery and equipment. Within services, the labour quality growth contributed significantly to output growth for public administration and defence. Other services subsectors where labour quality contribution was high include health and social work, transport and storage and hotel and restaurants. Besides, mining, quarrying, and construction sectors also have more than five per cent of output being driven by labour quality growth (Chart 8).
V. Conclusion In the Indian labour market, there has been a notable shift in employment from agriculture to the construction and services sectors, accompanied by increased workforce regularisation in the manufacturing sector. An analysis of the workforce distribution across educational categories shows a general increase in education levels for all workers. Capital-intensive industries like chemicals and machinery tend to employ workers with higher education levels, higher average wages and fewer casual workers. Within the services sectors, business and financial services, health, education, public administration, and defense subsectors display high-quality employment. The labour quality index computed based on educational characteristics of the workforce shows that the growth in labour quality increased on an average by 0.7 per cent per annum from 1980-81 to 2021-22, driven by capital-intensive manufacturing and services sectors like health and social work, other services, and telecommunication. The growth accounting exercise in KLEMS framework shows that employment contributed around 25 per cent to output growth, with labour quality contributing an additional five per cent to output growth on average during 1980-81 to 2021-22. Thus, the labour input (combined employment and quality) accounted for 30 per cent of overall output growth during 1980-81 to 2021-22. In the manufacturing sector, labour quality contributed significantly to output growth in textiles, pulp, paper industry, and machinery. In services, subsectors like public administration, defense, health, social work, transport and storage, and hotels and restaurants witnessed substantial contributions from labour quality to output growth. Employment and labour quality played a more significant role in driving output growth in the 1980s, while capital emerged as the dominant input since the mid-1990s. Going forward, the labour data for India derived from KLEMS framework can be considered for integration with NAS data as the KLEMS framework maintains consistency with NAS. Countries like the Netherlands, Switzerland, Denmark, Norway, Malaysia and Australia have already published labour accounts in their System of National Accounts (SNA). The report on guidance for enhancing and broadening the SNA framework (2023) mentions that the labour accounts in SNA should have four quadrant tables covering information on jobs, number of persons employed (including regular, casual and self-employed workers), volume (that is hours worked) and payments. For India, efforts could be made to consider statistics on job and vacancy posting from establishment-based or enterprise-level surveys. The Quarterly Report on Employment Scenario published by the Labour Bureau has started providing enterprise-wise vacancy details from 2021 onwards. Another data challenge is estimating the wages of self-employed persons, which accounts for the majority of employed individuals in India. The payment quadrant is available in NAS, where payment of self-employed persons is clubbed under the mixed income. The mixed income contains a surplus accrued from the production and labour income of self-employed persons. An integration with KLEMS accounts could facilitate the segregation of mixed income between earnings of capital and earnings of self-employed, regular and casual workers in the national accounts. References Aggarwal, S. C., and Goldar, B. (2019). Structure and growth of employment: Evidence from India KLEMS data. Indian Growth and Development Review, 12(2), 202-228. Aggarwal, S. C., and Erumban, A. A. (2013). Labour input for measuring productivity growth in India: methodology and estimates. paper presented at the Second India KLEMS Annual Workshop, April 26, 2012. New Delhi: ICRIER. Dewan, S. and Peek, P. (2007). Beyond the employment/unemployment dichotomy: measuring the quality of employment in low income countries, Working Paper No. 83, Policy Integration and Statistics Department, ILO, Geneva. Goldar, B., Krishna, K. L., Aggarwal, S. C., Das, D. K., Erumban, A. A., & Das, P. C. (2017). Productivity growth in India since the 1980s: the KLEMS approach. Indian Economic Review, 52, 37-71. Jackson, A., and Kumar, P. (1998). Measuring and monitoring the quality of jobs and the work environment in Canada. In Proceedings of the Centre for the Study of Living Standards Conference on the State of Living Standards and Quality of Life, Ottawa, AB, Canada (pp. 30-31). Jorgenson, D. W., Ho, M. S., and Stiroh, K. J. (2005). Productivity, Volume 3: Information technology and the American growth Resurgence. MIT Press Books. Jorgenson, D. W., Gollop, F. M., and Barbara, M. Fraumeni. 1987. Productivity and US economic growth, 580. KLEMS Manual (2024). Measuring Productivity at Industry Level- The India KLEMS database. Reserve Bank of India. Krishna, K. L., Das, D. K., Erumban, A. A., Aggarwal, S., and Das, P. C. (2016). Productivity dynamics in India’s service sector: an industry-level perspective. Working Paper 261. CDE, Delhi School of Economics Nayyar, Gaurav (2012). The Service Sector in India’s Development, Cambridge University Press, New York. OECD. Publishing. (2001). Measuring productivity-OECD Manual: Measurement of Aggregate and Industry-Level Productivity Growth. Organisation for Economic Co-operation and Development. Papola, T. S., and Sharma, A. N. (2015). Labour and Employment in Fast Growing India: Issues of employment and inclusiveness. Indian Economy Since Independence. New Delhi: Academic Foundation, 725-806. Quarterly report on employment scenario extracted from https://labourbureau.gov.in/uploads/pdf/Fourth_QES.pdf SNA (2023). Guidance on enhancing and broadening the SNA framework for household well-being and sustainability prepared by Advisory Expert Group on NationalAccounts, https://unstats.un.org/unsd/nationalaccount/aeg/2023/M23/M23_02_01_WS1_GN_Framework_HH_Wellbeing_Sustainability.pdf
|