The global economy remained resilient in H1:2024, with declining inflation supporting household spending. Stable growth momentum amidst monetary policy easing is becoming the prevailing theme across most economies. In spite of geopolitical tensions, India’s growth outlook is supported by robust domestic engines. Some high frequency indicators have, however, shown a slackening of momentum in the second quarter of 2024-25 partly attributable to idiosyncratic factors like unusually heavy rains in August and September. Looking ahead, private investment is showing some encouraging signs in terms of lead indicators while consumption spending is shaping up for a festival season revival. After remaining below target for two consecutive months, inflation surged in September, as an adverse statistical base effect was compounded by a resurgence in food price momentum. Introduction As they approached October – a month of symphony of permanence and change1 − central banks in systemically important economies assumed the driver’s seat to steer the global economy with shock and awe. Their specific actions are set out in Section II. As regards the unusually aggressive start of the rate-cutting cycle by the US Federal Open Market Committee (FOMC), speculations on the motive range widely: the economy is “in a good place” with “growing confidence that the strength in the labour market can be maintained”2; mission accomplished in the fight against inflation; guarding against adverse spillovers from Europe and China; exceptionally high real interest rates at the starting point; and insurance with which to navigate the reality of a highly uncertain landscape3, especially as monetary policy is transmitted with long and variable lags. The conjecturing is understandable. Large opening rate cuts are distress signal to markets, warning that the economy is in dire shape. The FOMC’s action took place, however, against the backdrop of a robust economy as evident in revisions in estimates of GDP for the second quarter of 2024 and also for the preceding quarter. Many believe that the FOMC is singed by criticism about its delayed rate hikes and, therefore, wants to be ahead of the curve in this phase of rate actions. The US rate move provides a cue for other central banks among advanced economies (AEs), including the holdouts, and especially those that have succeeded in bringing inflation to target and hence have the elbow room to support their weak economies. Yet, even as monetary easing is becoming the prevailing theme, some countries are likely to see tightening instead − Japan; Brazil; and Russia. On the other side of the world, China gave up its drip-feeding support to its economy and unleashed a fusillade of stimulus measures to put a floor underneath its ailing economy, including property and stock markets. The response followed a torrent of warning signs: shrinking tax revenue; falling prices of homes and industrial goods; slowing retail sales; depressed consumer confidence; and weak industrial output and investment. The measures electrified financial markets. Equity prices fell across the world as the stock markets in Shanghai and Hong Kong notched up their biggest gains in four years. Across Asia, currencies tumbled and the yuan rose as capital flows rotated and surged into China. It remains to be seen how much further the Chinese authorities will go to solve the long festering real estate crisis, the ageing and shrinking workforce, industrial overcapacity, trade tensions and severely strained local government finances. In its latest economic outlook, the Organisation for Economic Cooperation and Development (OECD) assessed that the global economy remained resilient in the first half of 2024, with declining inflation supporting household spending. High frequency indicators suggest stable growth momentum across most economies. Business surveys point to stronger activity in services than in manufacturing. Surveys also indicate that subdued consumer confidence is improving in Europe as well as in several emerging market economies (EMEs). The recovery in global trade is strengthening, with trade volumes rising for both goods and services. Global container shipping has mostly adapted to disruptions in the Red Sea and Panama Canal routes, but journey times have lengthened and congestion has risen in key Asian ports. Shipping costs are estimated to have risen around 160 per cent than a year ago, which will eventually feed into inflation. Global financial conditions are easing from restrictive levels, with financial markets continuing to front run central banks in their expectations of policy rate reductions. While long-term bond yields have declined, corporate bond issuances have picked up and equity markets reflect ebullience, heightened risk aversion has gripped market participants with the escalation of hostilities into war in the middle east. The outlook for global output growth has been slightly upgraded (details in Section II). An important point made by the OECD is about persistent dissatisfaction among consumers with economic performance – linked to the fact that food prices remain well above their pre-pandemic level: “for people who go to the super market, food prices relative to wages are still higher”.4 Key near term risks include persisting global and trade tensions; the possibility of a growth slowdown as labour market pressures fade; and potential disruptions in financial markets if disinflation stalls. Overall, the OECD is of the view that the global economy is ‘turning the corner’. The large interest rate cut in the US is likely to ease pressure on indebted EMEs and fire up demand for local currency bonds. Several of their central banks have lowered their own policy rates or provided dovish forward guidance, anticipating the reduction in US interest rates. The anticipated support to EME fixed income assets appears to be favouring the ‘late cutters’ among them. EME equities have generally rallied after the FOMC’s decision, albeit interrupted by the recent sway towards China and the escalation of conflict between Iran and Israel. For the world’s poorest countries, however, it has been a brutal decade5 - the number of people exiting extreme poverty has slowed, as has progress in fighting infectious diseases. Amidst all these, gold prices have breached all-time highs on bullish market sentiment combined with geopolitical tensions. On the other hand, a strange stability characterises crude oil prices, despite the recent flaring up of West Asian hostilities. This reflects a more favourable balance between demand and supply. Sanctions have not acted as a squeeze on global supply. Output from non-OPEC countries like the US, Canada, Brazil and Gayana has surged. OPEC plus is a divided house, with cut backs in production running the risk of losing market share without revenue gains. There is also divergence in the assessment of demand – while the international energy agency (IEA) expects that an additional 9,00,000 barrels oil a day will be needed in 2024, the OPEC is far more bullish and expects an extra 2 million barrels will be required. Recent updates by multilaterals and credit rating agencies indicate that India’s medium-term prospects remain bright on the back of continuing reforms, infrastructure development, and sustainable technologies. Improving prospects for foreign direct investment (FDI) would support growth and investment, particularly in manufacturing.6 In spite of recent geopolitical tensions, India’s growth outlook is supported by robust domestic engines. Some high frequency indicators have, however, shown a slackening of momentum in the second quarter of 2024-25, partly attributable to idiosyncratic factors like unusually heavy rains in August and September, and Pitru Paksha7 - goods and services tax (GST) collections; automobile sales; bank credit growth; merchandise exports; and the manufacturing purchasing managers’ index (PMI). The slowing of speed is also reflected in our nowcast of real GDP growth given in Section III. In parallel, there are other high frequency indicators which show steady growth. Consumption spending is shaping up for a festival season revival, especially in small towns and lower tier cities. Despite high prices tempering some of the enthusiasm, many buyers are prioritising discounts. Survey respondents are pointing to higher spending, driven by wardrobe updates, electronics, home décor and jewellery purchases. Packaged food companies are ramping up supply chains and offerings for the festival seasons in expectations of an uptick in demand in both urban and rural regions. Unique on-platform innovations on retail media are helping to drive their brands. Although initial e-commerce sales have been underwhelming, retailers are expecting a late season push. Consumer spending is expected to be about 25 per cent higher than during Dussehra-Diwali last year.8 This is expected to be driven by off-line retail, followed by the online channel. Quick commerce (Q-COMM) platforms are bringing about a rapid change in the behaviour of on-line shoppers, with an increasing proportion relying on fast delivery options for grocery needs and ready-to-eat meals.9 Q-COMM is changing Indian consumers’ behaviour: rather than reaching into the cupboard, they swipe an app; they prefer to make a trip to the front door than to a store. The mass end has remained soft while premiumisation is strong. With finance companies having expanded their reach, smaller towns and rural areas that are traditionally cash dominated are seeing a rise in credit-driven consumption, particularly two wheelers, electronics and smart phones. Q-COMM shoppers are becoming increasingly discerning, price conscious, and channel agnostic. At top private banks, there is a hiring spree underway, which is a positive for consumption.10 There are also expectations of a surge in hiring of gig workers for the festival season.11 Private investment is showing some encouraging lead indicators, although the slack continues. Corporates results for the first quarter of 2024-25 had shown a deceleration in real gross value added by non-government non-finance companies.12 Real investments in plants and machinery remained subdued while net fixed assets have slowed down. Apparently, the crowding in effect of government capex is lagged. Given the moderation in sales growth, corporates appear to be protecting margins by conserving spending on both raw materials and manpower while delaying an aggressive capex push. There is a view gaining ground that the time for private investment is now; delay risks loss of competitiveness. The stage is set for the private sector to deploy capital and invest in growth, build capacities, create employment and improve efficiencies. Corporate India needs to reinvest its profits to digitize the production value chain with the goal of designing, building and selling innovative products and services that cater to the needs of the increasingly differentiating Indian consumer. In conjunction with schemes announced in Union Budget 2024-25, it also needs to invest in an employable manufacturing workforce. Among recent lead indicators, valuations are getting heft in the tech sector on earnings upgrades, based on an anticipated revival of demand in the US and Europe – indicative of new shoots of investments in this sector. Furthermore, greenfield hotel investments have returned to pre-pandemic levels. Project announcements have picked up speed following the election slump, led by manufacturing - electric vehicle manufacturing plants feature among the top project announcements. In the second quarter, the streak of contractions in new projects appears to have come to an end. The project pipeline is growing but completion remains a challenge. Turning to financial markets which are discussed in greater detail in Section IV, the equities outlook is positive, with the broad medium-term uptrend remaining intact.13 Volatility have generally remained low, indicating reduced market risk in spite of stretched valuations. Abstracting from the China flavour in October so far, foreign portfolio investments (FPIs) in equities and debt have been buoyant through June to September 2024, drawn by pull factors in the form of India’s growth story, a booming initial public offering (IPO) market and the increasing weight of India in global indices. In fact, India has led the global IPO market during 2024 so far, with both small and medium enterprises (SMEs) and the mainboard segment contributing to the surge. The stage appears set for mega IPOs14 to shine this Diwali. Recent data suggest that credit card transactions volumes have slowed as lenders are adopting caution in view of risks flagged in unsecured loans. Incipient stress in the microfinance sector appears to have been driven by lenders’ drive to disburse loans rather than borrowers’ demand.15 The self-regulatory organisation – Microfinance Institutions Network (MFIN) - points to guardrails to mitigate asset quality challenges such as capping a borrower’s loan repayment obligations at 50 per cent of household’s income, limiting the number of microfinance lenders and capping total indebtedness.16 Credit bureau data indicate that retail credit growth has moderated as lenders have tightened personal loan supply.17 In the banking space, deposit rates are expected to stay elevated despite some slowing down of credit growth, although more recently, bulk deposit rates appear to have peaked. Banks are also launching innovative deposit schemes Banks have also continued to rely on certificates of deposits (CDs) to mobilise funds. A sharp decline in default rates in the infrastructure sector has boosted investors’ confidence, driving strong demand for infrastructure bond issuances by banks. non-banking financial companies (NBFCs) are also looking at raising finance through bond issuances going forward. Globally, digital ecosystems in banking, finance and payments are expected to gain accelerated momentum, with countries exploring or launching instant payment solutions and central bank digital currencies (CBDCs). 134 countries, representing 98 per cent of the global economy, are developing digital fiat currencies.18 The Society for Worldwide Interbank Financial Telecommunication (SWIFT) plans to integrate traditional banking systems with CBDCs and digital assets to seamlessly handle a range of asset and currency types.19 On September 22, 2024 the Summit of the Future held in New York adopted a Pact for the Future that includes a Global Digital Compact with the key objectives of improving connectivity, promoting digital literacy, and ensuring equitable access to the digital economy while fostering a safe and inclusive digital space. It also advocates responsible data governance, privacy protection, and international cooperation in artificial intelligence (AI) governance, emphasising human rights and equitable participation. In India, digitalisation is poised on a self-propelling growth path. India’s FinTech ecosystem is thriving, with the number of registered FinTech startups surging from 2,100 in 2021 to 10,200 in 2024, a fivefold increase.20 A bulk of the personal loans under ₹one lakh were sourced through FinTechs in 2023-24.21 In the first quarter of 2024-25, FinTech loan disbursals grew by 27 per cent year-on-year (y-o-y), underscoring robust customer demand for digital credit.22 The financial services sector is also tapping into the growing potential of niche segments with variable income streams and limited credit histories.23 After two consecutive monthly below target readings, inflation touched 5.5 per cent in September, as an adverse statistical base effect was compounded by a resurgence in food price momentum. The sharp pick-up was driven by the food group, but core inflation also registered an uptick along with a narrowing of the deflation in fuel prices. Food price pressures in respect of vegetables could turn out to be transitory with robust kharif harvest arrivals, although the surge in the price momentum of oils and fats can have second order effects impacting overall inflation through inputs costs of fast moving consumer goods (FMCGs). The typical easing of food prices in the winter aided by improving prospects for rabi crops should, however, lead to a recalibration of headline inflation to engender its alignment with the target from Q4:2024-25. Set against this backdrop, the remainder of the article is structured into four sections. Section II covers the rapidly evolving developments in the global economy. An assessment of domestic macroeconomic conditions is set out in Section III. Section IV encapsulates financial conditions in India, while the last Section sets out concluding remarks. II. Global Setting The global economy has exhibited resilience in the midst of heightened geopolitical uncertainty. As inflation continued to ease towards targets in most AEs, several central banks have embarked on the path of policy easing. In its September 2024 Interim Economic Outlook, the OECD revised upwards its projection of global growth for 2024 by 10 basis points (bps) to 3.2 per cent (from their earlier projection in May 2024) due to stronger momentum witnessed in services sector activity (Chart II.1). The growth projection for 2025 was retained at 3.2 per cent. Our model-based nowcast points to a slowdown in global growth momentum in Q3:2024, weighed down by heightened geopolitical risks (Chart II.2). The global supply chain pressures index (GSCPI) remained above its historical average levels although it eased marginally in September (Chart II.3a). Container shipping costs recorded some moderation from the peak levels recorded in July 2024 but their levels remain high (Chart II.3b). The port workers strike along the East Coast and Gulf of Mexico drove up freight and shipping costs in September, leading to around 15 per cent increase in the Baltic Dry Index, which more than reversed in October as workers reached an agreement (Chart II.3c). Geopolitical risks remained elevated due to ongoing tensions in the Middle East, albeit with some moderation since July 2024 (Chart II.3d).
In September 2024, consumer confidence improved in the US, Euro area, India and Japan but worsened in the UK (Chart II.4a). Financial conditions eased in major AEs and EMEs (Chart II.4b).
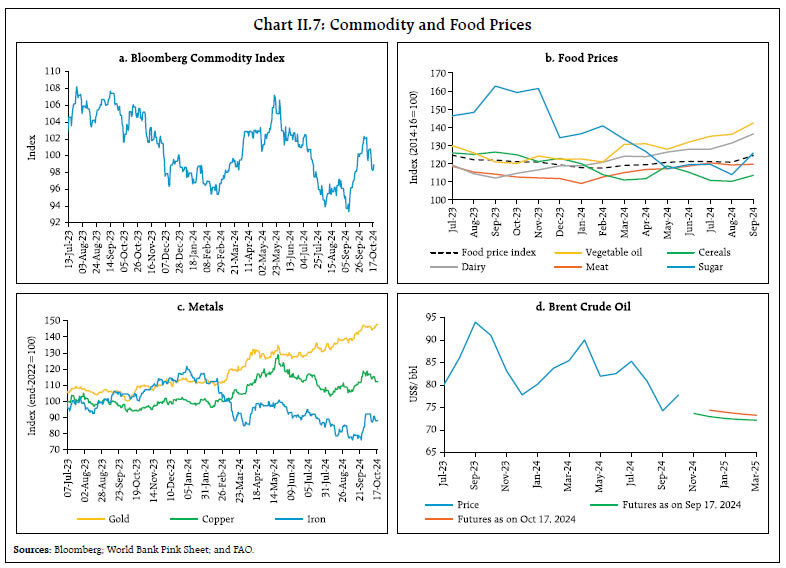
The global composite purchasing managers’ index (PMI) slowed to an eight-month low in September, driven by a downturn in manufacturing which slipped to an eleven-month low due to contraction in output, new orders and employment growth. Services activity, however, expanded for the twentieth consecutive month, offsetting the weakness in manufacturing to keep the global composite PMI in the expansionary zone, albeit with a sequential moderation (Chart II.5). The composite PMI for export orders declined in September as an increase in services export orders was more than offset by a decline in manufacturing export orders (Chart II.6). Global commodity prices recorded a sharp uptick in September as the fall in energy prices was offset by gains in metal prices. The Bloomberg commodity index increased by 4.4 per cent (m-o-m) in September (Chart II.7a). It, however, partly reversed the gains in the first fortnight of October, as the index fell by around 2 per cent. The Food and Agriculture Organization’s (FAO’s) food price index registered an increase of 3 per cent (m-o-m) in September, marking the largest m-o-m increase since March 2022. Price indices for all categories increased, with a notable uptick in sugar prices by 10.4 per cent during the month (Chart II.7b). Metal prices increased in September on an improved demand outlook after China, the largest consumer of base metals, announced a slew of stimulus measures to support its economy. The momentum, however, faded in October as metal prices partly reversed their September gains. Gold prices increased by 5.0 per cent (m-o-m) in September to scale record highs, buoyed by the US Fed’s rate cuts and safe haven demand amidst escalating global geopolitical tensions (Chart II.7c). Brent crude oil prices, however, registered a sharp decline of 8.8 per cent (m-o-m) in September - from around $81 per barrel in August to around $74 per barrel in September - as improved supply outlook over Saudi Arabia’s official announcement of unwinding of “voluntary cuts” starting December negated the headwinds emerging from geopolitical tensions and demand concerns. Following the escalation of geopolitical tensions in the Middle East in early October, however, oil prices rebounded, recording an increase of 1.8 per cent from end-September levels to reach US$ 74 per barrel as on October 17, 2024 (Chart II.7d). 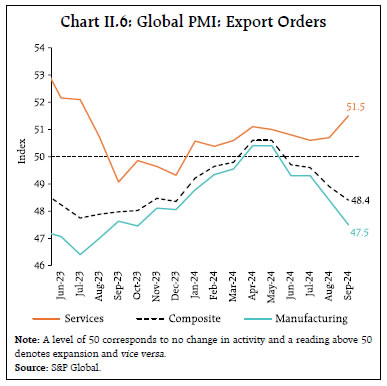
 Inflation continued to moderate across major economies, albeit unevenly. In the US, consumer price index (CPI) inflation eased to 2.4 per cent (y-o-y) in September from 2.5 per cent in August. Inflation in terms of the personal consumption expenditure (PCE) deflator softened to 2.2 per cent in August from 2.5 per cent in July. Headline inflation in the Euro area and the UK decelerated to 1.8 per cent and 1.7 per cent, respectively, in September. Inflation in Japan (CPI excluding fresh food) softened to 2.4 per cent in September (Chart II.8a). Among EMEs, inflation increased in Brazil in September but softened in Russia and China in September and South Africa in August (Chart II.8b). Core and services inflation trended downwards in most AEs; however, it remained higher than the headline (Chart II.8c and 8d). Global equity markets rebounded from the correction in the first week of September, buoyed by the decision of US Fed to reduce the policy rate by 50 bps. The Morgan Stanley Capital International (MSCI) world index recorded a 2.2 per cent (m-o-m) increase in September (Chart II.9a). The MSCI Emerging Markets Index surged by 6.4 per cent as equity markets in China recorded their best week since 2008, following the announcement of stimulus measures in the last week of September. Equity markets in China pared some of its gains in the second week of October amidst market disappointment on economic recovery and anticipated economic stimulus. The US government securities yields on both 10-year and 2-year bonds softened by 12 bps and 28 bps, respectively, in September as markets priced in the Fed rate cut. As yields softened relatively more for 2-year securities, the spread (10-year minus 2-year) reversed and turned positive in September (Chart II.9b). The US 10-year bond yields, however, rebounded to above 4 per cent in early October for the first time since early August as stronger than expected job market data pared expectations of large policy rate cuts. In the currency markets, the US dollar continued to weaken, shedding 0.9 per cent (m-o-m) in September. Concomitantly, the MSCI currency index for EMEs increased by 1.7 per cent in September, mainly due to capital inflows in the equity segment (Chart II.9c and II.9d). In early October, however, the US dollar strengthened sharply on account of safe haven demand over escalation of geopolitical tensions in the Middle East. Concomitantly, EME currencies depreciated in October so far (up to October 17, 2024) 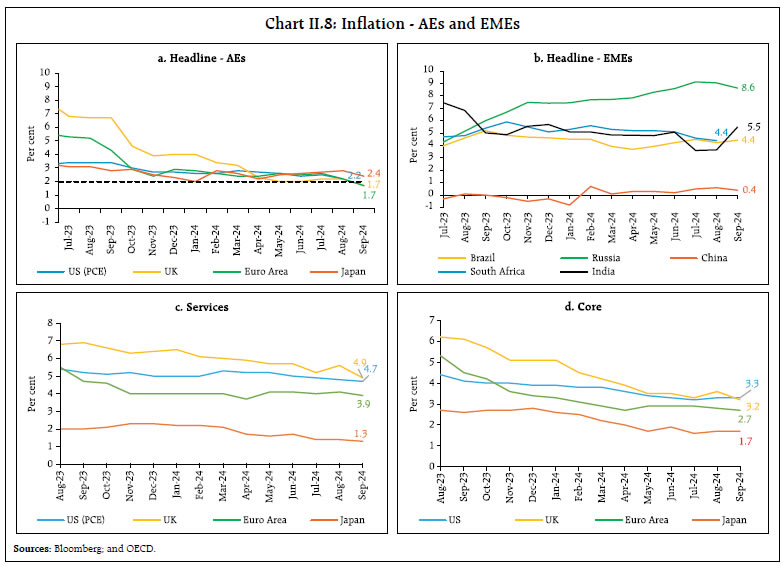 Among AE central banks, Euro area, South Korea and Iceland cut their policy rates by 25 bps while New Zealand cut its benchmark rate by 50 bps in October. Sweden, Switzerland and Czech Republic lowered their benchmark rates by 25 bps each in their September meetings. Australia, however, continued to hold its policy rate unchanged in September (Chart II.10a). Among EME central banks, Thailand and Philippines cut their policy rates by 25 bps in October. In September, South Africa, Mexico and Hungary cut their key rates by 25 bps each, while Colombia reduced its policy rate by 50 bps (Chart II.10b). China announced a series of stimulus measures to resurrect the flagging economy, including a 20 bps cut in the seven-day reverse repo rate, a 30 bps reduction in the medium-term lending facility rate and a 50 bps cut in the reserve requirement ratio.
III. Domestic Developments The Indian economy has exhibited marked resilience in spite of a sequential ebb in momentum in the second quarter of 2024-25 on account of a host of factors mentioned in the Introductory section. According to the latest round of the Reserve Bank’s survey of households, consumer perceptions of the current situation and their future expectations improved sequentially (Chart III.1a). Manufacturers also maintained a positive outlook on capacity utilisation (CU) in the ensuing quarters (Annex 1). Inputs from various industry stakeholders also point towards continued optimisim towards future growth prospects in India (Box 1). Box 1: Feedback from the Reserve Bank’s Industry Monitoring Group (IMG) The Reserve Bank conducts a semi-annual survey of representatives from industry associations, including several industry bodies, credit rating agencies and banks. The major highlights from the September 2024 round of the survey. Consumption -
Consumption of non-durable goods showed buoyancy as growth in rural consumption outpaced urban consumption, particularly in the non-food category. -
Consumer durables registered double digit volume growth, with spending in small towns on premium/ feature-rich segments recording a rise. -
The upcoming festival season is expected to boost demand for consumer products. Investment -
The momentum in investment demand is being driven by infrastructure related sectors and certain manufacturing segments, i.e., chemicals, electronics, semiconductors, automobiles, and green energy. -
With the manufacturing sector’s capacity utilisation ranging between 70 to 80 per cent across industries, a majority of survey respondents expect an improvement in private investment in H2:2024-25. -
Investment has gained traction from the Production Linked Incentive (PLI) scheme and this is expected to extend further in the coming months. -
Global Capability Centers (GCCs) and hospitality are expected to attract more private investment in the services sector. -
The medium-term capital expenditure outlook (2024-2028) remains positive, partly backed by the government’s infrastructure push and substantial investment intentions across critical sectors. Other Growth Propellors -
Rating upgrades continued to outpace downgrades, with a credit ratio of 2.224. Power, real estate, and infrastructure sectors saw improved credit ratios, while auto components, exports, and services experienced moderation. -
Rising demand for emerging technologies, i.e., artificial intelligence (AI); cloud transformation, data analytics; and internet of things (IoT) is expected to drive growth in the information technology segment, with more hiring and better margins. -
Revenue growth in micro, small, and medium enterprises (MSME) sector is expected to be driven by healthcare, consumption, agriculture linked sectors and export-oriented businesses such as textiles and seafood. Credit delinquencies moderated consistently for MSMEs and overall retail segments over the past three years, notwithstanding a marginal rise in credit card and personal loan delinquencies in recent quarters25. |
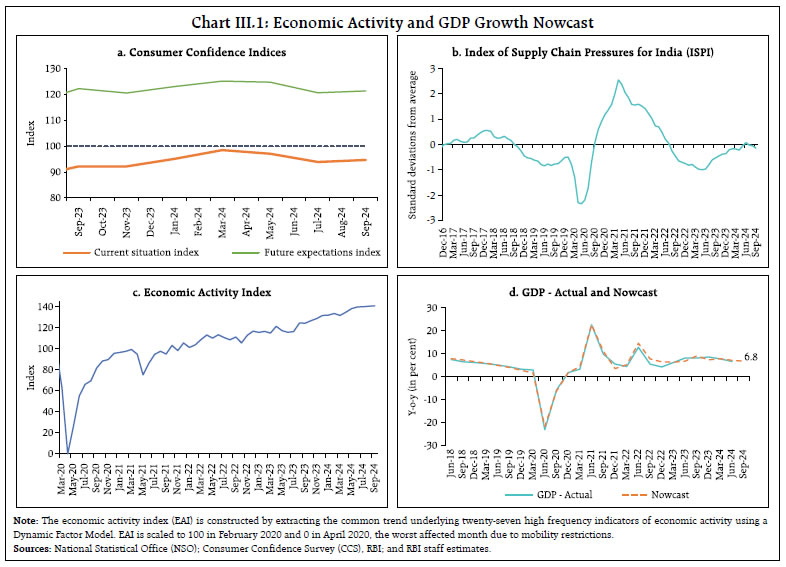 Supply chain pressures eased in September, falling below historical average levels, although they remain vulnerable to geopolitical risks which have escalated in October (Chart III.1b). Our economic activity index (EAI)26, based on a range of high frequency indicators, projects GDP growth at 6.8 per cent in Q2:2024-25 (Charts III.1c and III.1d). Aggregate Demand High-frequency indicators indicate that aggregate demand continued to grow, albeit with a slower momentum than in the preceding quarters. E-way bills continued to record double digit growth in September 2024 (Chart III.2a). Toll collections grew by 6.5 per cent (y-o-y) in September as against 6.8 per cent (y-o-y) in the previous month (Chart III.2b). Automobile sales recorded a growth of 13.1 per cent (y-o-y) in September 2024, supported by two-wheelers (Chart III.3a). Domestic tractor sales also expanded by 3.7 per cent (y-o-y) in September (Chart III.3b). Vehicle registrations contracted in September due to decline in both non-transport and transport vehicles segments (Chart III.3c). Average daily petroleum consumption contracted for the second consecutive month in September 2024, driven by a decline in diesel consumption (Chart III.3d). As per the latest periodic labour force survey (PLFS) report for 2023-24 (July-June), the labour force participation rates (LFPR) and worker population ratio (WPR) increased to 60.1 per cent and 58.2 per cent, respectively, marking their highest levels since the inception of the survey. The unemployment rate remained unchanged at 3.2 per cent in 2023-24 from the previous year27 (Chart III.4a). The overall LFPR increased in both rural and urban areas in 2023-24, driven by a rise in the female LFPR, which rose by 6.1 percentage points in rural areas and 2.6 percentage points in urban areas (Chart III.4b and III.4c). Similar patterns were witnessed in the case of WPR.
The share of regular salaried workers and helpers in household enterprises increased, while the share of casual workers declined (Chart III.5a). The share of employment in the tertiary sector increased (Chart III.5b). As per the purchasing managers’ (PMI) employment indices, organised manufacturing employment recorded its seventh consecutive month of expansion in September 2024, albeit with some moderation. The rate of job creation in the services sector accelerated in September, recording one of the strongest growth in two years (Chart III.6). Households’ demand for work under the Mahatma Gandhi National Rural Employment Guarantee Act (MGNREGA) contracted for the fourth month in a row in September 2024, reflecting higher demand for agriculture labour during the kharif sowing season. On a y-o-y basis, it recorded a decline for the seventh consecutive month, pointing to increased availability of alternative employment opportunities (Chart III.7).
India’s merchandise exports at US$ 34.6 billion grew by 0.5 per cent (y-o-y) in September 2024, supported by a favourable base effect (Chart III.8). Exports of 23 out of 30 major commodities (accounting for 63 per cent of the export basket) expanded on a y-o-y basis in September. Engineering goods, organic and inorganic chemicals, plastic and linoleum, drugs and pharmaceuticals, and ready-made garments (RMG) were the major drivers of exports, while petroleum products, gems and jewellery, iron ore, marine products, and ceramic products and glassware operated as drags (Chart III.9). During April-September 2024, India’s merchandise exports expanded by 1.0 per cent (y-o-y) to US$ 213.2 billion, primarily led by engineering goods, electronic goods, drugs and pharmaceuticals, organic and inorganic chemicals, and RMG, while petroleum products, gems and jewellery, marine products, iron ore, and other cereals restrained overall exports growth.
Exports to 13 out of 20 major destinations expanded in September 2024 and during April-September 2024, with the US, the UAE and the Netherlands being the top 3 export destinations. Merchandise imports at US$ 55.4 billion expanded by 1.6 per cent (y-o-y) in September, despite a sequential contraction which was more than offset by a positive base effect (Chart III.10). Out of 30 major commodities, 20 commodities (accounting for 48.7 per cent of the import basket) registered growth on a y-o-y basis in September. Machinery, electronic goods, non-ferrous metals, chemicals, and gold contributed positively to overall import growth, while POL, pearls, precious and semi-precious stones, vegetable oil, artificial resins, plastic materials, etc., and dyeing, tanning and colouring materials contributed negatively (Chart III.11). During April-September 2024, India’s merchandise imports increased by 6.2 per cent (y-o-y) to US$ 350.7 billion, mainly led by POL, gold, electronic goods, non-ferrous metals, and transport equipment, while pearls, precious and semi-precious stones, chemical material and products, coal, coke and briquettes, fertilisers, and dyeing, tanning and colouring materials contributed negatively.
Imports from 9 out of 20 major source countries expanded in September 2024 on a y-o-y basis. Imports from 14 out of 20 major source countries increased during April-September 2024.
The merchandise trade deficit narrowed to a 5-month low at US$ 20.8 billion in September 2024. The share of POL in the total merchandise trade deficit remained the same at 37.6 per cent in September 2024 as a year ago (Chart III.12). During April-September 2024, India’s merchandise trade deficit widened to US$ 137.4 billion from US$ 119.2 billion a year ago. Petroleum products were the largest source of the deficit, followed by electronic goods (Chart III.13). India’s pharmaceutical industry is the world’s third largest by volume of production28, being a global leader in the supply of diphtheria, tetanus and pertussis (DPT), bacillus calmette–guérin (BCG), and measles vaccines. It is also one of the largest suppliers of low cost vaccines in the world. Drugs and pharmaceuticals are the sixth largest commodities in India’s export basket, with a share of 6.4 per cent in 2023-24. Drug formulations and biologicals have been the largest drivers of drugs and pharmaceuticals exports, with more than a three-fourths share, followed by bulk drugs and drug intermediates (Chart III.14a). In 2023-24, drugs and pharmaceuticals exports increased by 9.7 per cent (y-o-y) to US$ 27.9 billion. In 2024-25 so far (up to August), they grew by 8.2 per cent (y-o-y) to US$ 11.9 billion. The drugs and pharmaceuticals sector yielded a trade surplus, mainly driven by drug formulations and biologicals (Chart III. 14b). 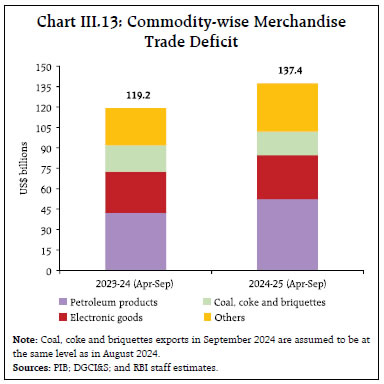 On the renewable energy front, India is the world’s second-largest producer of wind turbine components following China, with a significant share of its manufacturing capacity focused on exports (Chart III.15). Low import dependency is reflective of around 70-80 per cent indigenisation that has been achieved with robust domestic manufacturing (Table III.1). | Table III.1: Manufacturing Capacity of Key Wind Turbine Components | | Component | Global Capacity 2023 in Gigawatt (GW) | India’s Capacity (Share in Global Market in per cent) | | Gearbox | 166.5 | 15.5 (9) | | Generators | 155.6 | 8.25 (5) | | Blades | 156.8 | 12.92 (8) | | Power Converters | 222.7 | 10.6 (5) | | Towers | 38 | 2.8 (7) | | Source: CEEW. |
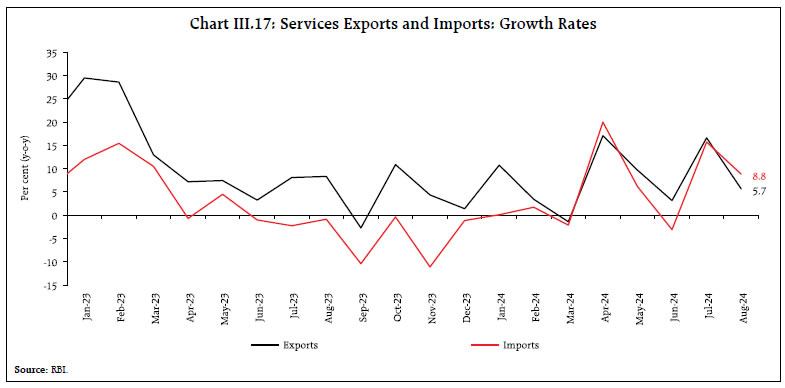
India is a major importer of lithium-ion batteries in the world (Chart III.16). India has a mature but small lithium-ion battery assembly sector, with over 6.5 gigawatt-hour (GWh) of manufacturing capacity. The government has approved the Production Linked Incentive (PLI) scheme for manufacturing advance chemistry cell (ACC) batteries with a total outlay of ₹18500 crores, which is expected to reduce its dependence on imports. Services exports at US$ 30.3 billion grew by 5.7 per cent (y-o-y) in August 2024 and services imports rose by 8.8 per cent (y-o-y) to US$ 16.4 billion (Chart III.17). As a result, net services export earnings increased by 2.2 per cent (y-o-y) to US$ 13.9 billion during the month. 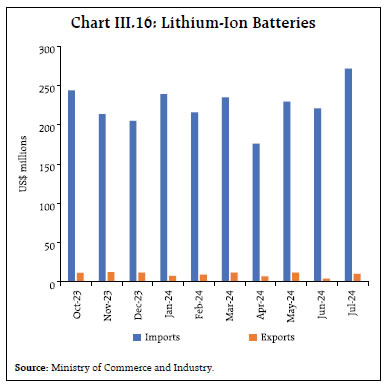
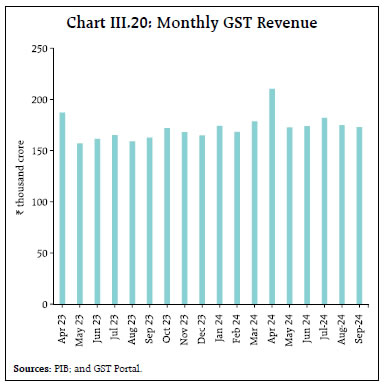
 All major key deficit indicators of the Union government, viz., the gross fiscal deficit (GFD), the revenue deficit (RD), and the primary deficit (PD) recorded an improvement during April-August 2024 [both in absolute terms as well as in proportion to budget estimates (BE)] relative to the corresponding period of the previous year. The GFD stood at 27 per cent of BE in April-August 2024, down from 36 per cent in the corresponding period of the previous year (Chart III.18a and III.18b). Robust growth in revenue receipts during April-August 2024, coupled with a contraction in the total expenditure of the Union government by 1.2 per cent on a y-o-y basis, led to an improvement in the financial position of the Union Government. 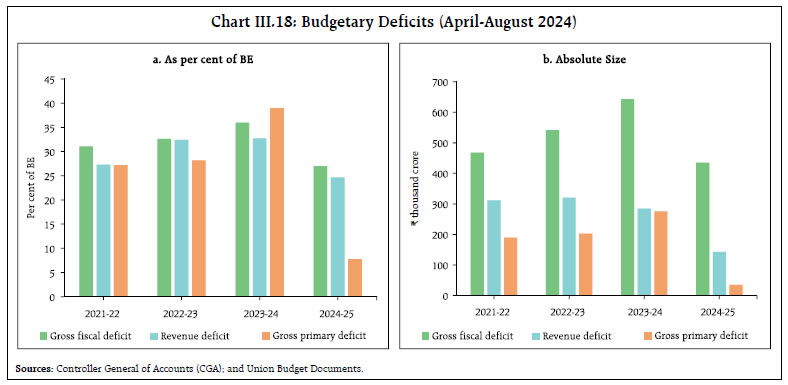 Revenue expenditure moderated to 4.1 per cent during April-August 2024 from a growth of 14.1 per cent recorded in April-August 2023. The outgo on major subsidies contracted marginally by 1.2 per cent, partly owing to a decline in the international price of fertiliser. Similarly, capital expenditure growth recorded a contraction, partly attributable to the model code of conduct imposed due to the general elections held in Q1:2024-25. During July-August 2024, however, capital expenditure rebounded with a y-o-y growth of 25.8 per cent. Further, in September 2024, the government relaxed its cash management guidelines with the objective of boosting expenditure.29 On the receipts side, gross tax revenues recorded a growth of 12.1 per cent during April-August 2024 vis-à-vis a growth of 16.5 per cent in the corresponding period of the previous year. Under direct taxes, income tax collections registered a robust growth rate of 25.5 per cent (y-o-y) [Chart III.19a]. Corporate taxes, however, recorded a decline during the period, although it recovered substantially by mid-September.30 Under indirect taxes, GST collections recorded a growth of 10.2 per cent. With the surplus transfer of ₹2.1 lakh crore by the Reserve Bank, non-tax revenues recorded a growth of 59.6 per cent during April-August 2024 (Chart III.19b). Disinvestment receipts, however, lagged the budgeted target, leading to a contraction of 42.4 per cent in non-debt capital receipts during the concerned period. Overall, the total receipts of the Union government posted a growth of 18.3 per cent in April-August 2024 over their level in the corresponding period of the previous year. Gross GST collections (Centre plus States) for the month of September amounted to ₹1.73 lakh crore, registering a growth of 6.5 per cent on a y-o-y basis (Chart III.20). After accounting for refunds, net GST collections stood at ₹1.52 lakh crore, growing at 3.9 per cent on a y-o-y basis. Further, the cumulative gross GST collections for April-September 2024 stood at ₹10.9 lakh crore, recording a growth of 9.5 per cent over April-September 2023. 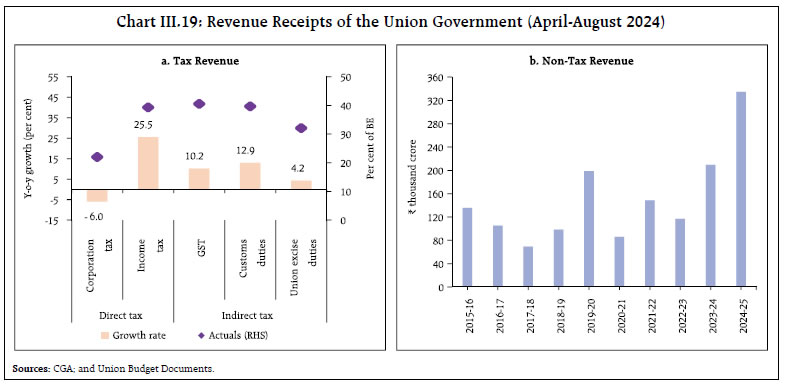
 Provisional data for April-August 2024 indicate that States’ GFD increased to 31.7 per cent of BE from 27 per cent in the previous year (Chart III.21). Revenue receipt growth decelerated due to a decline in tax revenue growth and a contraction in non-tax revenue and grants from the Union government (Table III.2). Growth in States’ goods and services tax (SGST), the largest driver of tax revenue, moderated. Stamp duties and registration fees witnessed robust growth, while sales tax collections showed signs of recovery from a contraction during the same period in the previous year. 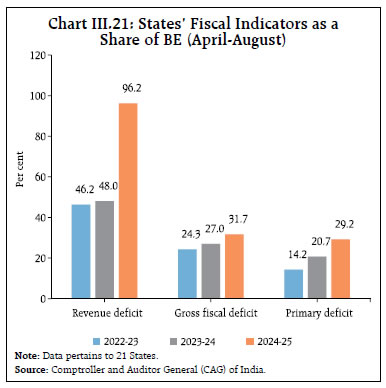
| Table III.2: States’ Key Fiscal Indicators (April-August 2024-25) | | (Per cent) | | | Per cent of BE | Y-o-Y Growth Rate | | 2022-23 | 2023-24 | 2024-25 | 2022-23 | 2023-24 | 2024-25 | | 1. Revenue Receipts | 33.6 | 32.8 | 32.0 | 28.1 | 8.8 | 5.0 | | 1.1. Tax Revenue | 37.1 | 35.9 | 35.4 | 33.0 | 15.7 | 11.4 | | Stamp Duties and registration fees | 40.3 | 36.6 | 38.0 | 43.6 | 15.8 | 16.2 | | GST | 43.6 | 43.9 | 43.3 | 31.7 | 19.0 | 10.3 | | Sales Tax | 40.1 | 34.4 | 35.2 | 20.1 | -2.1 | 4.2 | | State Excise Duties | 37.3 | 36.9 | 34.8 | 27.0 | 12.8 | 5.6 | | 1.2. Non-Tax Revenue | 29.1 | 31.9 | 26.2 | 53.6 | 16.1 | -9.9 | | 1.3. Grants-in-Aid | 24.1 | 20.2 | 15.7 | 10.2 | -27.0 | -33.5 | | 2. Revenue expenditure | 33.9 | 33.2 | 33.8 | 15.6 | 7.7 | 10.4 | | 2.1 Interest Payments | 32.3 | 31.8 | 33.7 | 11.1 | 8.8 | 14.3 | | 3. Capital expenditure | 20.5 | 23.4 | 21.3 | 6.3 | 35.0 | -4.9 | | 3.1 Capital Outlay | 19.6 | 23.8 | 20.3 | 4.4 | 42.3 | -9.4 | Note: Data pertains to 21 States.
Sources: CAG of India; and Budget documents of State governments. | On the expenditure side, revenue expenditure growth increased, while capital expenditure declined during this period. Going forward, capital expenditure is expected to pick up owing to the Union government’s provision of special assistance of ₹1.5 lakh crore long term interest free loans. Aggregate Supply The final estimates of foodgrains production for 2023-24 stood at a record 332.3 million tonnes, which was 0.8 per cent higher than the final estimates for 2022-23, despite 2023 being an El Niño year with below normal monsoon. Increases in the production of wheat and rice more than compensated for the decline in pulses and coarse cereals production (Chart III.22). As per the 3rd advance estimates (AE) for 2023-24, horticultural crop production declined (for the first time since 2002-03) to 353.2 million tonnes, driven down by declines in the production of onions and potatoes by 19.7 per cent and 5.1 per cent, respectively (Chart III.23). Deficient rainfall and heat waves associated with El Niño weather conditions adversely affected horticulture crop production during 2023-24. 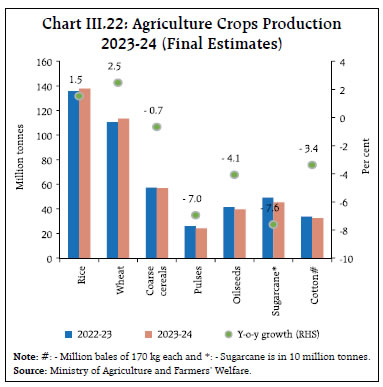 The 2024 southwest monsoon (SWM) ended with above-normal rainfall at 108 per cent of the long period average (LPA), the highest since 2020. It was in line with the India Meteorological Department’s (IMD’s) long range forecast for 2024 SWM (June-September). The rainfall was 7 per cent, 19 per cent, and 14 per cent above the LPA in northwest, central, and southern peninsula, respectively, but it was 14 per cent below the LPA in east and northeast India. Out of 36 subdivisions, 33 received normal or above normal rainfall this year, an increase from 29 subdivisions last year (Chart III.24). The production weighted rainfall index (PRN) stood at 107 per cent of the LPA and it remained above normal for other major crops except rice for which it was normal (Chart III.25). Notably, PRNs for all key crops during this season exceeded their respective five-year averages (Chart III.26). The high spatial dispersion of rainfall observed in the early part of the monsoon season declined from mid-July onwards as rainfall activity became broad based (Chart III.27).
Water levels in reservoirs at 87 per cent of the total capacity as on October 17, 2024 was 19.9 per cent and 14.7 per cent higher than last year and the decadal average, respectively (Chart III.28). As on September 27, 2024, the total kharif sown area stood at 1108.6 lakh hectares (101.1 per cent of full season normal area), higher than last year and the normal area (Chart III.29). Except cotton, the area under all crops has increased over last year.
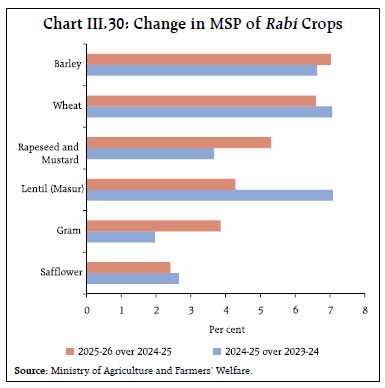
Minimum support prices (MSP) for the rabi marketing season (April 2025 to March 2026) were increased in the range of 2.4 per cent (for Safflower) to 7.0 per cent (for Barley) [Chart III.30]. Significant increases in MSP were announced for rapeseed and mustard at ₹300 per quintal, as well as for lentil (Masur) at ₹275 per quintal. This is in line with the recent policies announced by the government to boost oilseeds and pulses production and reduce the import dependency.
As per the IMD’s recent forecast for post-monsoon season (October-December), rainfall is most likely to be above normal (>112 per cent of LPA) over the south peninsula31. So far, the cumulative rainfall has been 1 per cent below the LPA during the current Northeast monsoon (NEM) season (October 01-18). Forecasts indicate an increased likelihood of La Niña conditions developing during the post-monsoon season, which augurs well for the rabi sowing (Chart III.31). 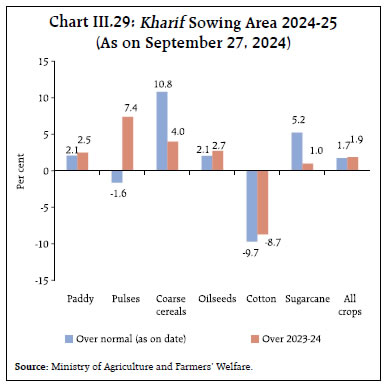
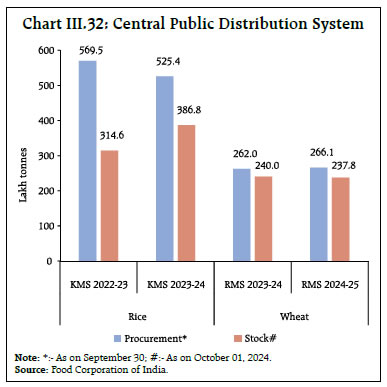
 The stock of rice with the Food Corporation of India (FCI) stood at 387 lakh tonnes as on October 01, 2024 which was 23.0 per cent higher than on the corresponding date last year. The government procured 525.4 lakh tonnes of rice in the kharif marketing season (KMS) 2023-24, which was 7.7 per cent lower than in last year’s season. In view of the ample stock of rice and moderating retail prices, the government amended the export policy for non-basmati white rice from prohibited to free on September 28, 2024, subject to a minimum export price (MEP) of US$ 490 per tonne. In the case of wheat, the government procured 266 lakh tonnes in the rabi marketing season (RMS) 2024-25, which was 1.6 per cent higher than in the last season. The stock of wheat at 238 lakh tonnes (as on October 01, 2024) remained 0.9 per cent lower than last year. The government revised downward the stock limit on wheat for traders, retailers, and processors to increase its availability and curb prices. The buffer norm for rice and wheat stock for October-December quarter was 102.5 lakh tonnes and 205.2 lakh tonnes, respectively (Chart III.32). 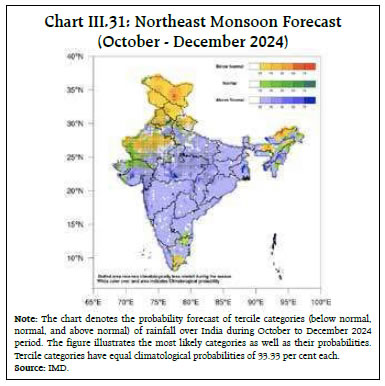
 India’s manufacturing PMI eased in September due to deceleration in the pace of expansion in new orders, employment and output (Chart III.33a). The services sector PMI also moderated to ten-month low in September due to a slowdown in new business activity (Chart III.33b). Business expectations in the manufacturing sector showed signs of moderation, while the services sector exhibited an improvement.
On the renewable energy front, India has built 6.6 gigawatt (GW) of indigenous solar cell manufacturing capacity in 2023. India is likely to develop a significant manufacturing presence in polysilicon, ingots wafers, cells and module manufacturing once the manufacturing capacity allotted under the Production Linked Incentive (PLI) scheme32 comes online (Chart III.34). Port traffic increased by 5.9 per cent (y-o-y) in September 2024, driven by other miscellaneous cargo, petroleum, oil and lubricants (Chart III.35a). Railway freight traffic, on the other hand, recorded a y-o-y decline in August, led by coal and cement (Chart III.35b).
Within the construction sector, steel consumption expanded by 10.5 per cent (y-o-y) in September. Cement production, however, declined by 3.0 per cent in August 2024 (Chart III.36). Available high frequency indicators for the services sector reflect the resilience of activity in September 2024, supported by rural demand, domestic air passenger traffic and steel consumption (Table III.3). Inflation Headline inflation, as measured by y-o-y changes in the all-India CPI33, increased to a nine-month high of 5.5 per cent in September 2024 from 3.7 per cent in August 2024 (Chart III.37). The sharp increase in inflation of 1.75 percentage points came from a positive momentum of 60 bps and an unfavourable base effect of 115 bps. All CPI sub-groups – food; fuel and lights; and core (CPI excluding food and fuel) – showed positive momentum, registering m-o-m increases of 1.0 per cent, 0.1 per cent, and 0.3 per cent, respectively. Food inflation increased y-o-y to 8.4 per cent in September from 5.3 per cent in August, driven up by a positive momentum and an unfavourable base effect. In terms of sub-groups, inflation in vegetables, fruits, milk and products, non-alcoholic beverages and prepared meals picked up while that in cereals, meat and fish, eggs, pulses and sugar moderated (Chart III.38). Price of edible oils and fats moved out of deflation after 19 consecutive months, while deflation in spices prices deepened. Fuel and light deflation narrowed significantly to (-)1.4 per cent in September from (-)5.3 per cent in August, driven by electricity, firewood, and chips prices and a lower rate of deflation in LPG prices reflecting the dissipation of the impact of the 16 per cent reduction in these prices a year ago. Kerosene prices, on the other hand, moved back into deflation. Core inflation firmed up to 3.6 per cent in September from 3.3 per cent in August. Price growth increased in respect of housing, household goods and services, transport and communication, and personal care and effects while it remained steady for sub-groups such as clothing and footwear, and health. Prices of recreation and amusement, education and pan, tobacco and intoxicants, however, recorded a moderation in growth (Chart III.39). In terms of regional distribution, inflation hardened in both rural and urban areas in September, with rural inflation at 5.9 per cent being higher than urban inflation at 5.0 per cent. Majority of the states registered inflation close to 6 per cent (Chart III.40).
High frequency food price data for October so far (up to 17th) show a moderation in the prices of cereals (mainly for rice) and pulses (except for gram dal). Edible oil prices continued to record a broad based hardening after the import duty was hiked by 20 percentage points in September 2024. Among key vegetables, potato prices softened, while those of onions and tomatoes recorded a steep increase (Chart III.41).
The government scrapped the US$ 550 a tonne minimum export price on onions (introduced on May 03, 2024) and the export duty was reduced from 40 per cent to 20 per cent in September. These changes could have led to higher export demand, putting upward pressure on domestic prices. The production of both onion and tomato crops during the kharif season is, however, expected to be robust on account of favourable monsoon conditions, which may bring about downward pressure on prices (Chart III.42). Retail selling prices of petrol and diesel remained unchanged in October so far (up to 17th). LPG prices were also kept unchanged while kerosene prices continued to decline (Table III.4). The PMIs for September 2024 indicated that the rate of expansion of input costs across both manufacturing and services firms increased, following a moderation in August. On the other hand, selling price pressures across manufacturing firms eased to a four-month low, while the services sector recorded the slowest expansion in selling prices in the last 31 months (Chart III.43).
In the latest bi-monthly round of the RBI’s survey, households’ inflation expectations moderated by 20 bps and 10 bps for the 3-months and one-year horizons, respectively. Respondents’ perception of current inflation has been generally on a declining trend since September 2022, barring two episodes of marginal increase (Chart III.44). | Table III.4: Petroleum Products Prices | | Item | Unit | Domestic Prices | Month-over-month (per cent) | | Oct-23 | Sep-24 | Oct-24^ | Sep-24 | Oct-24^ | | Petrol | ₹/litre | 102.92 | 100.97 | 100.97 | 0 | 0 | | Diesel | ₹/litre | 92.72 | 90.42 | 90.42 | 0 | 0 | | Kerosene (subsidised) | ₹/litre | 57.95 | 45.78 | 42.93 | -1.9 | -6.2 | | LPG (non-subsidised) | ₹/cylinder | 913.25 | 813.25 | 813.25 | 0 | 0 | ^: For the period October 1-17, 2024.
Note: Other than kerosene, prices represent the average Indian Oil Corporation Limited (IOCL) prices in four major metros (Delhi, Kolkata, Mumbai and Chennai). For kerosene, prices denote the average of the subsidised prices in Kolkata, Mumbai and Chennai.
Sources: IOCL; Petroleum Planning and Analysis Cell (PPAC); and RBI staff estimates. |
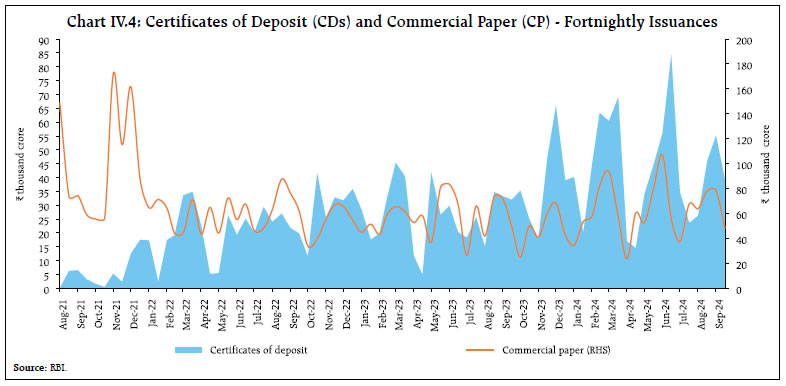
IV. Financial Conditions In the bimonthly monetary policy meeting of October 2024, the Monetary Policy Committee (MPC) decided to keep the policy repo rate unchanged at 6.50 per cent by a majority of 5:1. In a unanimous decision, the MPC changed the stance to neutral from withdrawal of accommodation while remaining unambiguously focused on a durable alignment of inflation with the target, while supporting growth. System liquidity mostly remained in surplus during September-October so far (up to October 17), owing to a pickup in government spending and the return of currency to the banking system. There was, however, a brief period of liquidity deficit during the latter half of September (September 21-25) on account of advance tax payments and GST related outflows. Overall, the average daily net absorption under the liquidity adjustment facility (LAF) was ₹1.2 lakh crore during September 16 to October 17, 2024, as against ₹1.53 lakh crore during August 16 and September 15, 2024 (Chart IV.1). In view of the evolving liquidity conditions, the Reserve Bank conducted one main and three fine-tuning variable rate repo (VRR) operations during September 17-24, cumulatively injecting ₹2.1 lakh crore into the banking system to provide adequate liquidity. As liquidity returned to the banking system, one main and six fine-tuning variable rate reverse repo (VRRR) auctions were conducted to mop up surplus liquidity amounting to ₹4.1 lakh crore during September 30 to October 17, 2024. Banks continue to show reluctance in parting with liquidity for longer tenors, as evidenced by lower offer-cover ratios in the main operation. Of the average total absorption of ₹1.54 lakh crore during September 16 to October 17, 2024, placement of funds under the standing deposit facility (SDF) accounted for 68 per cent. Average daily borrowings under the marginal standing facility (MSF) increased to ₹0.08 lakh crore during September 16 to October 17, 2024 from ₹0.05 lakh crore during August 16 and September 15, 2024. 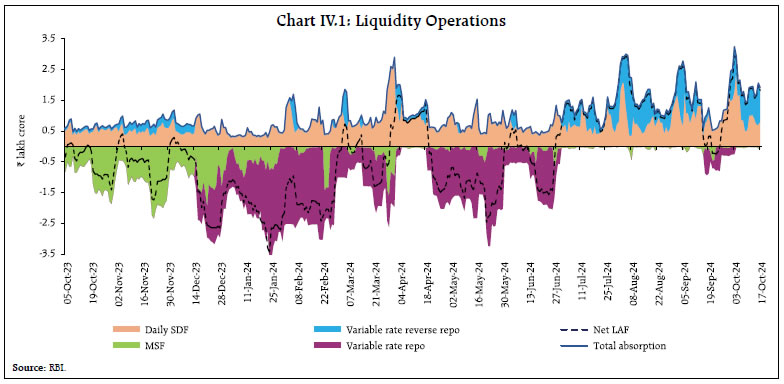 The weighted average call rate (WACR) averaged 6.50 per cent during September 16 to October 17 as compared with 6.52 per cent during August 16 to September 15, 2024 (Chart IV.2a). The WACR, however, firmed up and traded above the policy repo rate for a brief period (September 21-25) on account of liquidity deficit in the banking system due to reasons discussed earlier. On September 30, the WACR spiked by 15 bps on account of the usual half year end tightness brought about by (i) banks reducing their exposure in the uncollateralised market, which lowers their requirements of provisioning for capital adequacy; and (ii) mutual funds (MFs) reducing their lending in the tri-party repo segment because of redemption pressures. These circumstances notwithstanding, the WACR remained within the policy corridor. In the collateralised segment, the tri-party repo rate moved in tandem with the WACR, averaging 11 bps below the policy repo rate during the same period (Chart IV.2b). 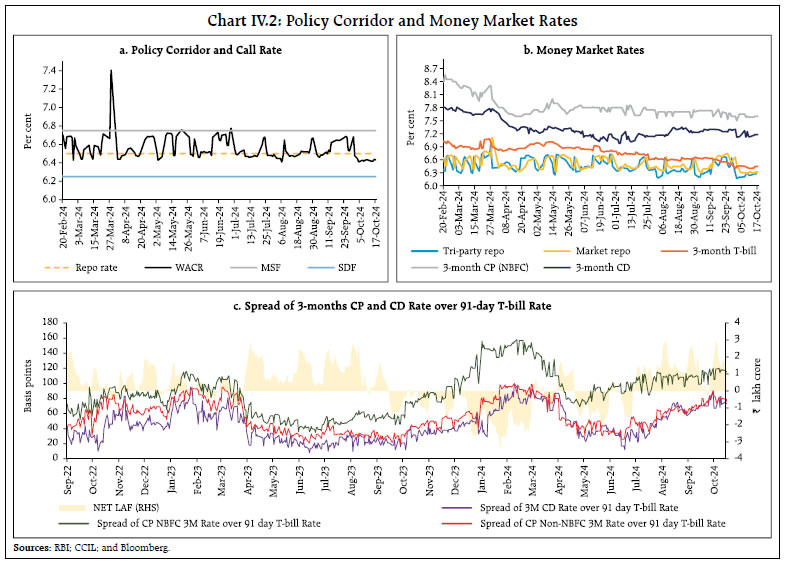 In the short-term money market segment, yields on 3-month treasury bills (T-bills) softened during September 16 and October 17 on account of lower short-term borrowing requirements of the Government, as reflected in cancellation of T-bill auctions in the second half of September. Rates on 3-month commercial paper (CPs) issued by NBFCs and 3-month CDs have eased during the same period (Chart IV.2b). The average risk premium in the money market (spread between 3-month CP and 91-day T-bill rates) was at 113 bps during the period September 16 – October 17, 2024, 6 bps higher than during August 16 to September 15, 2024. In the secondary market, the spread of 3-month CP (NBFC) and CD rates over the 91-day T-bill rate stood at 115 bps and 73 bps, respectively, during October 2024 (upto October 17), higher than 71 bps and 28 bps a year ago (Chart IV.2c). Though the spreads in general tend to ease during periods of surplus liquidity, they have increased in recent months, mainly due to a fall in 91-Day T-Bill rates. The weighted average discount rate (WADR) of CPs and weighted average effective interest rate (WAEIR) of CDs generally evolved in line with monetary conditions (Chart IV.3). The WADR stood at 7.51 per cent in October 2024 (upto October 15), higher than 7.45 per cent during the corresponding period of previous year. Also, WAEIR increased to 7.27 per cent (upto October 17, 2024) from 7.23 per cent a year ago, reflecting the large volume of CD issuances. In the primary market, CD issuances grew by 69 per cent (y-o-y) to ₹5.58 lakh crore during 2024-25 (up to October 4) as banks turned to the CD market for their funding requirements (Chart IV.4). Banks prefer to bridge the funding gap through issuances of short-term CDs rather than raising deposit rates. CP issuances stood at ₹8.0 lakh crore during 2024-25 (up to October 15), higher than ₹7.34 lakh crore in the corresponding period of the previous year. With the Reserve Bank increasing risk weights on bank loans to NBFCs, CP issuances by NBFCs increased as they looked towards diversifying their funding sources. 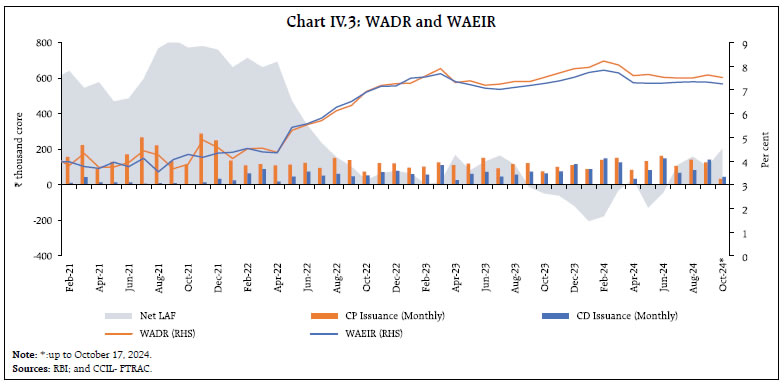
 In the fixed income segment, domestic bond yields generally softened in September on account of benign domestic inflation, improved global investor sentiment, falling US treasury yields and decline in crude oil prices, but they exhibited some hardening in early October. The yield on the 10-year Indian benchmark government security (G-sec) moved in a range of 6.72 - 6.85 per cent during September 16 – October 17, 2024 (Chart IV.5a). The average term spread (10-year minus 91-day T-bills) remained stable at 29 bps during September 16 – October 17, as compared with 23 bps during August 16 - September 15. G-sec yield broadly remained stable across the mid-segment (except 10-year) of the term structure. (Chart IV.5b). The spread of 10-year Indian G-sec yield over that of 10-year US bonds has remained range-bound, after falling to a 17-year low in October 2023. As on October 18, 2024, the spread stood at 271 bps as against 243 bps a year ago. The volatility of yields in the Indian bond market has been low compared to that of the US treasury market, though both have risen since August 2024. The unwinding of yen carry trade and uncertainty regarding magnitude and timing of monetary policy easing provided upsides (Chart IV.6).
Corporate bond yields moderated in tandem with softening G-sec yields. Risk premia generally remained unchanged (except for 1-year AAA category) during September 16 - October 15, 2024 (Table IV.1). Corporate bond issuances were ₹79,856 crore during August 2024 as compared with ₹49,329 crore a year ago. During 2024-25 (up to August), however, corporate bond issuances were marginally lower at ₹3.3 lakh crore than ₹3.4 lakh crore during the same period of the previous year. Reserve money (RM) excluding the first-round impact of change in the cash reserve ratio (CRR) recorded a growth of 7.0 per cent (y-o-y) as on October 11, 2024 (6.1 per cent a year ago) [Chart IV.7]. Growth in currency in circulation (CiC), the largest component of RM, increased to 6.7 per cent (y-o-y) as on October 11, 2024 from 3.0 per cent as on May 17, 2024, on account of the base effect of the withdrawal of ₹2000 banknotes34 – 98 per cent has returned to the banking system, mostly in the form of deposits (as on September 30, 2024). | Table IV.1: Financial Markets - Rates and Spread | | | Interest Rates (per cent) | Spread (bps) (Over Corresponding Risk-free Rate) | | Instrument | Aug 16, 2024 – Sept 15, 2024 | Sept 16, 2024 – Oct 15, 2024 | Variation | Aug 16, 2024 – Sept 15, 2024 | Sept 16, 2024 – Oct 15, 2024 | Variation | | 1 | 2 | 3 | (4 = 3-2) | 5 | 6 | (7 = 6-5) | | Corporate Bonds | | | | | | | | (i) AAA (1-year) | 7.94 | 7.83 | -11 | 112 | 117 | 5 | | (ii) AAA (3-year) | 7.81 | 7.74 | -7 | 95 | 95 | 0 | | (iii) AAA (5-year) | 7.75 | 7.65 | -10 | 85 | 83 | -2 | | (iv) AA (3-year) | 8.56 | 8.49 | -7 | 170 | 170 | 0 | | (v) BBB- (3-year) | 12.14 | 12.07 | -7 | 528 | 528 | 0 | Note: Yields and spreads are computed as averages for the respective periods.
Sources: FIMMDA; and Bloomberg. |
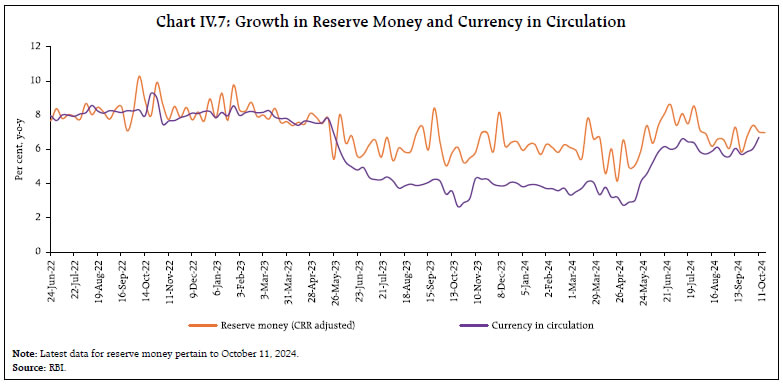 On the sources side (assets), RM comprises net domestic assets (NDA) and net foreign assets (NFA) of the Reserve Bank. Foreign currency assets (accounting for more than 90 per cent of NFA) increased by 19.8 per cent (y-o-y) as on October 11, 2024. Gold – the other major component of NFA – grew by 52.1 per cent, the highest since August 2020, mainly due to revaluation gains from rising gold prices (Chart IV.8). Money supply (M3) rose by 11.0 per cent (y-o-y) as on October 4, 2024 (same as a year ago).35 Aggregate deposits with banks, accounting for around 87 per cent of M3, increased by 11.7 per cent (12.2 per cent a year ago). Scheduled commercial banks’ (SCBs’) credit growth stood at 14.1 per cent as on October 4, 2024 (14.7 per cent a year ago) [Chart IV.9].
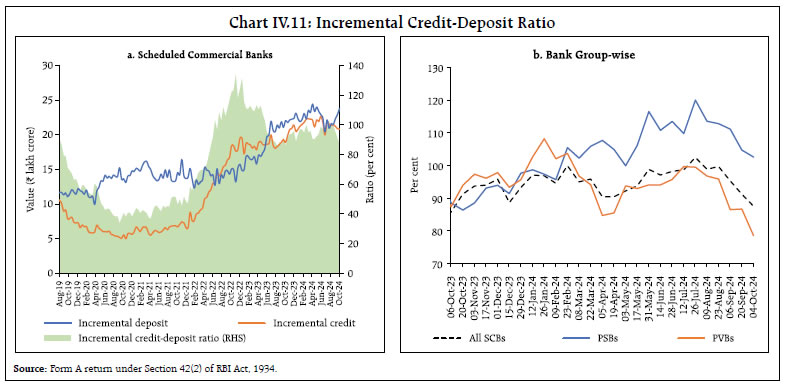
SCBs’ deposit growth (excluding the impact of the merger), which witnessed an increase in the wake of withdrawal of ₹2000 banknotes, continued to remain in double digits since April 2023 (Chart IV.10). While SCBs’ incremental credit-deposit (CD) ratio declined from 95.8 as at end-March 2024 to 87.5 as on October 4, 2024, there has been a narrowing of the gap between credit and deposits (Chart IV.11a). For public and private sector banks, the incremental CD ratio stood at 102.5 per cent and 78.5 per cent (88.5 per cent and 87.4 per cent a year ago), respectively, as on October 4, 2024 (Chart IV.11b). With the statutory requirements for CRR and statutory liquidity ratio (SLR) at 4.5 per cent and 18 per cent, respectively, around 77 per cent of deposits were available with the banking system for extending credit as on October 4, 2024. 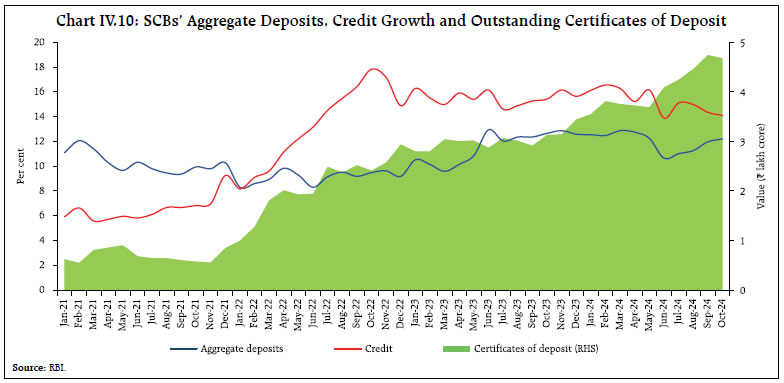
 In response to the 250 bps hike in the policy repo rate since May 2022, banks have revised upwards their repo-linked external benchmark-based lending rates (EBLRs) by a similar magnitude. The median 1-year marginal cost of funds-based lending rate (MCLR) of SCBs has increased by 170 bps during May 2022 to September 2024. Consequently, the weighted average lending rates (WALRs) on fresh and outstanding rupee loans have increased by 190 bps and 119 bps, respectively, during May 2022 to August 2024. On the deposit side, the weighted average domestic term deposit rates (WADTDRs) on fresh and outstanding rupee term deposits of SCBs increased by 243 bps and 190 bps, respectively, during the same period (Table IV.2). Transmission across bank groups indicates that the increase in the WALR on fresh rupee loans was higher in the case of public sector banks (PSBs) vis-à-vis private banks; however, in the case of deposits, it was higher for PSBs during the same period (Chart IV.12). | Table IV.2: Transmission to Banks’ Deposit and Lending Rates | | (Variation in bps) | | | | Term Deposit Rates | Lending Rates | | Period | Repo Rate | WADTDR – Fresh Deposits | WADTDR- Outstanding Deposits | EBLR | 1-Yr. MCLR (Median) | WALR - Fresh Rupee Loans | WALR- Outstanding Rupee Loans | | Easing Phase Feb 2019 to Mar 2022 | -250 | -259 | -188 | -250 | -155 | -232 | -150 | | Tightening Period May 2022 to Aug* 2024 | +250 | 243 | 190 | 250 | 170 | 190 | 119 | Notes: Data on EBLR pertain to 32 domestic banks.
*: Data on EBLR and MCLR pertain to September 2024.
WALR: Weighted Average Lending Rate; WADTDR: Weighted Average Domestic Term Deposit Rate;
MCLR: Marginal Cost of Funds-based Lending Rate; EBLR: External Benchmark based Lending Rate.
Source: RBI staff estimates. |
The Government of India kept rates on small savings schemes unchanged for Q3:2024-25.36 Rates on most of the small savings instruments are now above the formula based rates, except rates on public provident funds and post office recurring deposits.37 During September-October 2024 so far, Indian equity markets registered losses, with the BSE Sensex decreasing by 1.4 per cent to close at 81,225 on October 18, 2024 (Chart IV.13). After remaining rangebound in the first half of September, the BSE Sensex experienced a bullish run to breach the historical 85,000 mark, mostly supported by cues from global markets. Thereafter, the markets exhibited a declining bias as domestic sentiments remained subdued amidst escalation of geopolitical conflicts in the Middle East, rise in crude oil prices and media reports of portfolio outflows from other Asian EMEs to China. Weaker-than-expected corporate earnings releases for Q2:2024-25 also weighed on the sentiment in domestic equity markets. During September, FPIs remained net buyers in the domestic equity markets but turned net sellers in October (up to October 16, 2024) amid risk-off sentiment. 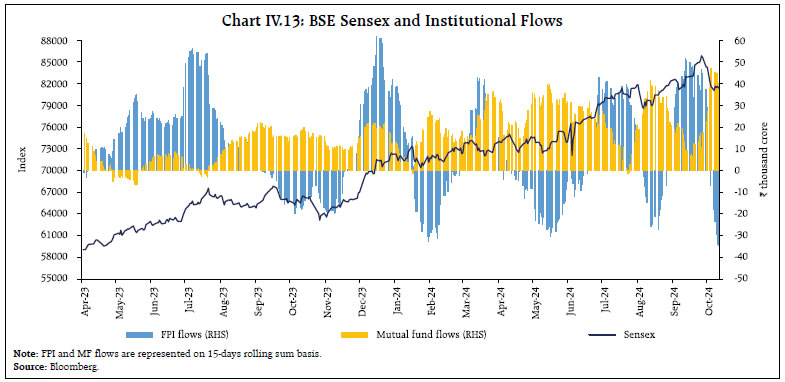
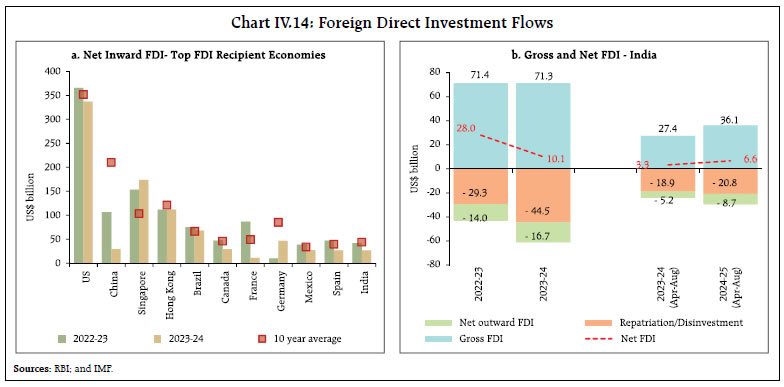 Net FDI inflows has moderated across the top FDI recipient economies (Chart IV.14a). During 2024-25, FDI flows to India recorded signs of revival as gross inward FDI during April-August 2024 increased to US$ 36.1 billion from US$ 27.4 billion a year ago, while net FDI at US$ 6.6 billion during April-August 2024 more than doubled from a year ago (Chart IV.14b). Around two-thirds of the gross FDI inflows were directed towards manufacturing, financial services, communication services, and electricity and other energy sectors. About three-fourths of the flows were sourced from Singapore, Mauritius, the UAE, the Netherlands, and the US. Net foreign portfolio investment (FPI) inflows to the tune of US$ 9.6 billion in September 2024 rose to their highest level since December 2020 (Chart IV.15a). Net FPI inflows in the equity segment accelerated in September 2024 to a nine-month high level to US$ 5.9 billion, boosted by the rate cut in the US, unwinding of Yen carry trade, and optimistic domestic growth prospects. Among peer EMEs, Indian equities received the highest inflows after China in September (Chart IV.15b). The debt segment continues to receive steady FPI inflows to the tune of US$ 23.5 billion since October 2023, following the announcement of the inclusion of Indian sovereign bonds in JP Morgan’s Government Bond Index – Emerging Markets (GBI-EM). Among sectors, financial services and telecommunications received the highest FPI inflows during September. Net FPI outflows amounted to US$ 7.9 billion during October 2024 (up to October 16), triggered by rising risk-off sentiment globally. 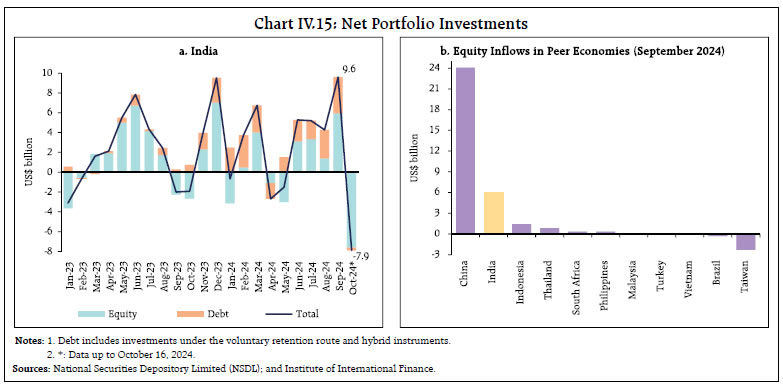 Net accretions to non-resident deposits rose to US$ 7.8 billion during April-August 2024 from US$ 3.7 billion a year ago, led by accretions to all three accounts, namely, Non-Resident (External) Rupee Accounts [NR(E)RA], Non-Resident Ordinary (NRO) and Foreign Currency Non-Resident [FCNR(B)] accounts. During April-August 2024, both registrations (US$ 20.6 billion) and gross disbursements (US$ 16.1 billion) of external commercial borrowings (ECBs) were lower than in the corresponding period last year (Chart IV.16a). Adjusting for principal repayments, net ECB inflows (US$ 5.4 billion) in 2024-25 so far were lower than in the corresponding period previous year. The overall cost of ECBs rose by 37 bps during April-August 2024 over the corresponding period last year. The weighted average interest margin (WAIM) over the benchmark rates increased by 14 bps during April-August 2024 vis-à-vis the corresponding period last year (Chart IV.16b). Two-fifths of the total ECB loans raised during April-August 2024 were for capital expenditure purposes (including on-lending and sub-lending for capex) [Chart IV.16c]. India’s foreign exchange reserves reached a historical high of US$ 704.9 billion on September 27, 2024. As on October 11, it stood at US$ 690.4 billion, covering for 11.8 months of imports and more than 101 per cent of total external debt outstanding at end-June 2024 (Chart IV.17a). During 2024 so far (as on October 11), India’s foreign exchange reserves increased by US$ 68.0 billion, second only to China among major foreign exchange reserves holding countries (Chart IV.17b). The Indian rupee (INR) remained the least volatile major currency during September 2024, depreciating by 0.1 per cent (m-o-m) vis-à-vis the US dollar (Chart IV.18). In terms of the 40-currency real effective exchange rate (REER), the INR depreciated by 0.3 per cent (m-o-m) in September 2024 as depreciation of the INR in nominal effective terms more than offset positive relative price differentials (Chart IV.19).
India’s current account balance (CAB) recorded a deficit of 1.1 per cent of GDP in Q1:2024-25 as against a surplus of 0.5 per cent in the preceding quarter (Q4:2023-24) and a deficit of 1.0 per cent a year ago (Q1:2023-24). The widening of the current account deficit in Q1:2024-25 from a year ago was mainly due to a rise in the merchandise trade deficit, while services exports and remittance receipts improved over the period. There was an accretion of US$ 5.2 billion to the foreign exchange reserves (excluding valuation effects) in Q1:2024-25 as compared to US$ 24.4 billion in Q1:2023-24 (Chart IV.20). At end-June 2024, India’s external debt at US$ 682.3 billion stood at 18.8 per cent of GDP, slightly lower than 18.9 per cent at end-March 2024 (Chart IV.21a). India’s external sector remains resilient as indicated by sustainable levels of key external indicators at end-June 2024 (Chart IV.21b). India’s net international investment position (IIP) increased by US$ 6.7 billion during Q1:2024-25 due to a rise in foreign-owned financial assets in India vis-à-vis residents’ overseas financial assets. However, the ratio of India’s international assets to international liabilities improved to 74.1 per cent in June 2024 compared to 71.3 per cent in June 2023, indicating a stronger external position than a year ago (Chart IV.21c).
Payment Systems Digital transactions continued advancing across various payment modes in September 2024 (Table IV.3). The Real Time Gross Settlement (RTGS) reached ₹177.8 lakh crore during the month–the highest in 2024-25 so far. Among the retail modes, transactions under the Unified Payments Interface (UPI), the National Electronic Funds Transfer (NEFT) and the National Automated Clearing House (NACH) posted double digit growth (y-o-y) in September. UPI scaled a new high of 15 billion transactions in the month, while its average ticket size declined to ₹1,372, indicating growing adoption of digital modes for small-value transactions. This is further corroborated by the bulk of the peer-to-merchant (P2M) and peer-to-peer (P2P) UPI volumes falling under the ‘less than ₹500’ transaction band. Credit card issuances rose by 15 per cent in August 2024, bringing the total to 10.5 crore cards. Overall, in H1:2024-25, total digital payments increased (y-o-y) by 38 per cent (43 per cent in 2023-24) in volume and 19 per cent (15 per cent 2023-24) in value.38 Various initiatives aimed at leveraging digital platforms for efficient disbursement of funds were introduced in September. The National Payments Corporation of India (NPCI) has enabled e-RUPI vouchers through the Bharat Interface for Money (BHIM) app for artisans under the PM Vishwakarma Scheme to disburse the scheme amount, promoting the adoption of digital payment modes.39 Similarly, the Central Bank Digital Currency (CBDC) pilot project has been integrated with a state government scheme for efficient fund transfer.40 As part of ongoing efforts to internationalise UPI, NPCI International Payments Limited (NIPL) has partnered with the Ministry of Digital Transformation of Trinidad and Tobago to develop a real-time payments platform, making it the first Caribbean nation to adopt India’s home-grown payment mode.41 In the Statement on Developmental and Regulatory Policies announced on October 09, 2024, the Reserve Bank increased the per-transaction limit for UPI123 Pay to ₹10,000 (from ₹5,000) and for the UPI Lite wallet to ₹1,000 (from ₹500). Additionally, the overall limit for UPI Lite was raised to ₹5,000 (from ₹2,000). It has also been proposed to introduce a ‘beneficiary account name look-up facility’ for RTGS and NEFT transactions to boost customer confidence and reduce the risk of wrong credits and frauds.42 V. Conclusion Going forward, uncertainty surrounding global economic prospects could persist in the near term with heightened geopolitical tensions in the Middle East. Increase in commodity prices, especially of crude oil and metals, raise pass-through risks for net importer countries. The future course of monetary policy the world over would, therefore have to take into account the risks to both growth and inflation from recent commodity price shocks. The response of the Chinese economy to the stimulus measures announced also remains unclear, complicating the outlook for the global economy. In India, aggregate demand is poised to shrug off the temporary slowdown in momentum in the second quarter of 2024-25 as festival demand picks up pace and consumer confidence improves. Rural demand is expected to get a boost from the improved agricultural outlook. Private investment should pick up steam in response to signs of pick-up in consumption demand and rising business optimism. With the financial sector ready to intermediate resources for productive investment, buffered by healthy balance sheets, and the government’s continued thrust on capex, the investment outlook appears bright. The ongoing strengthening of global trade43 could provide fillip to external demand for India’s exports although escalation of geopolitical tensions remains a potential threat. In terms of aggregate supply, above normal rainfall in the monsoon season augurs well for overall kharif production in the country as well as for reservoir storage, which brightens the rabi season outlook. The increased likelihood of La Niña conditions developing during the post-monsoon season of 2024 is beneficial for overall precipitation, although the possibility of excessive rainfall damaging the standing kharif crops remains a risk. Liquidity conditions remain in surplus mode. The Reserve Bank will continue to be nimble and flexible in its liquidity management operations and will deploy an appropriate mix of instruments to modulate both frictional and durable liquidity so as to ensure that interest rates evolve in an orderly manner.44 Indian equity markets have scaled fresh peaks in the current year on strong macroeconomic fundamentals and long-term growth potential. Concerns, however, remain around stretched valuations and uncertainty surrounding geopolitical conflicts in the Middle East which got reflected in the pullback witnessed in October. Markets are likely to tread cautiously with an eye on corporate earnings reports for Q2:2024-25 and trends in global markets. Despite these concerns, the pipeline for primary market issuances remains strong. India’s external sector is showing resilience despite rising geopolitical tensions. On October 08, 2024, the Financial Times Stock Exchange (FTSE) – Russell announced that it would include India’s sovereign bonds in its Emerging Markets Government Bond Index (EMGBI) over a six-month period from September 2025 with a share of 9.35 per cent on a market value weighted basis. This is expected to boost flows to the debt segments significantly, apart from positioning India as a favourable investment destination. The innate strength of India’s external sector lies in its strong macroeconomic fundamentals, supported by high foreign exchange reserves. Digital payment transactions are expected to gain from strong tailwinds with the onset of the festive season, marked by mega e-commerce sales and rising demand from smaller towns and cities. Increasingly, consumers in Tier 3 to 6 cities are using digital payment services daily.45 These developments highlight the vast potential for driving adoption and ensuring sustained usage of digital payments at the grassroots level.
Annex 1: Major Takeaways from the RBI’s Enterprise Surveys - CU in the manufacturing sector recorded a seasonal decline in Q1:2024-25 (Chart A1). Seasonally adjusted CU, however, increased by 120 basis points during the quarter. Manufacturers maintained a positive outlook on CU in the ensuing quarters (Chart A2).
- Manufacturing firms expect similar levels of optimism on production in Q3:2024-25 and it is likely to improve from Q4 onwards (Chart A3).
- Services and infrastructure firms continue to poll a highly optimistic outlook on demand conditions (Chart A4). Firms remain optimistic on the overall business situation till Q1:2025-26.
- Employment is expected to move in tandem with demand conditions (Chart A5).
- Input cost pressures are likely to ease for the manufacturing sector while the same is expected to persist for the services and the infrastructure sectors in Q3:2024-25 (Chart A6).
- The manufacturing sector anticipates stable growth in selling prices in Q3:2024-25. Growth in selling prices is expected to moderate for the services and infrastructure sectors in Q3:2024-25 (Chart A7).
- Bankers expect higher loan demand and easy terms and conditions for loans across major sectors (Chart A8).
Note: The ‘net response’ is calculated as the difference between the percentage of respondents reporting optimism and that reporting pessimism. The increase option (I) is an optimistic response for all parameters, except the cost related parameters, such as cost of raw materials, etc., where the decrease option (D) signifies optimism from the viewpoint of a respondent company.
|