by Michael Debabrata Patra, Indranil Bhattacharyya, Joice John and Avnish Kumar^ Evaluating the impact of monetary policy changes to inflation, aggregate demand and inflation expectations in India through the transmission channels of the spectrum of financial markets, during the phase of monetary policy tightening since May 2022 indicates relatively strong effects on the shorter end of the term structure. Monetary policy shocks, however, significantly impact all market segments and across tenors. Pass-through to the exchange rate and equity prices has been relatively low. Overall, policy rate increases have anchored inflation expectations and modulated aggregate demand, generating disinflationary responses. Introduction The efficient conduct of monetary policy is contingent upon the propagation of monetary policy impulses across the spectrum of financial markets on to the real economy. For central banks, as the monopoly supplier of reserves, the responsibility for transmission is to ensure that the monetary policy impulse is fully and seamlessly reflected at the short-end of the term structure – the money market (Patra, 2022). Accordingly, a money market interest rate – usually the rate determined in the uncollateralised segment of the money market to represent the infra-marginal demand for reserves – is designated as the operational target of monetary policy. If markets are efficient and complete, changes in short term rates synaptically travel across the term structure and impact long-term rates which, in turn, influence spending decisions, saving and investment of businesses and households, to get manifested in output and prices and hence in societal welfare. The efficacy of monetary transmission is based on (i) active liquidity management by the central bank; (ii) an efficient payment and settlement system; (iii) well-integrated financial markets that arbitrage interest rates across constituent segments; (iv) a sound and vibrant system of financial intermediaries, with asset-liability profiles that are responsive to policy rate changes; and (v) the absence of market pricing distortions like subventions and administered settings of interest rates. Even with the fulfilment of these pre-conditions, transmission losses often occur due to idiosyncrasies in market microstructure, frictions within and across market segments and the inexorable reality of macroeconomic and financial cycles. Since early 2022, central banks across the world engaged in one of the most aggressive and synchronised episodes of monetary policy tightening in recent history in response to an inflation surge that found parallel in the great inflation of the 1970s. In India too, front-loaded and even pre-emptive monetary policy tightening was undertaken since May 2022. In the event, inflation has largely been restrained to its last lap of alignment with targets across geographies. In fact, early movers of monetary policy tightening in this episode have been successful enough to pivot to commencing easing cycles. In India, the process of disinflation has been stubborn, slow, and uneven, stalled by the incidence of repetitive and often overlapping supply shocks. The trajectory of disinflation has, however, been downwards and a durable alignment with the target is in sight. This article delves into this somewhat unique experience by revisiting the various channels of transmission with some stylised facts on developments over the past decade during tightening episodes (Section II), followed by an empirical assessment of transmission in financial markets and the impact of the current tightening cycle on macroeconomic variables (Section III), before concluding with some policy observations (Section IV). II. Transmission Channels and Stylised Facts In the literature, five key channels of monetary policy transmission have been identified, viz, interest rates; credit; asset prices; the exchange rate; and expectations. The interest rate channel is the dominant one – expansionary monetary policy, for instance, leads to a lowering of the cost of loanable funds, which, in turn, raises investment and consumption demand and eventually both output and prices. Similar effects can accrue through changes in the availability of loanable funds, i.e., the credit channel, although it is not a standalone alternative mechanism; it is best regarded as amplifying conventional interest rate effects and running alongside in impacting real activity (Bernanke and Gertler, 1995). Policy rate changes also induce shifts in asset prices that generate wealth effects through market valuations of financial assets and liabilities. This asset price channel of monetary transmission interacts with the bank lending or credit channel, enhancing or diminishing the capacity to borrow at prevailing interest rates, and reinforcing impulses to aggregate demand. Changes in domestic interest rates can also induce the external value of the domestic currency which, in turn, can bring about changes in exports and imports and thereby in aggregate demand and output. The exchange rate channel of monetary policy transmission is found to be dominant in small open economies (Chamon et al., 2019). Over the last three decades, the expectations channel has assumed prominence in the conduct of forward-looking monetary policy. Economic agents form futuristic assessments about the economy, the central bank’s reactions thereto and modulate their current behaviour accordingly. It is observed that these expectations-driven behaviourial changes powerfully influence changes in output and inflation. It is in this context that central bank communication is seen as vital for the anchoring of inflation expectations and actual inflation outcomes (Jung and Kühl, 2021). Clearly, the credibility of the monetary authority drives the expectations channel (Park, 2023). From this perspective, monetary policy has been characterised as the art of managing expectations (Woodford, 2003). In the final analysis, however, these channels work simultaneously, reinforcing and interacting with each other. Country circumstances matter, depending on the structure of the economy and the state of the financial system. In India, monetary policy transmission to money markets is usually instantaneous and complete, especially across collateralised segments. In the uncollateralised call money market – the focus of transmission – sporadic and episodic deviations are observed in times of reserve requirement and balance sheet dates as well as in recurring events such as advance tax outflows and government salary payments. The government securities (G-sec) market assumes a central position in the intermediate to longer end of the interest rate continuum in view of it providing the risk-free term structure for pricing instruments issued by all other sectors of the economy. Liquidity in the G-sec market is not uniform across the curve but concentrated in few maturity segments because of “preferred habitat” and “market segmentation” behaviour of market participants. Corporate bond yields essentially track the movements in G-sec yields, with changing risk spreads over time caused by both variations in the risk-free rate and credit worthiness of corporates. Fixed income segments of the interest rate spectrum are also vulnerable to global spillovers. In the credit segment, the extent and speed of policy rate pass-through to lending and deposit rates have varied sizeably in tightening episodes, depending upon factors such as the duration of the cycle, the speed of the rate hikes and the prevailing liquidity conditions. There are also several idiosyncratic factors that influence monetary policy transmission, viz., interest rate subventions; mismatches in the maturity profile of banks’ assets and liabilities; loans being mostly contracted at floating rates with deposits contracted at fixed rates; rigidity in banks’ savings deposit rates; competition from administered rates on small saving instruments; and the asset quality of financial intermediaries. The introduction of the external benchmark-based lending rate (EBLR) system of loan pricing, effective October 2019 has improved transmission in the credit market (Kumar et al., 2022). Against this backdrop, the rest of this section compares transmission across three monetary tightening episodes over the last decade. II.1 Taper Tantrum (July 2013 - Dec 2014) In May 2013, apprehensions of the likely tapering of US bond purchases under quantitative easing (QE) triggered outflows of portfolio investment from emerging market economies (EMEs), including India, particularly from the debt segment. Faced with this haemorrhage, the Reserve Bank resorted to exceptional measures from mid-July to September 2013 to address exchange market pressures – a rare instance of monetary policy steered to address exchange rate concerns. The marginal standing facility (MSF) rate was raised by 200 basis points (bps) on July 15, 2013, which became the de facto policy rate, supported by liquidity limits on banks’ access to the liquidity adjustment facility (LAF); open market sales of government securities of ₹25 billion on July 18, 2013; and increase in daily cash reserve ratio (CRR) maintenance requirement; even as the repo rate was left unchanged. This was eventually followed by an increase in the policy repo rate to contain the inflationary pressures. Beginning September 20, 2013, policy normalisation commenced in a calibrated manner even while persisting with the anti-inflationary monetary policy stance. Following the ebbing of volatility in the foreign exchange market, the Reserve Bank restored the width of the LAF corridor to 100 bps along with relaxations in regulatory prescriptions1. During July 2013 to December 2014, the Reserve Bank cumulatively increased the repo rate by 75 bps. Transmission to various segments of the financial market spectrum evolved in a differentiated manner in response to these policy actions. The tightening of monetary and liquidity conditions and imposition of regulatory prescriptions led to a significant increase in money market rates in the range of 5 - 406 bps during July 15 to September 19, 2013. Normalisation of monetary policy, liquidity augmenting measures along with the relaxation in regulatory prescription beginning September 20 eased financial conditions thereafter. The rates in the money market (except CD rate) moderated significantly in the range of 148 – 217 bps during September 20, 2013 - January 14, 2015, even when the policy repo rate was increased by 75 bps (Chart 1a). Sovereign yields largely reflected the domestic monetary policy stance, which adjusted to insulate domestic macroeconomic conditions during the taper tantrum. Yields in G-Sec and corporate bond markets hardened during July to September 2013, and moderated as financial conditions eased after September. The yields in the corporate bond market broadly tracked the movements in G-sec yields (Chart 1b). 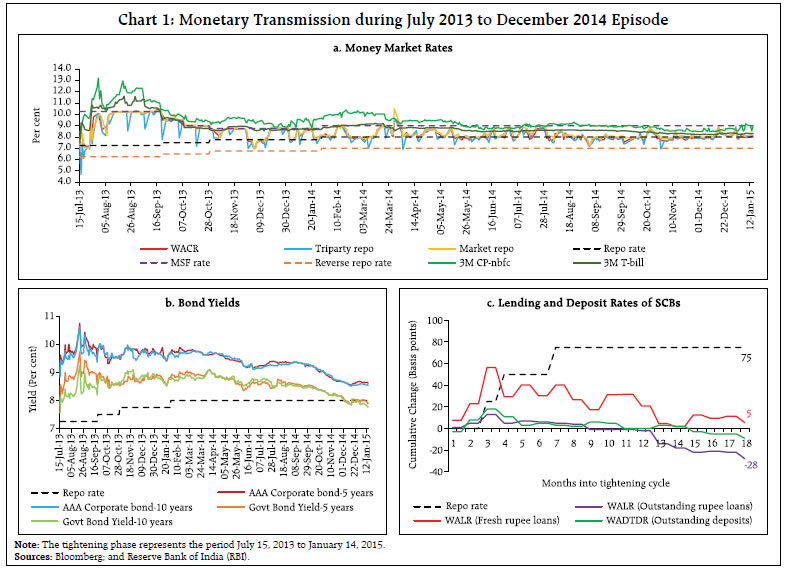 Transmission to the credit segment remained muted during July 2013 to December 2014. While the weighted average lending rate (WALR) on fresh rupee loans of scheduled commercial banks (SCBs) increased marginally, the WALR on outstanding rupee loans and weighted average domestic term deposit rate (WADTDR) on outstanding deposits witnessed a decline. During the initial months when the MSF rate was raised and liquidity tightening measures were undertaken, the lending and deposit rates increased only marginally. Once normalcy was restored in financial markets, banks started reducing their lending rates even as the repo rate was unchanged, thus impacting the efficacy of transmission in this cycle (Chart 1c). II.2 Policy Tightening (June 2018 - January 2019) Taking into consideration the risks to inflation from global financial market developments, sharp increase in crude oil prices, rise in global commodity prices and input cost pressures, the Monetary Policy Committee (MPC) increased the policy repo rate cumulatively by 50 bps during June 6 to August 8, 2018 and maintained a pause thereafter before a cut in the February 2019 policy. The pass-through to overnight money market rates was instantaneous and full during this tightening episode. Transmission to short term money market rates, however, remained muted; in fact, the rates on 3-month certificates of deposit (CDs) and commercial papers (CPs) declined. Durable liquidity of ₹1.4 trillion was injected through open market purchases during October – December 2018 (RBI, 2018-19). Infusion of durable liquidity through open market operations (OMOs) and expectations of rate cuts had a softening impact on T-bill rates during October 2018 to January 2019. Accordingly, the CP and CD rates, which are typically priced off the risk-free rate (T-bill rate), moderated during the same period. Barring intermittent hardening, G-sec yields softened in this episode due to continuing fall in crude oil prices and buoyed sentiments after the announcement of multiple open market purchases by the RBI. The yields in corporate bond market also moderated (Chart 2a and 2b). Monetary transmission to the deposit and lending rates was partial and delayed. During June 2018 to January 2019, SCBs increased their lending rate on fresh loans by 55 bps in response to the 50 bps change in the repo rate. Transmission to the WALR on outstanding rupee loans remained muted as the increase in interest rates on fresh loans was more than offset by the fall in interest rates on marginal cost of funds-based lending rate (MCLR)-linked loans contracted in the past and reset at lower rates. The internal benchmark-based lending rate regimes suffered from a multitude of issues, such as opacity and arbitrariness in calculation of the base rate/MCLR and spreads; and long reset clauses that inhibited efficient monetary transmission (Chart 2c). II.3 Current Tightening Cycle (May 2022 onwards) Amidst inflationary pressures emanating from heightened geopolitical tensions due to the war in Ukraine, a generalised hardening of global commodity prices, supply chain disruptions, and volatility in global financial market, the Reserve Bank moved into tightening mode beginning May 2022. Responding to the ensuing inflation surge, the MPC increased the policy repo rate cumulatively by 250 bps between May 4, 2022 to February 8, 2023 and adopted a calibrated and cautious approach thereafter to contain rising inflation. The stance of monetary policy was also altered to withdrawal of accommodation in June 2022. In its liquidity management operations, the RBI introduced a standing deposit facility (SDF) in April 2022 at 25 bps below the repo rate as the new floor of the LAF corridor. The width of the corridor was thus restored to its pre-pandemic configuration of 50 bps. In consonance with the monetary policy stance, liquidity management operations were aimed at balancing out the level of liquidity in the banking system. Money market interest rates rose broadly in tandem with the policy repo rate hikes, the increase in CRR and the decline in surplus liquidity. These rates increased in the range of 236 – 325 bps during May 4, 2022 to September 30, 2024. The yields on G-sec hardened in the initial phase of tightening, taking cues from global developments and the domestic monetary policy stance. Sovereign yields softened, however, reflecting positive sentiment on the inclusion of Indian G-sec in global bond indices, moderation in headline inflation and fiscal consolidation (Chart 3a and 3b). 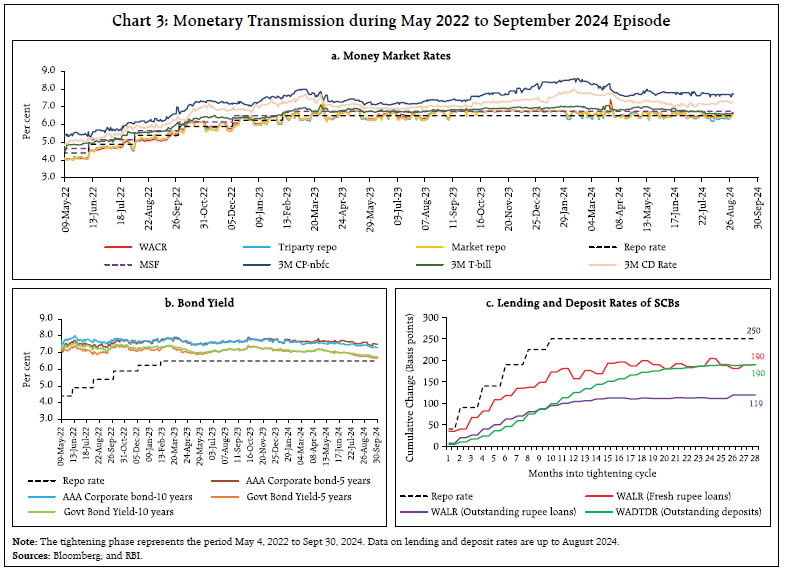 The pace of monetary transmission to lending and deposit rates of SCBs has strengthened in recent years, reflecting the RBI’s sustained efforts to impart transparency and flexibility to SCBs’ interest rate structure, including the introduction of EBLR for floating rate loans in October 2019. The WALR on fresh rupee loans rose by 190 bps while that on outstanding loans rose by 119 bps during May 2022 to August 2024. In the case of deposits, the WADTDRs on fresh and outstanding deposits rose by 243 bps and 190 bps, respectively, during the same period (Chart 3c). III. Quantitative Assessment of Monetary Policy Transmission Monetary policy impulses transmit through changes in financial market variables (the first leg of transmission), which subsequently gets propagated to the real sector in terms of growth and inflation (last leg of transmission). From this perspective, this section provides an empirical assessment of the first and last leg of transmission. III.1 Transmission to Financial Markets Assessing the strength of monetary policy transmission in the first leg is complicated by monetary policy’s simultaneous and endogenous response to economic developments. In this context, markets anticipate the central banks’ policy actions in advance and adjust their behaviour even before actual policy announcements. Sometimes, however, central bank actions can result in monetary policy “surprises”, which can be utilised to evaluate the impact of monetary policy transmission to financial market variables. Overnight indexed swap (OIS) rates2 are useful in identifying the “surprise” component of policy announcement, with several advantages. First, counterparty risk is minimal in OIS contracts since they involve only an exchange of interest and not notional principal amounts (Finlay and Olivan, 2012). Second, OIS contracts do not involve any initial cash flow; only net payments are exchanged, thus minimising liquidity risk. Taking cognizance of these features, OIS rates have been used to decipher market expectations on future monetary policy (Christensen and Rudebusch, 2012; Woodford, 2012; Güneş and Mohanty, 2018; Altavilla et al., 2019; Lloyd, 2021). Using the 2-month3 OIS rates, in particular, the monetary policy “surprises” can be estimated (John et al., 2023a; Lloyd 2018, 2021). It is observed that majority of monetary policy announcements are well anticipated by the market (Table 1). 9 out of 49 monetary policy announcements since the implementation of the flexible inflation targeting (FIT) framework in India4 had a surprise component of 10 bps (in absolute terms) or above in the announced policy rate changes. The most noteworthy “surprise” was the off-cycle announcement made on May 4, 2022, which completely surprised markets. Two alternate empirical approaches are used to estimate the impact of policy “surprises” on the financial market variables. In the first approach, a 5-day window-based event study (ES) regression analysis around the policy announcement days since October 2016 is carried out (Table 2). The regression results suggest that monetary policy changes affect shorter-term rates more aggressively than long-term rates. Overnight call money rates are affected by the policy rate, irrespective of whether they are anticipated or not. Anticipated changes do not affect the long-term rates instantaneously, perhaps because they have already been factored in by the market even before the policy announcement. Policy surprises, however, significantly impact all the financial market rates (G-sec yields; corporate bond yields; the exchange rate; and stock market returns) in the expected direction. G-sec and corporate bond yields positively react to the monetary policy “surprise”, while the exchange rate appreciates, and stock market returns diminish. In case of G-sec and corporate bond yields, the impact is found to be higher for shorter tenure interest rates. | Table 1: Monetary Policy Surprises (bps) | | Policy Date | Δ Policy | Surprise | | 2016-17 | | | | August 09 | 0 | 9 | | October 04 | -25 | -10 | | December 07 | 0 | 7 | | February 08 | 0 | -1 | | 2017-18 | | | | April 06 | 0 | -7 | | June 07 | 0 | 2 | | August 02 | -25 | -6 | | October 04 | 0 | -2 | | December 06 | 0 | -2 | | February 07 | 0 | -5 | | 2018-19 | | | | April 05 | 0 | -4 | | June 06 | 25 | 3 | | August 01 | 25 | 5 | | October 05 | 0 | -15 | | December 05 | 0 | -5 | | February 07 | -25 | -8 | | 2019-20 | | | | April 04 | -25 | 1 | | June 06 | -25 | 0 | | August 07 | -35 | -1 | | October 04 | -25 | 6 | | December 05 | 0 | 10 | | February 06 | 0 | -5 | | 2020-21 | | | | March 27* | -75 | -24 | | May 22 | -40 | 0 | | August 06 | 0 | 7 | | October 09 | 0 | -12 | | December 04 | 0 | -8 | | February 05 | 0 | -4 | | 2021-22 | | | | April 07 | 0 | -3 | | June 04 | 0 | -5 | | August 06 | 0 | -6 | | October 08 | 0 | -4 | | December 08 | 0 | -7 | | February 10 | 0 | -17 | | 2022-23 | | | | April 08** | 0 | 0 | | May 04 | 40 | 40 | | June 08 | 50 | -2 | | August 05 | 50 | 1 | | September 30 | 50 | 15 | | December 07 | 35 | -12 | | February 08 | 25 | 0 | | 2023-24 | | | | April 06 | 0 | -1 | | Jun 08 | 0 | 6 | | August 10 | 0 | 8 | | October 06 | 0 | 8 | | December 08 | 0 | 7 | | February 08 | 0 | 5 | | 2024-25 | | | | April 05 | 0 | 4 | | June 07 | 0 | -1 | | August 08 | 0 | -2 | Note: *: There was an additional 15 bps reduction in the reverse repo rate making the LAF corridor asymmetric.
**: Corridor width was restored by introducing Standing Deposit Facility (SDF) at 25 bps below the policy repo rate.
Policy dates where surprises were more than or equal to absolute 10 bps are shaded
Sources: John et al. (2023a); and Authors’ estimate. |
| Table 2: Event Study Regression Estimates: Impact of Policy Surprises on Financial Market Variables | | Independent Variables | Δ Policy | Anticipated | Surprise | | Dependent Variables | | Δ WACR | 0.784*** | 0.776*** | 0.822*** | | Δ G-Sec3Yr | 0.292*** | 0.152* | 0.931*** | | Δ G-Sec5Yr | 0.246*** | 0.107 | 0.879*** | | Δ G-Sec10Yr | 0.151** | 0.0493 | 0.616*** | | Δ CB 3Yr | 0.262*** | 0.112 | 0.951*** | | Δ CB 5Yr | 0.245*** | 0.107 | 0.876*** | | Δ CB 10Yr | 0.202*** | 0.110 | 0.625*** | | Δ INR-USD | -0.0878 | 0.275 | -1.741** | | Δ NIFTY | -1.082 | -0.497 | -3.749* | Note: *, **, ***: Significant at 10, 5 and 1 per cent respectively
WACR: Weighted average overnight call money rate
G-sec: Government Securities rates
CB: Corporate bond rates
Sources: John et al. (2023a); and Authors’ estimate. | In the second approach, we use the local projection model (Jorda, 2005) to estimate the impact of monetary policy “surprises” in a time series framework using daily data from October 2016.5 This approach also corroborates the findings from the event study (Chart 4). Monetary policy “surprises” affect the financial market variables significantly and in the expected direction. The effect on yields is found to wane beyond the three-year tenure in case of G-sec and corporate bond yields. Policy surprises have a relatively lower but significant pass-through to the exchange rate and equity prices. III.2 Impact on Macroeconomic Variables The impact of the policy rate on the real economy is assessed through inflation expectations (IE) and aggregate demand. Monetary policy affects the real sector with long and variable lags; hence, the impact of easing and tightening cycles is usually intertwined. Therefore, we use macro level analysis to identify the average impact of a policy rate change. The impact on inflation expectations can be estimated by using the dynamic multiplier of the policy rate on inflation expectations (IE) generated from an IE formation regression equation (Patra et al., 2024). The one-year ahead IE from household inflation expectations survey is regressed on food inflation (representing adaptive expectations), the monetary policy framework (represented by inflation target or commitment to the framework) and the policy repo rate, by using quarterly data from Q1:2012-13 to Q1:2024-25. Monetary policy has a significant negative impact on inflation expectations, while adaptive expectations (represented by food inflation) have a statistically significant positive impact (Table 3). | Table 3: Regression Coefficients | | Variables | Coefficient | p-value | | IE (-1) | 0.44 | 0.000 | | Food Inflation | 0.12 | 0.047 | | Target | 0.65 | 0.006 | | Repo | -0.31 | 0.097 | | Constant | 4.00 | 0.000 | Diagnostics: Adjusted R2: 0.740; Breusch-Godfrey LM test for autocorrelation in errors p-value: 0.793.
Sources: NSO; RBI; and Patra et al. (2024). | The long-run elasticity of the policy rate on IE is 0.70. This shows that an increase in the policy rate leads to anchoring of IE. The dynamic multiplier suggests that policy rate tightening impacts inflation expectations up to 2 quarters (Chart 5). The macroeconomic impact of monetary policy on aggregate demand and inflation is estimated by using the RBI’s Quarterly Projection Model (QPM), focussing on the recent monetary policy tightening cycle from May 2022. QPM belongs to a genre of New-Keynesian open economy, calibrated, gap model featuring several India specific features (John et al., 2023b). The impulse response generated from QPM suggest that the 250 basis points increase since May 2022 has negatively contributed to aggregate demand and headline inflation by 160 bps each till Q2:2024-25, working through various channels of monetary policy transmission (Chart 6).
IV. Conclusion Our findings on monetary policy transmission in India suggest that monetary policy changes affect short term interest rates more than long-term rates. While anticipated policy changes do not have any instantaneous impact on long-term rates, policy “surprises” significantly impact all market segments and across tenors. Policy signals tend to wane, however, beyond the three-year tenure. Policy “surprises” are found to have a relatively lower but significant pass-through to the exchange rate and equity prices. In terms of the impact of the policy rate tightening on the real economy, a significant negative impact on inflation expectations is observed. The long-run elasticity of the policy rate with respect to inflation expectation reveals that an increase in policy rate anchors expectations effectively. The macroeconomic impact of monetary policy on aggregate demand and inflation indicate that the 250 basis points increase since May 2022 has negatively contributed to aggregate demand and headline inflation by 160 bps each till Q2:2024-25, working through various channels of policy transmission. References: Altavilla, C., Brugnolini, L., Gürkaynak, R. S., Motto, R., and Ragusa, G. (2019). Measuring Euro Area Monetary Policy, Journal of Monetary Economics, 108, 162-179. Bernanke, B. S., and M. Gertler (1995). Inside the Black Box: The Credit Channel of Monetary Policy Transmission, Journal of Economic Perspectives, vol. 9, pp. 27-48. Chamon, M. M., Hofman, M. D. J., Magud, M. N. E., and Werner, A. M. (2019). Foreign Exchange Intervention in Inflation Targeters in Latin America, International Monetary Fund. Christensen, J. H., and Rudebusch, G. D. (2012). The Response of Interest Rates to US & UK Quantitative Easing. The Economic Journal, 122(564), F385-F414. Finlay, R., and Olivan, D. (2012). Extracting Information from Financial Market Instruments. RBA Bulletin, March. Güneş, K., and Mohanty, M. (2018). Do Interest Rates Play a Major Role in Monetary Policy Transmission in China?, BIS Working Papers 714, Bank for International Settlements. John, J., Talwar, B. A., Sachdeva, P. and Bhattacharyya, I. (2023a). Reading the Market’s Mind: Decoding Monetary Policy Expectations from Financial Data, RBI Bulletin, November. John, J., Kumar, D. George, A. T., Mitra, P., Kapur, M., and Patra, M. D. (2023b). A Recalibrated Quarterly Projection Model (QPM 2.0) for India, RBI Bulletin, February. Jordà, Ò. (2005). Estimation and Inference of Impulse Responses by Local Projections, American Economic Review, 95(1), 161-182. Jung, A. and Kühl, P (2021). Can Central Bank Communication Help to Stabilise Inflation Expectations? ECB Working Paper Series. No 2547, May. Kumar, A., Prakash, A., and Latey, S. (2022). Monetary Transmission to Banks’ Interest Rates: Implications of External Benchmark Regime, RBI Bulletin, April. https://rbi.org.in/Scripts/BS_ViewBulletin.aspx?Id=20939 Lloyd, S.P. (2018). Overnight Index Swap Market-based Measures of Monetary Policy Expectations, Bank of England Working Paper 709. Lloyd, S. P. (2021). Overnight Indexed Swap-implied Interest Rate Expectations, Finance Research Letters, 38, 101430. Park, K. (2023). Central Bank Credibility and Monetary Policy, International Journal of Central Banking, June. Patra, M. D. (2022). Lost in Transmission? Financial Markets and Monetary Policy, RBI Bulletin, November. https://rbi.org.in/Scripts/BS_ViewBulletin.aspx?Id=21395 Patra, M. D., John, J. and George. A. T. (2024). Are Food Prices Spilling Over?, RBI Bulletin, August. Reserve Bank of India (2018-19). Annual Report. Woodford M. D (2003). Interest and Prices: Foundations of a Theory of Monetary Policy, Princeton University Press. Woodford, M. D. (2012). Methods of Policy Accommodation at the Interest-rate Lower Bound, Proceedings - Economic Policy Symposium - Jackson Hole, Federal Reserve Bank of Kansas City, pages 185-288.
Annex | Table A1: Monetary Transmission across Tightening Episodes (in bps) | | | 15 Jul-2013 to 14 Jan-2015 | 6 Jun-2018 to 6 Feb-2019 | Current Tightening Episode | | 15 Jul-2013 to 14 Jan-2015 | 15 Jul-2013 to 19 Sep-2013 | 20 Sep-2013 to 14 Jan-2015 | 8 Apr-2022 to 30 Sep-2024 | 4 May-2022 to 30 Sep-2024 | | Repo Rate | 75 | 0 | 75 | 50 | 250 | 250 | | Reserve Repo/SDF | 75 | 0 | 75 | 50 | 290 | 250 | | MSF | 75 | 200 | -125 | 50 | 250 | 250 | | Money Market Rates | | WACR | 95 | 312 | -217 | 53 | 341 | 304 | | Triparty Repo | 216 | 406 | -190 | 64 | 328 | 288 | | Market Repo | 127 | 321 | -194 | 51 | 337 | 293 | | 3M T Bill | 85 | 244 | -159 | 7 | 256 | 236 | | 3M CD Rate | 51 | 5 | 46 | -74 | 347 | 319 | | 3M CP (NBFCs) | 47 | 195 | -148 | -38 | 342 | 325 | | Bond Market Yields | | 5-Yr G-sec | 9 | 76 | -66 | -63 | 27 | -16 | | 5-Yr AAA Corp | -27 | 63 | -90 | -7 | 104 | 66 | | 10-Yr G-sec | 24 | 66 | -42 | -48 | -16 | -37 | | 10-Yr AAA Corp | -27 | 55 | -82 | 1 | 16 | 3 | | Interest Rates of Banks | | | July 2013 to Dec 2014 | Jun 2018 to Jan 2019 | Current Tightening Episode | | July 2013 to Dec 2014 | July 2013 to Sep 2013 | Sep 2013 to Dec 2014 | April 2022 to August 2024 | May 2022 to August 2024 | | WALR-Fresh rupee loans | 5 | 22 | -17 | 55 | 178 | 190 | | WALR- Outstanding rupee loans | -28 | 5 | -33 | -1 | 117 | 119 | | WADTDR- Outstanding deposits | -9 | 8 | -17 | 20 | 190 | 190 | | WADTDR- Fresh deposits | - | - | - | - | 234 | 243 | | Sources: Bloomberg; and RBI. |
|