by Nishant Singh and Abhiruchi Rathi^ The significance of food items in India’s Consumer Price Index (CPI) in terms of their weight and price volatility makes accurate forecasting of food inflation crucial for headline inflation projections. Nowcast, which is the current-period inflation projection, guides short-and medium-horizon forecasts. Given the technology-driven surge in data availability, this study investigates predictive power of high frequency price and non-price indicators for nowcasting food inflation in India. Furthermore, employing machine learning (ML) techniques, this study explores their utility over traditional benchmark models. Empirical findings indicate that expanding the information set improves nowcast accuracy, which is further enhanced by employing regularisation and ML methods. Introduction The Reserve Bank of India Act provided a statutory basis for flexible inflation targeting (FIT)1 in 2016 and entrusted the central bank to conduct monetary policy with the primary objective of maintaining price stability while keeping in mind the objective of growth. Given the typical monetary transmission lags, inflation forecasts act as an intermediate target for the central bank in a FIT framework, which guide monetary policy actions and stance. Thus, accurate forecasts of inflation (as well as that of economic activity) play a key role in the successful pursuit of FIT and for aligning inflation to the target on a durable basis. In India, the food and beverages group has a high share (45.86 per cent) in the Consumer Price Index-Combined (CPI-C) basket and its prices exhibit large volatility driven by supply-side shocks. At the same time, food prices carry important macroeconomic implications as their movements strongly impact the welfare of the poor (Sekhar, et al., 2018) and help in monitoring developments around food security (Cachia, 2014). After moderating since 2014 on improvement in supply chain dynamics (Bhoi et al., 2019), CPI food inflation2 witnessed an uptick in both mean and volatility starting 2019-20 due to the resurgence of supply disruptions driven by weather-related disturbances, the COVID-19 pandemic and geopolitical conflicts. Given the significant impact of the food and beverages group (hereafter referred to as ‘food’) on headline inflation due to its high weight in the CPI basket and the associated large volatility, it is of utmost significance to have systems in place to generate reliable forecasts of food inflation. Comparision of cross-country headline inflation forecast performance suggests that countries with a larger share of food in their CPI baskets tend to experience higher forecast errors (RBI, 2020), highlighting the challenging nature of inflation forecasting in India and reiterating the significance of accurate food inflation forecasts. An important component of the forecasting exercise is nowcasting, which is to predict inflation in the current period (month or quarter), before the official data are published (Clark, et al., 2022). These nowcasts are not only of interest on their own but also act as important inputs to forecasts at short-and medium-horizons (Krüger et al., 2017; Faust and Wright, 2013). However, studies focusing on improving food inflation nowcasts are relatively scarce (Macias, et al., 2023), which necessitates increased attention in this area. Due to the sensitivity of food prices to a multitude of domestic and international factors and its changing statistical properties, the task of capturing large and unanticipated movements in food prices using traditional univariate modelling methods has become challenging. This makes a case for exploring alternative, yet relevant, information which may be available at higher frequencies than traditionally used sources, and evaluating non-traditional methods of leveraging such information to extract real-time indication of the direction and magnitude of price movements. The recent technological advancements, rise of digitalisation, and more particularly, the emergence of high frequency information from various sectors of the economy have facilitated better understanding of food price dynamics in the Indian context. While some recent studies have employed models using high-frequency price information to predict short-term food inflation (Yadav and Das, 2023; Pratap et al., 2022), there is plenty of other price and non-price information available which, when aggregated and utilised along with price information, could better reflect the supply-side dynamics impacting food prices and CPI food inflation. A potential set of such price and non-price information includes high-frequency retail and wholesale/mandi food prices, domestic and international commodity prices, weather-related information, reservoir levels, information on crop sowing, production and market/mandi arrivals, wage rates, exchange rate movements (INR/USD), internet-search trends among public with regard to food prices3, and government policies and interventions. Hence, nowcasting food inflation calls for keeping a track of such evolving information on a regular basis. Forecast errors can be large around turning points or high inflation episodes since during such phases the time series properties of inflation and its relationship with key macroeconomic variables may turn unstable (Andreas Joseph et al., 2024). In such circumstances, the widely used traditional linear econometric models including autoregressive integrated moving average (ARIMA), seasonal ARIMA (SARIMA), and linear regression, which assume linear and time-invariant relationships, could miss out potential non-linearities and changing relationships (Binner et al., 2005). Hence, not only leveraging alternative information across sectors might be useful to detect price movements and turning points early on, but employing alternative techniques for capturing the relationships in the data may further help in better nowcasting. Therefore, leveraging ML models may add value to the nowcasting exercise, given their suitability in dealing with large heterogenous data and capturing changing relationships (Chakraborty and Joseph, 2017). On high-dimensional data, employing regularisation or shrinkage methods may also help in enhancing the modelling performance (Joseph et al., 2024; Richardson et al., 2021). Therefore, besides traditional linear techniques, this study also explores regularisation (shrinkage) techniques such as ridge regression (Hoerl and Kennard, 1970), Machine Learning (ML) techniques including Deep Learning (DL) which capture potential non-linearities (Singh and Bhoi, 2022; Chakraborty and Joseph, 2017; LeCun et al., 2015) and Support Vector Regression (SVR) which reduces overfitting and is known to perform well on high-dimensional data (Noble, 2006; Drucker et al., 1996). The studies on nowcasting food inflation in India are scarce and those leveraging information other than retail and wholesale prices are even rare. Therefore, this study attempts to contribute to the existing literature by investigating the predictive power of large alternative information (big data) using alternative nowcasting techniques and methods (data science) including ML and regularisation to potentially enhance the accuracy of food inflation nowcasts. For the empirical exercise, the study segregates the set of all the techniques into three broad categories i.e., Univariate Linear, Multivariate Linear, and Multivariate ML-based to examine if an increasing level of sophistication of both data coverage and model complexity enhances the nowcast performance. Different nowcast combinations have also been derived to investigate if they improve upon the individual models, drawing from the literature, suggesting potential improvements in accuracy over individual models (John et al., 2020; Stock and Watson, 2004). The rest of the study is organised into five sections. Section II provides stylised facts on food inflation in India. Section III reviews the relevant literature. Section IV describes the methodology and empirical strategy, followed by results in Section V. Section VI concludes the paper. II. Stylised Facts on Food Inflation in India The food group has a substantial weight in India’s CPI (Table 1). Food inflation in India recorded a declining trend from 2014 through the first half of 2019. While improved supply conditions relative to demand have been underscored as the primary driving force behind this moderation, the enhancements in supply chain dynamics were also a contributing factor to this trend (Bhoi et al., 2019). However, during 2019-21, food inflation and its contribution (around 13 per cent during 2017-19 and 53 per cent during 2019-21) to headline inflation increased sharply (Chart 1a and 1b) on account of rain-induced food price pressures and pandemic-driven supply disruptions. With the easing of global supply chain disturbances, food inflation moderated in 2021-22. However, the moderation was short-lived as the conflict in Europe led to a renewed spike in global food and energy prices (IMF, 2022), which coupled with weather-related disturbances, kept food inflation largely elevated since 2022. | Table 1: CPI Inflation in India | | Period: January 2014 – December 2023 | | CPI Group | CPI Weight | Mean | Standard Deviation | Skewness | Kurtosis | | Food | 45.86 | 5.1 | 3.0 | -0.1 | -0.6 | | Fuel | 6.84 | 5.4 | 3.6 | 0.3 | -0.1 | | Core | 47.30 | 5.2 | 0.8 | 0.1 | -0.8 | | Headline | 100 | 5.1 | 1.5 | -0.1 | -0.7 | Note: Core group refers to CPI headline excluding food and fuel groups.
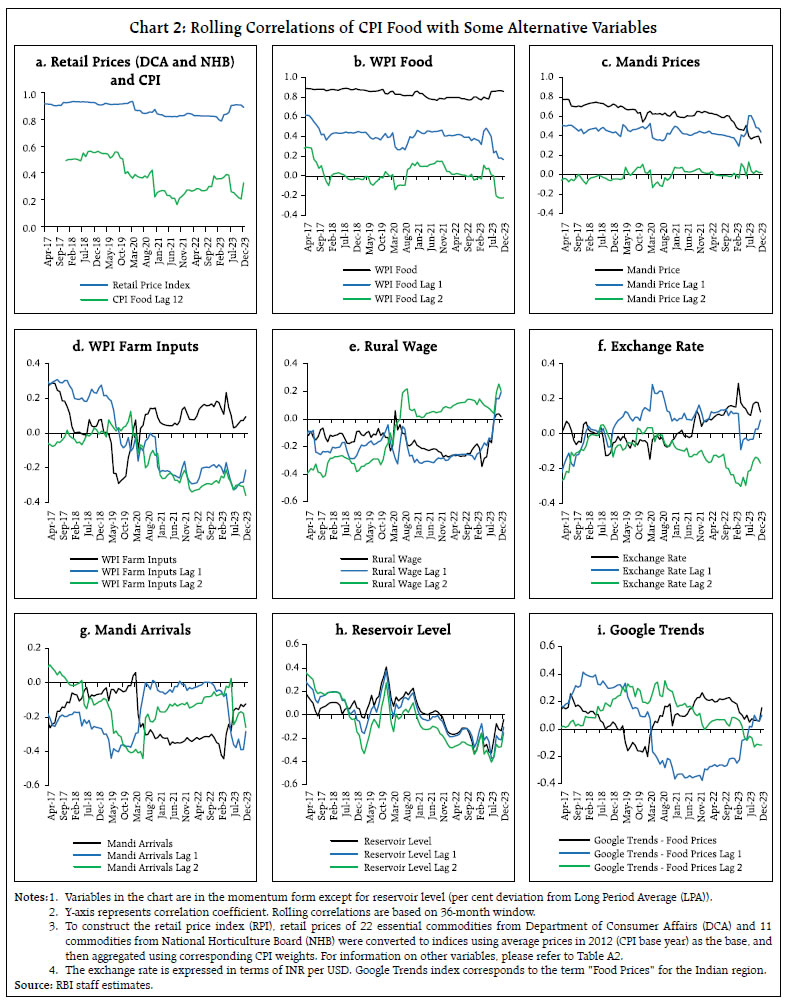
Sources: National Statistics Office (NSO), Ministry of Statistics and Programme Implementation (MoSPI), Government of India (GoI), and RBI staff estimates. | CPI food momentum4 has also witnessed some statistical changes such as decline in the correlation with its same season lag (12th lag) over time (Chart 2a), attenuating the univariate modelling methods for nowcasting, which calls to explore additional high frequency information to better capture food inflation dynamics. Information other than retail and wholesale prices may potentially provide additional real-time information about the supply-side dynamics translating into retail price changes, acting as early/leading indicators, more particularly, for food items on which price-related information is not available. The relationships between food inflation and some associated variables have also undergone changes over time, as reflected in correlation with the variables and their lags (Chart 2), suggesting the presence of non-linearities. While linear models may fail in capturing these changing relationships, non-traditional methods and techniques such as ML can be employed to capture non-linearities, as discussed earlier. 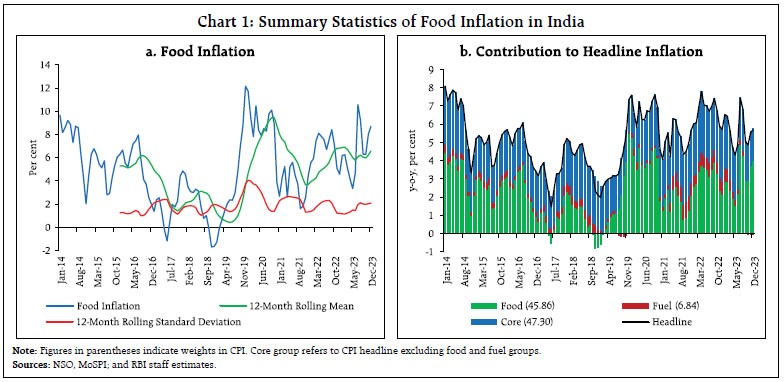
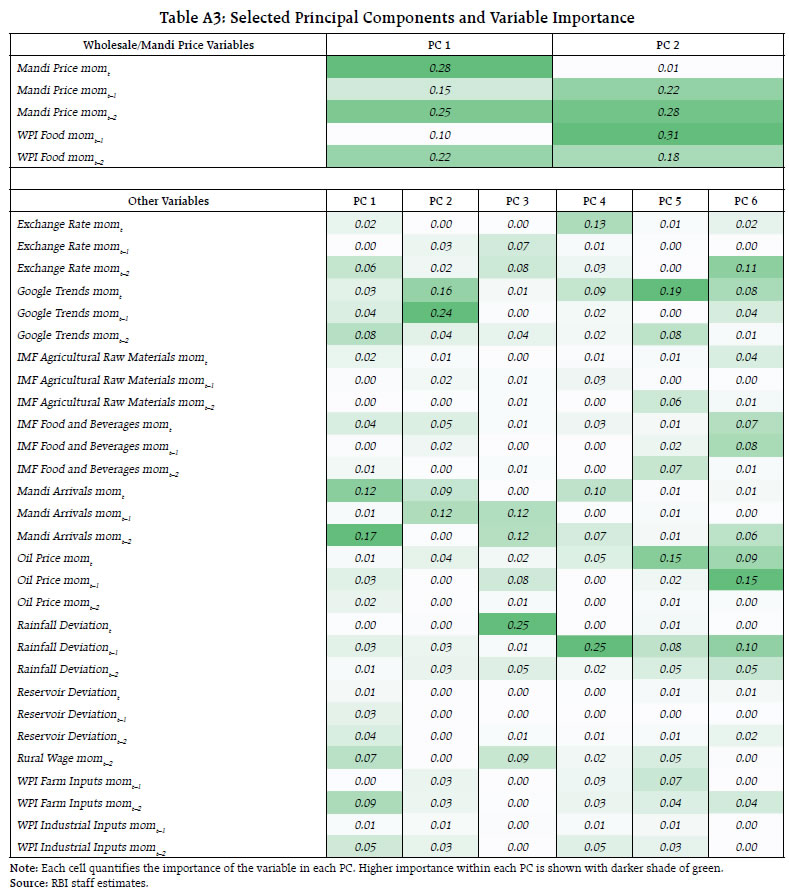
 III. Literature Review Nowcasting exercises are particularly pertinent for macroeconomic variables which are available at low frequencies, often at a quarterly basis, as in the case of Gross Domestic Product (GDP). Data for these variables are typically released with significant lags, prompting the need for nowcasts - early estimates derived by leveraging more readily available and frequently updated data sources (Banbura et al., 2010). With inflation data commonly available on a monthly basis, nowcasting, particularly for food inflation, has been relatively less explored globally, especially given its relatively low weight in the CPI baskets in major advanced economies. In emerging and developing economies with large share of food in the CPI basket, nowcasting of food inflation can substantially strengthen the conduct and formulation of monetary policy. Several studies suggest the importance of high frequency information for the inflation nowcasting exercise. According to Silva et al. (2024), daily food prices carry significance in nowcasting food price inflation. Beck et al. (2022) leverage household scanner data on product-level prices and quantities to nowcast German inflation, demonstrating that this granular information yields timely insights into inflation dynamics early in each month. According to Yadav and Das (2023), an approach using dynamic factors and mixed frequency models on daily crowd-sourced food prices outperforms the conventional approaches in nowcasting inflation. Macias et al. (2023) find that employing an extensive dataset of food and non-alcoholic beverages prices scraped from webpages of major online retailers enhances the accuracy of food inflation nowcasts. Leveraging the Google Trends database, Seabold and Coppola (2015) find that integrating an internet search index improves the nowcasting of prices in Central America. Modugno (2013) shows that the inclusion of high frequency data on energy and raw material prices enhances the performance of inflation nowcasts. Knotek and Zaman (2017) also explored nowcasting inflation using real-time data in the US. Recent literature has also highlighted the use of alternative nowcasting techniques within ML for their ability to process unstructured data and capture strong non-linearities (Desai, 2023; Goulet Coulombe et al., 2022), as well as shrinkage and regularisation techniques which perform well on high-dimensional data by reducing overfitting and improving generalisation. Joseph et al. (2024) explore the effectiveness of dimensionality reduction techniques such as principal component analysis (PCA), shrinkage methods such as ridge regression, and ML models such as support vector machines (SVM) and neural networks in forecasting UK inflation and find that ridge regression and other shrinkage methods perform best when using high-dimensional data, and that combining large and relevant information set along with effective penalisation enhances model performance. Using Euro area inflation data, Aliaj et al. (2023) find that lasso regression, another popular regularisation technique, outperforms standard methods in nowcasting Euro area inflation. IV. Methodology, Data and Empirical Strategy Food inflation (y-o-y) in India is non-stationary in nature. However, CPI food momentum is found to be stationary (Table A1), and therefore is used as the target variable for the empirical work in this study (Table 2). All the empirical work in this paper is based on monthly data. Nowcasts have been generated on an expanding sample basis to control for sample period bias. Model specification for each technique is fixed using data till December 2022, after which the selected models are trained on an expanding sample basis by adding one successive month of realised data at a time to generate 12 monthly nowcasts. ML models generally require a testing data set5 to assess the accuracy of trained models and choose the optimal model based on minimum error6 obtained on the testing data set, which is kept as 12 months for each sample. In this paper, alternative nowcasting techniques have been employed for a broad comparison of their nowcast performance. The set of all techniques is divided into three broad categories i.e., Univariate Linear, Multivariate Linear and Multivariate ML-based (Table 3) to assess if the increasing level of sophistication in terms of data coverage and model complexity improves the nowcast performance. While Deep Learning (DL) has been employed to capture the possible non-linearities in the data, ridge regression7 and SVR8 have been used to investigate if their suitability to high-dimensional data enhances the nowcast accuracy. The study considers both price and non-price indicators to capture variation in food inflation (Table A2). Retail prices, wholesale/mandi prices, domestic and international commodity prices, Wholesale Price Index (WPI)-based input prices, rural wages, rainfall deviation, reservoir levels, market arrivals, exchange rate, and Google Trends data are considered. The empirical work considers all the explanatory variables in both contemporaneous and lagged forms to capture their immediate and lagged impact for nowcast generation, except WPI and rural wages considering the lag in their data release, as detailed in Table A3 of the Appendix. After finalising the set of variables and their appropriate lag structure (based on AIC), the principal component analysis (PCA) technique has been employed on all explanatory variables except retail prices9, for dimensionality reduction to generate maximum principal components (PCs) (Table A3). Thereafter, forward selection10 (FS) technique has been employed to shortlist the most relevant PCs based on the training data using a significance level of 10 per cent as the threshold. The list of input variables before and after conducting PCA is given in the Annex (Table A4). While the ridge regression is allowed to leverage raw data of all the 35 predictors due to its regularisation (shrinkage) capability, the other models consider the shortlisted principal components as explanatory variables (Table A5). | Table 2: Details of the Methodology Used in the Study | | Item | Traditional Techniques | ML Techniques | | Study Period | Jan 2014 – Dec 2023 | Jan 2014 – Dec 2023 | | Model Identification Period | Jan 2014 – Dec 2022 | Jan 2014 – Dec 2022 | | Target Variable | CPI Food momentum | CPI Food momentum | | Test Data Size | - | 12 months | | Model Building Period | Training Period | Training + Testing Period | | First Sample Training Period | Jan 2014 – Dec 2022 | Jan 2014 – Dec 2021 | | First Sample Testing Period | - | Jan 2022 – Dec 2022 | | Nowcast Period | Jan 2023 – Dec 2023 | Jan 2023 – Dec 2023 |
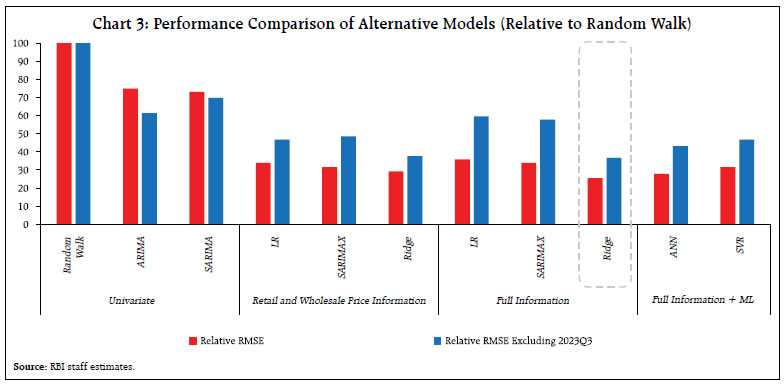
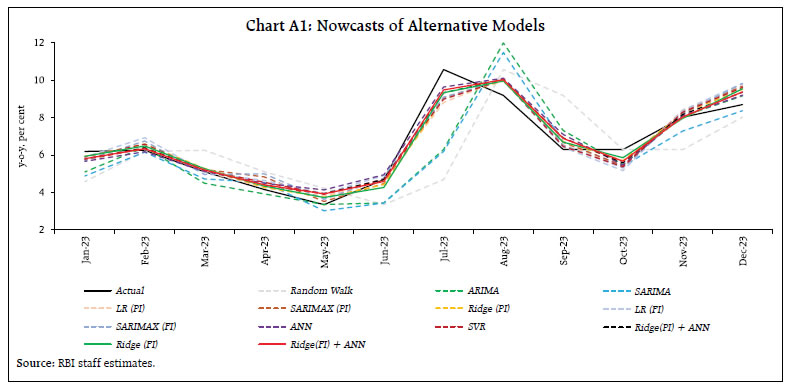
| Table 3: Alternative Techniques Used in the Study | | Technique | Type | | Random Walk | Univariate Linear | | ARIMA and SARIMA | Univariate Linear | | Linear Regression | Multivariate Linear | | ARIMAX and SARIMAX | Multivariate Linear | | Ridge Regression | Multivariate Linear | | Artificial Neural Network (ANN) | Multivariate ML-based | | Support Vector Regression (SVR) | Multivariate ML-based | | Note: For description on models other than ridge regression and SVR, please refer to Singh and Bhoi, 2022. | Seasonal adjustment has not been performed on the data as (1) the paper concentrates only on nowcast accuracy and not impact evaluation and (2) seasonal adjustment results in loss of some information, even when conducted properly (IMF, 2017). V. Results As the inflation nowcasts are in month-on-month (m-o-m) momentum form, they are converted into year-on-year (y-o-y) numbers for like-for-like comparison with the actual CPI food inflation rates (y-o-y). Both root mean squared error (RMSE) and mean absolute error (MAE) of nowcasts have been calculated for performance comparison across models. Relative RMSE, calculated considering Random Walk as the base model, is also compared (Chart 3). As 2023Q3 witnessed substantial food price shocks, nowcasts excluding Q3 are also calculated for a more robust comparison. The results indicate that expanding the information set as well as increasing model complexity improves the accuracy of nowcasts based on data for 2023 (Table 4, Chart 3). The precision notably increases when retail and wholesale food price information are incorporated as compared to scenarios where only univariate models (no alternative information) are employed, producing temporally lagged (seemingly right-shifted) nowcasts due to the presence of significant immediate sequential lags in the autoregressive models (Chart A1). However, within multivariate linear models (linear regression and SARIMAX), inclusion of information other than retail and wholesale prices does not provide performance gains as traditional linear models may not perform well on higher dimensions and capture potential non-linearities in the data. This deficiency is addressed by employing regularisation and ML techniques which provide significant improvement in the prediction accuracy. Within ML models, while SVR enhances the accuracy by generating robust estimates for high-dimensional data (characterised by noise and heterogeneity among predictor variables), ANN further enhances the nowcast performance due to its ability to capture non-linearities. However, ridge regression, a linear model, provides maximum performance gains as its regularisation (shrinkage) feature stabilises the coefficients by reducing overfitting and multicollinearity commonly associated with high-dimensional data. These results indicate that inclusion of additional information help in explaining variations in food inflation, enhancing the nowcasting performance over traditional linear benchmarks. Using the best performing models, RMSE-weighted combination nowcasts are also calculated which provide additional performance gains over those obtained from the individual models, suggesting maximum performance using the combination of ridge and ANN models, underscoring the effectiveness of regularisation coupled with capturing of non-linearities in the data used. The RMSE of the combination of Ridge (FI) and ANN - at 0.55 is almost one-fourth of the baseline random walk model and almost one-third of the traditional univariate time-series models, suggesting sizeable nowcasting gains from the augmented modelling approach adopted in this paper. | Table 4: Performance Comparison of Alternative Models | | Comparison vis-à-vis Actual Food Inflation (y-o-y) | | Nowcast Period: Jan 2023 – Dec 2023 | | Model Type | Model | RMSE | | MAE | | Complexity | | Full Sample | Excluding 2023Q3 | Full Sample | Excluding 2023Q3 | | Univariate Linear | Random Walk | 2.15 | 1.09 | 1.54 | 0.93 | No Alternative Information | | ARIMA | 1.61 | 0.67 | 1.07 | 0.52 | | SARIMA | 1.57 | 0.76 | 1.07 | 0.64 | | Multivariate Linear | LR | 0.73 | 0.51 | 0.54 | 0.39 | Retail and Wholesale Price Information | | SARIMAX | 0.68 | 0.53 | 0.55 | 0.43 | | Ridge | 0.63 | 0.41 | 0.49 | 0.35 | | LR | 0.77 | 0.65 | 0.62 | 0.54 | Full Information | | SARIMAX | 0.73 | 0.63 | 0.60 | 0.51 | | Ridge | 0.55 | 0.40 | 0.45 | 0.33 | | Multivariate ML-based | ANN | 0.60 | 0.47 | 0.51 | 0.38 | Full Information + ML | | SVR | 0.68 | 0.51 | 0.52 | 0.41 | | Combinations | Ridge(PI)+ANN | 0.59^ | 0.41 | 0.47^ | 0.33^ | | | Ridge(FI)+ANN | 0.55 | 0.40 | 0.44^ | 0.31^ | Notes: 1. MAE: Mean Absolute Error; LR: Linear Regression; PI: Price Information (retail and wholesale); FI: Full Information.
2. All models include a seasonal lag (12th lag) of target variable as an explanatory variable.
3. Combinations are based on RMSE-weighted average of nowcasts. ^ indicates improvement with nowcast combination if RMSE (Combination) < Minimum (RMSEs of individual models).
Source: RBI staff estimates. |
 VI. Conclusion This study investigates the effectiveness of leveraging alternative information and modelling techniques in improving food inflation nowcasting in India. The empirical findings demonstrate that expanding the input information set and going beyond conventional univariate modelling to include additional high frequency price and non-price indicators significantly improves nowcast precision by capturing complex supply-side dynamics influencing food prices in India. Moreover, the study highlights the advantages of employing alternative modelling approaches including regularisation (shrinkage) and ML-based techniques over traditional linear models, which are known to excel in processing high-dimensional data, reducing overfitting, accounting for non-linearities and therefore, enhancing the predictive performance. The results also indicate that combining diverse models further boosts the accuracy of nowcasts, advocating for the adoption of an ensemble approach in predictive modelling exercises. The insights obtained from this study can, therefore, provide valuable support for informed policymaking in an environment of recurrent and large volatile food price dynamics in India. Future research could explore the integration of additional unstructured data sources, employing more advanced deep learning architectures, and investigating the feasibility of extending this framework to other components of inflation. References Aliaj, T., Ciganovic, M., and Tancioni, M. (2023). Nowcasting Inflation with Lasso-Regularized Vector Autoregressions and Mixed Frequency Data. Journal of Forecasting, 42(3), 464-480. Banbura, M., Giannone, D., and Reichlin, L. (2010). Nowcasting. Working Paper Series, No. 1275, European Central Bank. Beck, G. W., Carstensen, K., Menz, J. O., Schnorrenberger, R., and Wieland, E. (2023). Nowcasting Consumer Price Inflation Using High-Frequency Scanner Data: Evidence from Germany. Deutsche Bundesbank Discussion Paper No. 34/2023. Bhoi, B. B., Kundu, S., Kishore, V., and Suganthi, D. (2019). Supply Chain Dynamics and Food Inflation in India. RBI Bulletin, Vol. 73(10), 95-111. Binner, J. M., Bissoondeeal, R. K, Elger, T., Gazely, A. M., and Mullineux, A. W. (2005). A Comparison of Linear Forecasting Models and Neural Networks: An Application to Euro Inflation and Euro Divisia. Applied Economics, Vol. 37(6), 665-680. Cachia, F. (2014). Nowcasting Regional Consumer Food Inflation. Food and Agriculture Organisation of the United States Working Paper Series, ESS/14-07. Chakraborty, C., and Joseph, A. (2017). Machine Learning at Central Banks. Bank of England Staff Working Papers, No. 674. Clark, T. E., Leonard, S., Marcellino, M., and Wegmüller, P. (2022). Weekly Nowcasting US Inflation with Enhanced Random Forests. Federal Reserve Bank of Cleveland. Desai, A. (2023). Machine Learning for Economics Research: When What and How? Staff Analytical Note 2023-16, Bank of Canada. Drucker, H., Burges, C. J., Kaufman, L., Smola, A., and Vapnik, V. (1996). Support Vector Regression Machines. Advances in Neural Information Processing Systems, 9. Faust, J., and Wright, J. H. (2013). Forecasting Inflation. Handbook of Economic Forecasting, Vol. 2 (Elsevier), 2–56. Goulet Coulombe, P., Leroux, M., Stevanovic, D., and Surprenant, S. (2022). How is Machine Learning Useful for Macroeconomic Forecasting? Journal of Applied Econometrics, 37(5), 920-964. Hoerl, A. E., and Kennard, R. W. (1970). Ridge Regression: Biased Estimation for Nonorthogonal Problems. Technometrics, 12(1), 55-67. IMF. (2022). Countering The Cost-Of-Living Crisis. World Economic Outlook, October 2022, International Monetary Fund (IMF). John, J., Singh, S., and Kapur, M. (2020). Inflation Forecast Combinations – The Indian Experience. Reserve Bank of India Working Paper Series WPS (DEPR): 11/2020. Joseph, A., Potjagailo, G., Chakraborty, C., and Kapetanios, G. (2024). Forecasting UK Inflation Bottom Up. International Journal of Forecasting. Knotek, E. S., and Zaman, S. (2017). Nowcasting US Headline and Core Inflation. Journal of Money, Credit and Banking, 49(5), 931-968. Krüger, F., Clark, T. E., and Ravazzolo, F. (2017). Using Entropic Tilting to Combine BVAR Forecasts with External Nowcasts. Journal of Business and Economic Statistics, 35(3), 470–485. LeCun, Y., Bengio, Y., and Hinton, G. (2015). Deep Learning. Nature, 521(7553), 436-444. Macias, P., Stelmasiak, D., and Szafranek, K. (2023). Nowcasting Food Inflation with a Massive Amount of Online Prices. International Journal of Forecasting, Vol. 39, Issue 2, April–June 2023, 809-826. Modugno, M. (2013). Now-casting Inflation Using High Frequency Data, International Journal of Forecasting, Vol. 29, Issue 4, 2013, 664-675. Noble, W. S. (2006). What is a Support Vector Machine? Nature Biotechnology, 24(12), 1565-1567. Pratap, B., Ranjan, A., Kishore, V., and Bhoi, B. B. (2022). Forecasting Food Inflation Using News-based Sentiment Indicators. Reserve Bank of India Occasional Papers, 42(2). RBI. (2020). Monetary Policy Report, April. Richardson, A., Van Florenstein Mulder, T., and Vehbi, T. (2021). Nowcasting GDP Using Machine-Learning Algorithms: A Real-Time Assessment. International Journal of Forecasting, 37(2), 941-948. Seabold, S. and Coppola, A. (2015). Nowcasting Prices Using Google Trends: An Application to Central America, Policy Research Working Paper Series 7398, The World Bank. Sekhar, C. S. C., Roy, D., and Bhatt, Y. (2018). Food Inflation and Volatility in India: Trends and Determinants. Indian Economic Review (2018) 53:65–91. Silva e Silva, L., Mongeau Ospina, C. A., and Fabi, C. (2024). Food Price Inflation Nowcasting and Monitoring. Statistical Journal of the IAOS, Vol. 40, No. 2, 325-339. Singh, N., and Bhoi, B. B. (2022). Inflation Forecasting in India: Are Machine Learning Techniques Useful? Reserve Bank of India Occasional Papers, Vol. 43, No. 2: 2022, 46-88. Stock, J. H., and Watson, M. W. (2004). Combination Forecasts of Output Growth in a Seven-Country Data Set. Journal of Forecasting, 23(6), 405-430.
Annex | Table A1: Stationarity Tests | | Variable | ADF Test Statistic | P-value | Result | | Food Inflation (y-o-y) | -2.19 | 0.21 | Non-stationary | | CPI Food momentum (m-o-m) | -6.20*** | 0.00 | Stationary | Notes: 1. Estimates are based on data for January 2014-December 2022.
2. *: P < 0.10; **: P < 0.05; ***: P < 0.01
Source: RBI staff estimates. |
| Table A2: Description of Input Information | | Information | Sources | | Retail Prices | DCA, MCE, GoI; NHB, MAFW, GoI | | Wholesale and Mandi Prices | WPI; Agmarknet, MAFW, GoI | | International Prices | IMF | | WPI Input Prices | WPI, MCI, GoI | | Rural Wages | Labour Bureau, MLE, GoI | | Rainfall | IMD, GoI | | Reservoir Level | CMIE | | Market/mandi Arrivals | Agmarknet, MAFW, GoI | | Oil/Energy Prices | MoPNG, GoI; IMF | | Exchange Rate | FBIL | | Google Trends | Google | | Note: GoI: Government of India; DCA: Department of Consumer Affairs; MCE: Ministry of Consumer Affairs; NHB: National Horticulture Board; MAFW: Ministry of Agriculture and Farmers Welfare; WPI: Wholesale Price Index; MCI: Ministry of Commerce and Industry; IMF: International Monetary Fund; MLE: Ministry of Labour and Employment; IMD: Indian Meteorological Department; CMIE: Centre for Monitoring Indian Economy; MoPNG: Ministry of Petroleum and Natural Gas; FBIL: Financial Benchmarks India Pvt. Ltd. |
| Table A4: List of Final Input Variables | | | Before PCA | After PCA and FS | | S.No. | Input Variables
(m-o-m, per cent) | Contemporaneous + Lags | Final Variables | | 1 | Retail Price Index (RPI) | 1 | Retail Price (DCA and NHB) Index Momentum | | 2 | WPI Food | 2 | 2 Principal Components | | 3 | Mandi Price Index | 3 | | 4 | WPI Farm Inputs Index | 2 | 6 Principal Components | | 5 | WPI Industrial Inputs Index | | 6 | Rural Wages | 1 | | 7 | Absolute Rainfall Deviation from LPA (per cent) | 3 | | 8 | Reservoir Level Deviation from LPA (per cent) | | 9 | Market Arrivals Index | | 10 | IMF Food and Beverages Index | | 11 | IMF Agricultural Raw Materials Index | | 12 | Oil Price | | 13 | Exchange Rate | | 14 | Google Trends Index | | | Total | 35 | 9 | Notes: 1. All variables are in month-on-month (m-o-m) per cent change form, except for absolute rainfall deviation from LPA (per cent) and reservoir level deviation from LPA (per cent).
2. FS: Forward Selection; LPA: Long Period Average.
3. Google Trends Index corresponds to the term “Food Prices” for the Indian region. |
| Table A5: Detail on Alternative Nowcasting Models | | Dependent Variable: Y = CPI Food momentum | | Model Type | Complexity | Model | Explanatory Variables and Model Structure | R2 | AIC | | Univariate Linear | No Alternative Information | ARIMA | C, (p,d,q) = (4,0,2) | 0.43 | 2.79 | | SARIMA | C, (p,d,q)(P,D,Q) = (1,0,2)(1,0,1) | 0.50 | 2.77 | | Multivariate Linear | Retail and Wholesale Price Information | LR | C, CPI Food Momentumt-12, RPI Momentumt, PCs capturing WPI and mandi food prices | 0.79 | 1.63 | | SARIMAX | C, (p,d,q)(P,D,Q) = (1,0,1)(0,0,0), RPI Momentumt, PCs capturing WPI and mandi food prices | 0.81 | 1.65 | | Ridge | C, RPI Momentumt, WPI and mandi food price variables
Method = K-Fold | 0.81 | - | | Full Information | LR | C, CPI Food Momentumt-12, RPI Momentumt, PCs capturing WPI and mandi food prices and rest of information | 0.85 | 1.45 | | SARIMAX | C, (p,d,q)(P,D,Q) = (1,0,1)(0,0,0), RPI Momentumt, PCs capturing WPI and mandi food prices and rest of information | 0.88 | 1.47 | | Ridge | C, all variables capturing food prices and rest of information
Method = K-Fold | 0.88 | - | | Multivariate ML-based | Full Information + ML | ANN | C, CPI Food Momentumt-12, RPI Momentumt, PCs capturing WPI and mandi food prices and rest of information
Hyperparamters:
1 hidden layer with 3 nodes,
Activation function = Sigmoid,
Learning Rate = 0.005,
Runs = 1000 | - | - | | SVR | C, CPI Food Momentumt-12, RPI Momentumt, PCs capturing WPI and mandi food prices and rest of information
Hyperparamters:
Kernel = Linear
C (regularisation parameter) = 0.1
Epsilon = 0.01 | - | - | Notes: 1. ‘p’,’d’ and ‘q’ refer to the autoregressive, differencing and moving average orders, while ‘P’, ‘D’ and ‘Q’ are seasonal autoregressive, seasonal differencing and moving average orders; ‘X’ refers to the set of exogenous variables.
2. C: Constant; AIC: Akaike Information Criterion; ‘Xt-n’ refers to nth lag of variable X.
Source: RBI staff estimates. |
|