by Rajib Das, Dhanya V, Amarendra Acharya, Ramesh Golait, Silu Muduli and Arjit Shivhare^ The COVID-19 pandemic adversely affected all sectors of the Indian economy, including the MSME sector. Drawing on survey conducted on select MSME clusters, this article investigates the performance and state of formalisation of MSME sector. Expenses related to electricity, rent, and debt service emerge as the key factors influencing the net profit margin of MSMEs in the post-pandemic period. Liquidity and regulatory measures by the Reserve Bank and Government schemes such as the Emergency Credit Line Guarantee Scheme (ECLGS) supported these enterprises in the aftermath of the pandemic. The paper’s observations and results may not necessarily hold for the entire MSME sector, as the current study is limited to MSME firms within the sampled clusters and the characteristics and behaviour of the firms outside the clusters could be different. Introduction Micro, small, and medium enterprises (MSMEs) are well-known forms of business enterprises across the globe, having features like small size, independent entities and limited market exposure. MSMEs contribute significantly to inclusive development by fostering entrepreneurship and generating employment at comparatively lower capital costs. The COVID pandemic disrupted the business landscape for MSMEs across geographies, including India. In response, the Government of India (GoI) and the Reserve Bank introduced specific policies to alleviate working capital issues and ensure business continuity in the MSME sector, apart from general monetary and fiscal support measures. With the pandemic receding, the Indian economy began its recovery in subsequent periods. Various policy measures have been implemented by the government over the decades for the development of this sector in India, the prominent one being the cluster approach to MSME development. A large segment of MSMEs in India falls under the micro category, which face more acute challenges in their operations. A cluster approach to MSME development was conceptualised as a policy instrument to address the limitations arising from the ‘smallness’ of the firm. Clusters provide micro and small firms a competitive advantage through many avenues, primarily through proximity to raw materials, suitable business development services, marketing facilities, and skilled labour (Krugman, 1991). The initial move towards a cluster approach in India began in 1998 with efforts to promote technology adoption in small industries. By 2003, a more comprehensive approach to cluster development was envisioned encompassing marketing, exports, and skill development, establishing common facility centres, and implementing technology upgrades for enterprises. Against this backdrop, this study, based on a primary survey conducted among select MSME clusters, examines the performance of MSME firms and the effectiveness of policy measures initiated during the pandemic. It also analyses the major factors influencing the profitability of MSME firms and their variability pre- and post-COVID pandemic. The paper is structured into four sections, starting with the introduction. Section II presents the status of the MSME sector, including definition, historical background and policy measures taken by GoI and RBI. Section III delves into the empirical analysis, outlining the survey methodology and presenting stylised facts. Section IV presents concluding remarks. II. Status of MSMEs in India II.1 Definition and Historical Background The MSME sector is markedly heterogeneous, characterised by variations in enterprise size, the range of products and services offered, and the level of technology utilised. As per the MSME Act 2006, MSMEs were initially defined in terms of plant and machinery/equipment investment limits. However, due to their informal and small scale of operations, classifying MSMEs based on investment criteria was viewed as difficult (RBI, 2019). In 2020, the Government of India included turnover as a criterion along with the earlier criterion based on investment in machinery and equipment. The introduction of Goods and Services Tax (GST) in 2017 provided an avenue to verify the categorisation of MSMEs based on turnover from the Goods and Services Tax Network (GSTN) data, imparting transparency in the system. Further, the distinction between manufacturing and services was removed. Exports were also excluded from the turnover classification to widen the scope of MSMEs. Accordingly, at present: i. an enterprise is a micro-enterprise where the investment in plant and machinery or equipment is at most ₹1 crore, and the turnover is at most ₹5 crore. ii. a small enterprise, where the investment in plant and machinery or equipment does not exceed ₹10 crore, and the turnover does not exceed ₹50 crore; and iii. a medium enterprise, where the investment in plant and machinery or equipment is at most ₹50 crore, and the turnover does not exceed ₹250 crore. As per the National Sample Survey Organisation’s (NSSO) Annual Survey of Unincorporated Sector Enterprises, October 2022- September 2023, there were around 6.5 crore unincorporated non-agricultural MSMEs engaged in various economic activities in India. However, only 5.2 crore MSME units were registered in the Udyam Portal, an online portal for the registration of MSMEs, as of September 2024. As per NSSO, the MSME sector employed around 11 crore individuals during October 2022- September 2023, nearly one-fifth of total employment in the economy and 35 per cent of non-agricultural employment. MSMEs contribute to nearly 63-66 per cent of employment in high-income and upper-middle-income economies, 91 per cent of total employment in lower-middle-income economies and 81 per cent of employment in low-income economies (Haider et al, 2019). MSMEs in India broadly fall under the ‘micro category’ and face challenges in technology adoption, credit availability, infrastructure, and formalisation (RBI, 2019). While conclusive evidence is lacking on the impact of firm size on productivity, the ‘small nature’ of firms can prevent MSMEs from taking the benefit of economies of scale (Williamson, 1967; Utterback, 1994; Dhawan, 2001). Medium and large firms are more innovative than the smaller ones (GoI, 2014). Insufficient skilled labour, limited financing, lack of technological and market information, and inadequate infrastructure are barriers to innovations by MSME firms (GoI, 2014; Pachouri and Sharma, 2016). The cluster approach to economic development, pioneered by Michael Porter (Porter, 1990; Porter, 1998), gained traction across countries in the late 1990s and early 2000s to overcome the limitations faced by small independent units. The cluster approach gained broader importance when United Nations Industrial Development Organization (UNIDO) emphasised it in 2003 as a critical component of industrial development strategies and pointed out that the cluster has the potential to promote broad-based and inclusive growth (UNIDO, 2020). MSME clusters are proximate groupings of affiliated institutions and interconnected companies bound by shared technologies and expertise within a specific field. Typically, clusters are geographically situated to facilitate seamless communication, logistics, and interpersonal interaction, creating an environment conducive to productivity gains, a crucial factor for growth (Porter, 2003). The effectiveness of clusters hinges on the collaborative sharing of resources among small individual firms across various business processes such as manufacturing, technology, quality control, testing, marketing, and procurement. Clusters and associated networks enable small firms to combine the advantages of running a small unit with economies of scale and specialisation equivalent to large units (Magar, 2017). The initial official endorsement of clusters as the focal point for Small Scale Industry (SSI) development in India came from the Abid Hussain Committee Report (GOI, 1997). India has actively adopted a cluster development approach since 2003 to enhance economic development by bolstering the competitiveness and growth of MSMEs. The Ministry of MSME has defined clusters as a “group of enterprises located within an identifiable and as far as practicable, contiguous area or a value chain that goes beyond a geographical area and producing same/ similar/complementary products/services, which can be linked together by common physical infrastructure facilities that help address their common challenges. The essential characteristics of enterprises in a cluster are (a) Similarity or complementarity in the methods of production, quality control and testing, energy consumption, pollution control, etc., (b) Similar level of technology and marketing strategies/practices, (c) Similar channels for communication among the members of the cluster, (d) Common market and skill needs and (e) Common challenges and opportunities that the cluster faces”1. Cluster initiatives were recognised as efficient policy tools, enabling the focused allocation of resources and funding to specific areas with considerable potential for growth and development. This targeted approach is advantageous due to the potential spillover and multiplier effects that can extend beyond the initially identified locations. As per the India Cluster Observatory, there were 4361 clusters in India in September 2024, with 57.2 per cent of clusters belonging to the handicraft sector, followed by 30 per cent of industrial clusters and 13 per cent of handloom clusters. II.2 Policy Measures The Ministry of MSME introduced selective interventions in industrial clusters in 1998, and subsequently broad-based its MSE Cluster Development Programme through interventions such as capacity building, marketing development, export promotion, skill development, and setting up common facilities centres. The Ministry of MSME has also launched the Scheme of Fund for Regeneration of Traditional Industries (SFURTI) specifically for traditional khadi and village industries. The Department for Promotion of Industry and Internal Trade initiated the Industrial Infrastructure Upgradation Scheme (IIUS) in 2003 as a central sector scheme to boost industries’ competitiveness by enabling high-quality infrastructure development through collaborations between the public and private sectors in specific operational clusters. The government also revised the Micro and Small Enterprises – Cluster Development Programme (MSE-CDP) in 2007. It operates as a demand-driven central sector scheme wherein state governments send proposals for establishing common facility centres and the initiation/up-gradation of infrastructure development projects. The MSE-CDP scheme has effectively enhanced and bolstered the value chain of member and non-member units within the cluster, which is estimated to have led to an overall productivity increase of approximately 10-15 per cent, a similar order of reduction in manufacturing costs, and an increase in operational efficiency by approximately 15 per cent2. To enhance credit flows to MSMEs, a Credit Guarantee Fund Trust for Micro and Small Enterprises (CGTMSE) was established in 2000, which offered credit guarantee support to financial institutions for enabling collateral free loans to Micro and Small Enterprises (MSEs). In 2017, the scheme was widened to include non-banking financial companies (NBFCs) into the scheme acknowledging the vital role they play in credit disbursement to MSEs (Credit Guarantee Scheme for NBFCs - CGS-II). To address the issue of delayed payments to MSMEs, the Reserve Bank of India (RBI) introduced the Trade Receivables Discounting System (TReDS) in 2014. The TReDS is an electronic platform where MSMEs can secure financing of their receivables from buyers, including large corporates, public sector undertakings (PSUs), government departments, etc. at a discount. To mitigate the adverse impact of COVID pandemic on MSMEs, GoI and the Reserve Bank undertook a slew of measures to provide continuous access to credit and liquidity to the MSMEs to ensure business continuity of the sector. The Credit Guarantee Scheme for Subordinate Debt (CGSSD) was launched in 2020 to infuse credit into the stressed MSME units as equity, quasi equity or sub-debt. Further, under PM Street Vendor’s Atma Nirbhar Nidhi (PM SVANidhi), street vendors in urban areas were provided working capital credit to resume their business. The Emergency Credit Line Guarantee Scheme (ECLGS) was also introduced in 2020, providing additional funding to MSMEs through a fully guaranteed emergency credit line. The RBI launched the on-tap targeted long-term repo operations (TLTRO) scheme on October 9, 2020 to enable banks to provide liquidity support to a host of sectors, including MSMEs. Moreover, the Reserve Bank permitted loan moratorium subject to guidelines and exempted banks from keeping the cash reserve ratio (CRR) requirement against loans disbursed to first-time borrowers of micro, small and medium enterprises (MSMEs). In 2022, in sync with co-lending policies of RBI, the CGTMSE introduced Credit Guarantee Scheme for Co-Lending (CGSCL) for extending the guarantee coverage to credit facilities under co-lending model jointly by banks and NBFCs. III. Stylised Facts and Empirical Analysis III.1 Survey Methodology and Coverage The study is based on a primary survey among 110 clusters across 15 states and one union territory conducted during April-September 2023. The MSME firms were selected from pre-identified clusters in the UNIDO list of clusters and the state governments’ lists of MSME clusters. From each cluster, firms were selected randomly. In total, 3,246 MSMEs were interviewed for the study (Table 1). | Table 1: Distribution of Sample over States | | States | Number of MSMEs Surveyed | Share (Per cent) | | West Bengal | 625 | 19.3 | | Delhi | 557 | 17.2 | | Maharashtra | 376 | 11.6 | | Punjab | 353 | 10.9 | | Gujarat | 240 | 7.4 | | Tamil Nadu | 203 | 6.3 | | Karnataka | 194 | 6 | | Uttar Pradesh | 159 | 4.9 | | Rajasthan | 104 | 3.2 | | Odisha | 93 | 2.9 | | Andhra Pradesh | 81 | 2.5 | | Telangana | 81 | 2.5 | | Jharkhand | 61 | 1.9 | | Madhya Pradesh | 53 | 1.6 | | Haryana | 46 | 1.4 | | Assam | 20 | 0.6 | | Total | 3246 | 100 | | Source: Authors’ estimates based on the survey. |
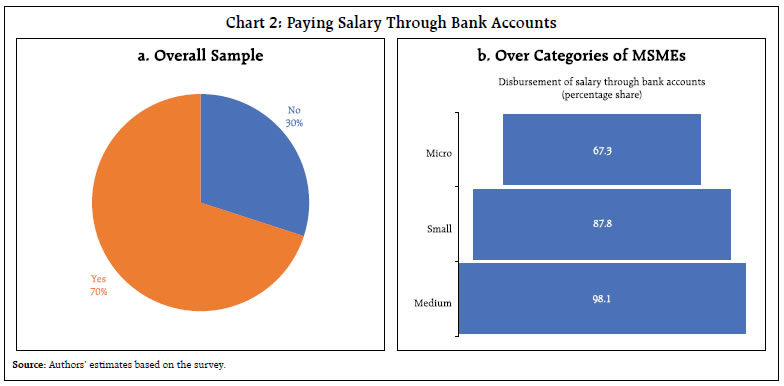
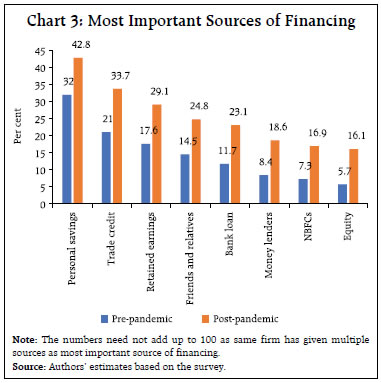
| Table 2: Distribution of Sample Firms Across Industry Groups | | NIC 2008 | Industry | Count of Response | Share (Per cent) | | 27 | Electrical equipment | 460 | 14.2 | | 14 | Wearing apparel | 280 | 8.6 | | 15 | Leather | 278 | 8.6 | | 29 | Motor vehicles | 258 | 7.9 | | 24 | Basic metals | 247 | 7.6 | | 13 | Textiles | 210 | 6.5 | | 28 | Machinery n.e.s | 192 | 5.9 | | 17 | Paper and paper products | 158 | 4.9 | | 10 | Food products | 149 | 4.6 | | 22 | Rubber and rubber products | 149 | 4.6 | | 20 | Chemical and chemical products | 139 | 4.3 | | 25 | Fabricated metal products | 118 | 3.6 | | 26 | Computer and electronic | 113 | 3.5 | | 21 | Pharmaceuticals | 110 | 3.4 | | 23 | Other metallic non-minerals | 104 | 3.2 | | 16 | Wood and wood products | 99 | 3.0 | | 32 | Other manufacturing | 85 | 2.6 | | 31 | Furniture | 80 | 2.5 | | 1 | Crops and animals | 17 | 0.5 | | | Total | 3246 | 100 | | Source: Authors’ estimates based on the survey. | The surveyed firms are classified based on the National Industrial Classification (NIC) 2008 into 18 manufacturing sub-sectors and one agricultural sector for ease of comparison. Firms manufacturing electrical equipment had the largest share in the sample, followed by apparel, leather industries, motor vehicles, base metals and textiles (Table 2). As the survey in this study covered only MSME firms within sampled clusters, the survey responses and the observation and analysis in this paper need not hold for the broader MSME sector. III.2 Stylised Facts III.2.1 Formalisation India has followed a multipronged approach to increase the degree of formalisation of the MSMEs. These include initiatives like the Employee Provident Fund Organisation (EPFO), Employee State Insurance Corporation (ESIC), registration with the Udyam portal and being part of the GST Network. Almost three-fourths of the sampled clusters belonged to the private sector, followed by cooperative and state government clusters. One-fifth of the surveyed firms were listed and 95 per cent had bank accounts. More than three-fourths of enterprises belonged to the micro-enterprise category, while small and medium firms accounted for 14 per cent and 2 per cent of total firms, respectively. The sales averaged ₹4.4 crore in 2022-23 ranging between ₹70,000 and ₹250 crore. Nearly 70 per cent of firms have internet connectivity and use it for their business operations. Around 71 per cent of the surveyed respondents have enrolled with the Udyam portal, an online platform for registering MSME units. Size-wise, 98, 84 and 69 per cent of the surveyed medium, small and micro enterprises, respectively, are registered with the Udyam portal. Over 80 per cent of the respondent MSME units with more than 10 employees have completed the registration process on the Udyam portal. More than half of the respondent MSME units are registered with EPFO and ESIC (Chart 1). III.2.2 Banking and Access to Finance Based on the survey, the majority of MSME firms are found to be bank-linked with nearly 70 per cent of MSME units disbursing employee salaries through their bank accounts. About 98 per cent of medium enterprises made direct salary deposits into employees’ bank accounts. The proportion is lower at around 67 per cent for micro enterprises (Chart 2a and 2b). According to the survey, MSME firms mostly used personal savings, trade credit and retained earnings to manage their enterprises’ expenses. Looking at sources which always remained most important, personal savings is found to be the top-most source of financing as per survey, followed by trade credit, retained earnings, friends and relatives, bank loans and money lenders. About 42.8 per cent of respondents viewed personal savings as the most important source of financing post-pandemic, while this proportion was 32 per cent pre-pandemic. While personal savings remained the most preferred source, the importance of trade credit, retained earnings and bank loan increased post-pandemic as 12.7 per cent, 11.5 per cent and 11.4 per cent of respondents respectively shifted their top preference to these categories (Chart 3). 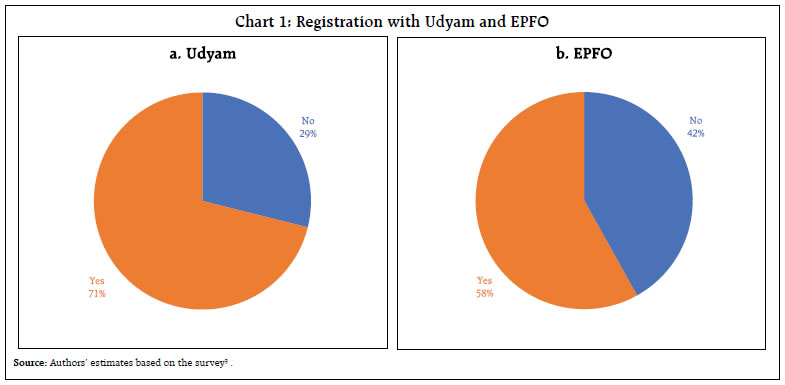
 Nearly 80 per cent of loans are taken from institutional sources, with 96 per cent of the quantum coming from institutional sources (Charts 4 and 5). Loans from commercial banks accounted for a significant share of outstanding loans, which holds true across micro, small, and medium segments. A large segment of firms have insured their assets/businesses. Of the 90 per cent of firms who responded to the question, 73 per cent had insured their assets.
III.2.3 Business and Economic Issues Faced by MSMEs On the relative importance of various constraints, competition from other firms turned out to be the major business issue faced by firms in both pre and post-COVID periods4, followed by GST-related issues and power supply disruptions. Government clearance and regulatory compliance were seen as manageable business issues by most firms, reflecting the ease of adhering to regulations and compliance functions in the cluster. Among the various business issues faced by firms, 23.5 per cent saw an increase in competition from other firms in the post-COVID period, while 18 per cent of firms saw a decline of the same. For most firms, the relative importance of issues remained the same for pre- and post-COVID periods, pointing towards the structural nature of these issues (Chart 6). 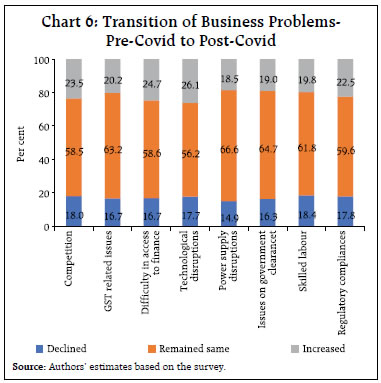 The pressure to reduce output prices amidst rising input prices was the major economic issue faced by the firms during both pre- and post-COVID periods. Nearly one-fourth of firms witnessed increased input prices, labour costs, and pressure to reduce output prices. Foreign competition and the exchange rate were the least important issues, as most of the respondent firms were domestic-oriented. For most firms, the relative importance of issues remained the same during the pre- and post-pandemic periods (Chart 7). III.2.4 Infrastructure Facilities Infrastructure and marketing facilities available in a cluster play an essential role in firms’ operations and profitability. In terms of physical infrastructure, all clusters are well-connected. All the respondent firms have access to roads within 2 kilometers. About 62 per cent have a warehouse within a vicinity of 5 km, with only 1.3 per cent having no warehousing facility. Non-response firms accounted for one-fifth of total firms and remaining firms have warehousing facility outside 5 km radius. 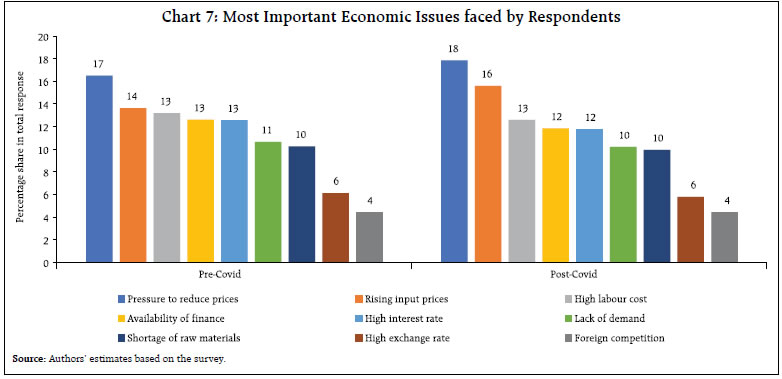
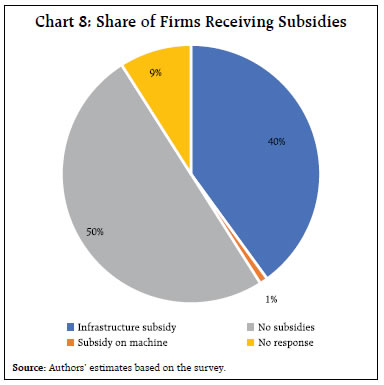 Regarding financial support for physical infrastructure5, about 40 per cent of firms across various clusters received one form of subsidy or the other (Chart 8). Amongst the firms receiving subsidies, 43 per cent got on electricity, 29 per cent on water and 27 per cent on land and buildings. About 2 per cent of firms received subsidy on all the three facilities and 1 per cent for purchasing machinery. Nearly 43 per cent of micro and small firms received at least one subsidy, while only less than one-fifth of medium enterprises received at least one subsidy. III.3 Empirical Findings The MSME sector was severely impacted by the COVID pandemic with both revenue and productivity witnessing a decline (Yangdol et al, 2023). The survey results indicate that in terms of the change in net profit margin (NPM) between 2022-23 and 2019-20, metals, wearing apparel and motor vehicles posted growth while pharmaceuticals, wood products and furniture registered decline over 2019-20 (Chart 9). To determine how the various expenses affect the MSME units’ NPM, we use the relative importance of regressors in the linear model approach by Lindeman, Merenda and Gold (1980). This methodology traces the contribution of each explanatory variable to the selected dependent variable. For a linear model with p regressors, 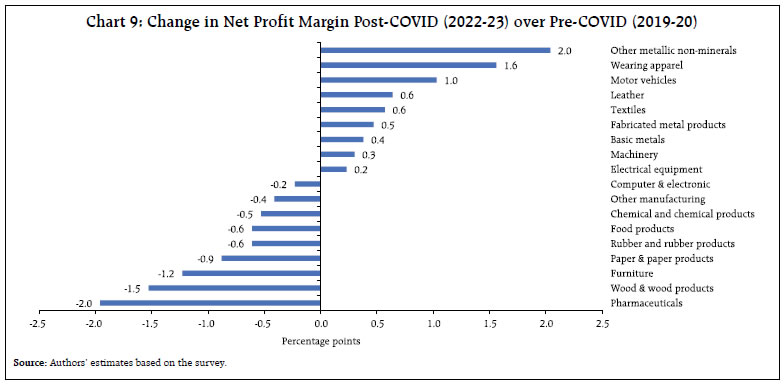
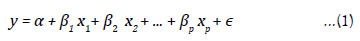 Where y is the dependent variable, xis are explanatory variables and ϵ is the error term that follows a standard normal distribution. R2overall provides the proportionate contribution each predictor makes considering both the direct effects and its effects combined with other variables in equation 1 (Pal and Bharati, 2019). All the explanatory variables contribute to this R2overall. The analysis of variance (ANOVA) also estimates the relative contribution; however, this is sensitive to the ordering of explanatory variables. Lindeman, Merenda and Gold (1980) approach estimates all orders based on the Shapley value methodology. This approach takes care of the ordering issue encountered in the case of the ANOVA. The NPM is used as the dependent variable for this analysis. To examine whether increases in certain expenses share have impacted the NPM, dummy variables for the changes in the shares of expenses are considered. The dummy takes a value of 1 if the expenses share in a particular segment in the post-COVID period is higher than the pre-COVID period; otherwise, it takes a value of 0. Chart 10 outlines the summary of the results. Rent and electricity expenses are seen as the most important determinants of profitability of the surveyed MSME units, followed by debt servicing and employees expenses. As noted earlier, firms in certain clusters were receiving financial support in the form of government subsidies towards electricity, land or machinery. To examine the impact of these financial incentives on firms’ profitability, a linear model is employed incorporating cluster effects for state and MSME clusters along with other response variables. Based on firms’ response to the availability of financial support, a binary or dummy variable has been created, taking the value 1 if the unit has received some form of subsidy and 0 otherwise. The unit’s NPM is the dependent variable in the exercise. The model’s estimation also has dummy control variables, including age, employee size, access to Udyam, ESIC, EPFO, and level of formalisation regarding salary payment through a bank account (For yes, it takes value 1, else 0). The regression results suggest that MSME units receiving subsidies had a higher NPM than those that have not received any subsidy. The results remain broadly consistent irrespective of the source of subsidy (Table 3). 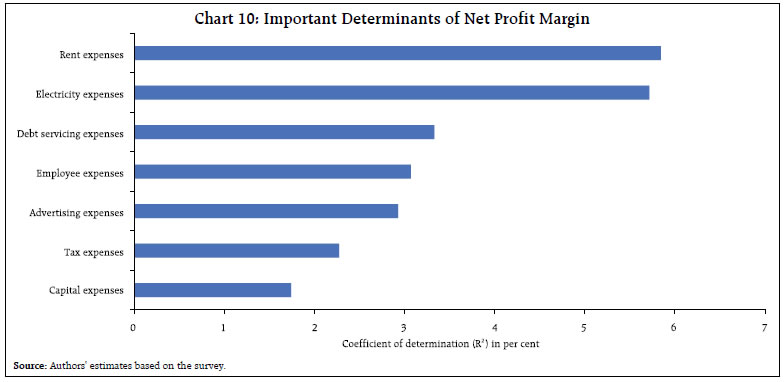
| Table 3: Impact of Subsidy on Firm Profitability | | | Dependent variable= Net Profit Margin (NPM) | | Model 1 | Model 2 | Model 3 | | Central government Subsidies | 11.40 ** | | | | | (3.90) | | | | State government Subsidies | | 10.74 ** | | | | | (3.68) | | | Central and State government | | | 11.94 ** | | Subsidies | | | (4.11) | | Constant | 18.54 *** | 19.23 *** | 19.39 *** | | | (1.65) | (1.64) | (1.76) | | No of Observations | 1957 | 1957 | 1957 | | R2 | 0.18 | 0.15 | 0.16 | | State and Cluster fixed effect | Yes | Yes | Yes | Note: Standard errors are in parentheses. * p < 0.1, ** p < 0.05, *** p < 0.01. Estimation controls for various unit-specific factors, including age, employee size, access to Udyam, ESIC, EPFO, and salary payment through a bank account.
Source: Authors’ estimates based on the survey. | III.4 Recent Government Schemes and MSMEs As noted earlier, various measures have been undertaken to ease the financing of MSMEs, particularly after the pandemic. Further, the Production Linked Incentive (PLI) scheme, initiated for 14 sectors, benefits MSMEs along with large firms. In our survey, one-third of respondents responded to the query on the various schemes and among these respondents, ECLGS ranked as the most beneficial followed by Mudra, PLI and TReDS. To further explore the impact of ECLGS, a difference-in-difference (DID) approach is applied to the NPM. It uses the NPM as the dependent variable along with the dummy for ECLGS use and its interaction terms concerning a particular year (ECLGS* Year dummy). The firm’s age is also used in the regression as an additional control. The effect of ECLGS on NPM is examined for 2022-23. In estimating the impact of the ECLGS, firms taking part in the ECLGS are the treatment firms, whereas other firms are the control firms. For this exercise, the following equation 2 is estimated. 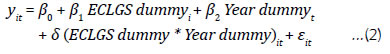
| Table 4: Difference-in-Differences (DID) Estimates of Performance of MSMEs After ECLGS Implementation | | | Net Profit Margin (NPM) | | Year Dummy | 0.19** | | | (0.0947) | | ECLGS Dummy | 6.96* | | | (0.5435) | | ECLGS* Year Dummy | 2.51* | | | (0.2094) | | Age | -0.09* | | | (0.0172) | | NIC Dummy | Yes | | Constant | 14.2* | | | (0.5347) | | Observations | 8726 | | R2 | 0.15 | Notes: 1. The dummy for NIC has been used.
2. * and ** represent significance at 1 and 5 per cent, respectively.
3. Figures in parentheses indicate standard errors.
Source: Authors’ estimates based on the survey. | ECLGS is the dummy variable for firms taking recourse to the ECLGS. β2 is the time dummy, which takes value 1 for the year after 2021-22 (though ECLGS is operationalised in 2020). The interaction term is ECLGS dummy * Year dummy. The coefficient of ECLGS dummy * Year dummy is the DID representing the effect of ECLGS on NPM after the implementation of the ECLGS. The empirical analysis suggests that the average NPM increased for all firms during 2022-23 (Table 4). Further, it increased for the firms taking recourse to the ECLGS relative to the firms which did not avail this scheme, as indicated by the significance of the interaction term. IV. Conclusion The study examined the performance of Micro, Small, and Medium Enterprises (MSMEs) across various clusters in India. It utilised primary survey data, which predominantly consisted of micro-enterprises, followed by small and medium-sized enterprises, reflecting the typical economic structure. According to the survey, a substantial portion of the respondent MSMEs in the surveyed clusters have formalised their operations through registration and benefited from various government schemes. A majority of the respondent MSMEs rely on internal sources such as savings or retained profits, while a notable proportion accessed external financing, primarily through bank loans and loans from long-term financial institutions. An empirical analysis, using difference-in-difference approach, suggests that firms receiving financial support from the government under the ECLGS exhibited higher NPMs in 2022-23 compared to those without government assistance. The paper’s observations and results may not necessarily hold for the entire MSME sector, as the current study is limited to MSME firms within the sampled clusters and the characteristics and behaviour of the firms outside the clusters could be different. Overall, the ongoing support for MSMEs, particularly in providing basic infrastructure like land, buildings, and power, is crucial. References Dhawan, R. (2001). Firm size and productivity differential: theory and evidence from a panel of US firms. Journal of Economic Behavior and Organization, 44(3), 269-293. doi:10.1016/S0167-2681(00)00139-6. GoI. (1997). Report of the Expert Committee on Small Enterprises (Chairman:Abid Hussain). Government of India. GoI. (2014). Understanding Innovation: Indian National Innovation Survey. New Delhi: Department of Science and Technology, Government of India. Haider, K., Khanna, M., Kotei, M., Kushnir, K., Singh, S. and Sridhar, T. (2019). Micro, Small and Medium Enterprises-Economic Indicators (MSME-EI) : Analysis Note. World Bank Group. Krugman, P. (1991). Increasing Returns and Economic Geography. Journal of Political Economy,99(3),483-99. doi:abs/10.1086/261763#. Lindeman, R. H., Merenda, P. F. and Gold, R. Z. (1980). Introduction to bivariate and multivariate analysis. Glenview, IL: Scott, Foresman. Magar, S. (2017). Cluster Approach for Development of MSME Sector in India. International Journal of Advanced Research, 5(11), 414-420. doi:10.21474/ IJAR01/5784. Pachouri, A., Sharma, S. (2016). Barriers to Innovation in Indian Small and Medium-Sized Enterprises. ADBI Working Paper 588. doi:10.2139/ssrn.2838109. Pal, M., Bharati, P. (2019). Relative Contribution of Regressors. Applications of Regression Techniques, 155-169. Singapore: Springer. Porter, M. (1990). The Competitive Advantage of Nations. Harvard Business Review, 68(2), 73- 93. Retrieved from https://hbr.org/1990/03/the-competitive-advantage-of-nations. Porter, M. (1998). Clusters and New Economics of Competition. Harvard Business Review, 76(6), 77-90. Retrieved from https://hbr.org/1998/11/clusters-and-the-new-economics-of-competition. RBI. (2019). Report of the Expert Committee on Micro, Small and Medium Enterprises (Chairman:U K Sinha). Reserve Bank of India. UNIDO. (2020). The UNIDO Approach to Cluster Development: Key Principles and Project Experiences. Vienna: United Nations Industrial Development Organisation. Utterback, J. (1994). Mastering the Dynamics of Innovation. Boston: Harvard Business School Press. Williamson, O. (1967). Hierarchical control and optimum firm size. Journal of Political Economy, 75, 123-138. doi:abs/10.1086/259258. Yangdol, R., Acharya, A. and Dhanya, V. (2023). COVID-19 and Productivity Performance of MSMEs and Large Firms in India. Reserve Bank of India Occasional Papers, 44(1).
|