by Pradip Bhuyan^ The anonymous nature of cash payments and the use of cash as both a mode of payment and a store of value presents significant challenges to measuring its usage. This article presents several approaches to measure the usage of cash and develops a quarterly indicator to measure the use of cash as a mode of payment in India to help policies on currency management. Introduction Data on cash usage can help a central bank in assessing the cash required in the system. Cash or currency in circulation (CIC) represents the total notes and coins in circulation in the economy. Cash is not only used as a mode of payment but also as a store of value. The use of cash could be on account of payments for consumption (to purchase goods and services), other purposes (lending, debt repayment, gift, donation, etc.) and precautionary holding (cash for emergency purposes such as medical emergencies). The Reserve Bank of India (RBI) is responsible for the overall supply and management of CIC in India. Unlike electronic and digital payments, cash payments do not leave any trail. It is therefore not possible to measure the direct usage of cash. Hence, an indirect approach is required to measure the same. The main objective of this article is to develop an indicator for the measurement of the usage of cash in India as a mode of payment for financial transaction. The rest of the article is organised as follows. Section II describes the recent trend in currency with the public (CWP) in India. The literature on methods of measuring cash usage in important economies is presented in section III. The methods proposed to measure the usage of cash in India are discussed in section IV. Results are analysed in section V. Conclusions are laid out in section VI. II. Currency with the Public in India CWP is defined by CIC minus cash with banks and accounts for around 95-97 per cent of CIC. There was a decline in the ratio of CWP to GDP from 2011-12 to 2014-15 (Table 1). The ratio saw a rise in 2015-16 but a sharp drop in 2016-17 due to the withdrawal of the legal tender character of the then existing ₹500 and ₹1000 banknotes in November 2016. CWP increased in the next year due to remonetisation. The ratio increased sharply in 2020-21 due to increase in cash intensity in the wake of the pandemic (RBI, 2021). The ratios have decreased in the subsequent years. In recent years, significant growth has been observed in retail digital payments (RDP), which is the total digital payments except for payments through real-time gross settlement (Table 2). Unified payments interface (UPI) launched in 2016, accounted for the highest share in RDP in volume in the last five years under reference. Moreover, y-o-y growth in UPI exceeded that in RDP in volume and value from 2017-18. The growth in UPI in value was higher than that in volume during the period. However, from 2021-22 to 2023-24 (post COVID-19 period), the growth in UPI in volume was higher than that in value. Consequently, the average size of UPI transactions decreased from ₹1838 in 2020-21 to ₹1525 in 2023- 24. The share of P2M (person to merchant) payments in total UPI transactions increased from 16.6 per cent in April 2021 to 26.2 per cent in March 2024 in value (Chart 1). In volume, the share increased from 45.2 per cent to 61.7 per cent during the same period. In this period, P2M payments increased nearly six-fold in volume and over five-fold in value and the growth far exceeded that observed for P2P (person to person) payments (Table 3). The decline in the average size of UPI transactions, the increase in the share of P2M in UPI (in volume and value) and the moderation in the ratio of CWP to GDP in 2023-24 from its pre-pandemic level suggest substitution of cash with UPI for small value transactions. Raj et al. (2020) found a reduction in demand for currency in the recent period with increased use of digital payments. | Table 1: Movement in GDP and CWP | | Years | CWP to GDP | Y-o-Y Growth | | CWP | Nominal GDP | | 2011-12 | 11.7 | 12.3 | 14.4 | | 2012-13 | 11.5 | 11.5 | 13.8 | | 2013-14 | 11.1 | 9.2 | 13.0 | | 2014-15 | 11.1 | 11.3 | 11.0 | | 2015-16 | 11.6 | 15.2 | 10.5 | | 2016-17 | 8.2 | -20.9 | 11.8 | | 2017-18 | 10.3 | 39.2 | 11.0 | | 2018-19 | 10.9 | 16.6 | 10.6 | | 2019-20 | 11.7 | 14.5 | 6.4 | | 2020-21 | 13.9 | 17.1 | -1.2 | | 2021-22 | 12.9 | 10.3 | 18.9 | | 2022-23 | 12.2 | 7.9 | 14.2 | | 2023-24 | 11.5 | 4.1 | 9.6 | Note: Data are in per cent.
Source: DBIE; Author’s calculations. |
| Table 2: Movement in RDP and UPI Transactions1 | | Years | Y-o-Y Growth (in per cent) | Share of UPI in RDP (in per cent) | Average Ticket Size of UPI (in ₹) | | RDP | UPI | | Volume | Value | Volume | Value | Volume | Value | | | 2016-17 | 64.2 | 45.2 | - | - | 0.2 | 0.1 | 3872.8 | | 2017-18 | 51.0 | 45.7 | 4992.0 | 1477.9 | 6.3 | 0.5 | 1200.0 | | 2018-19 | 59.9 | 38.3 | 489.1 | 698.5 | 23.3 | 3.1 | 1626.6 | | 2019-20 | 46.5 | 9.9 | 132.2 | 143.1 | 37.0 | 6.9 | 1702.9 | | 2020-21 | 28.6 | 16.4 | 78.4 | 92.5 | 51.3 | 11.4 | 1837.7 | | 2021-22 | 64.8 | 27.6 | 105.8 | 105.1 | 64.0 | 18.4 | 1831.3 | | 2022-23 | 58.4 | 28.4 | 82.2 | 65.3 | 73.6 | 23.7 | 1662.2 | | 2023-24 | 44.4 | 22.5 | 56.6 | 43.8 | 79.9 | 27.8 | 1525.2 | | Source: DBIE; and Author’s calculations. |
| Table 3: Growth in UPI (March 2024 over April 2021) | | UPI | P2P | P2M | | Volume | Value | Volume | Value | Volume | Value | | 403.7 | 297.9 | 244.9 | 248.1 | 596.6 | 548.8 | Note: Data are in per cent.
Source: NPCI; and Author’s calculations. |
III. Literature Review Benchmarking Currency (2023a) found usage of cash2 for just over two-fifths of payments among 17 central banks in 2022, slightly lower than that observed for 2021. The report found an increase in the value of cash in circulation in many jurisdictions and noted that cash retained its role as a store of value. Benchmarking Currency (2023b) report found cash usage averaged 40.6 per cent in 17 nations in 2022, as compared to an average of 45.2 per cent observed in 2021. Information available across various economies suggests decline in use of cash in those countries (Table 4). On the other hand, surveys conducted by Chile’s central bank indicated –that the proportion of people using cash more than once per week fell to 60 per cent in 2021 from 75 per cent in 2019 but rose to 79 per cent in 2022 (Central Banking, 2023). Based on the literature available on the usage of cash, the methods adopted for the measurement of cash usage can be divided into two – sample surveys and administrative records. In the information on usage of cash provided above, use cases in a few economies are based on surveys. Methods that can be applied based on administrative records are discussed below. | Table 4: Studies on Cash Usage in Select Countries | | Country | Period | Decline in cash usage | Source | | Australia | 2007-2019 | Consumer payments survey revealed a decline in the share of cash in total retail payments from 69 per cent in 2007 to 27 per cent in 2019. | Caddy et al., (2020) | | UK | 2010-2020 | The share of transactional cash use declined from over 50 per cent of payments in 2010 to 17 per cent of all payments in 2020. | BoE (2021) | | Euro area | 2016-2022 | Study on the payment attitudes of consumers found share of cash payments at the point of sale (PoS) in terms of volume and value declined to 59 and 42 per cent respectively in 2022 from 79 and 54 per cent in 2016. | ECB (2022) | | New Zealand | 2017-2020 | Cash use survey found proportion of the population indicating cash as one way to pay for daily things declined from 96 per cent in 2017 to 70 per cent in 2020 | RBNZ (2021) | | US | 2020-2022 | Diary of consumer payment choice survey revealed slight decline in 2022 in the share of payments made using cash to 18 per cent of all payments as compared to that in 2021 and 2020 due to increase in non-cash payments | Cubides and O’Brien, (2023) | | Canada | 2017-2021 | Methods-of-Payment Survey revealed share of purchases using cash in volume declined by 11 percentage points in 2021 from that in 2017 and was found as 22 per cent in 2021. In terms of value, the share however was almost the same, 14 per cent in 2021 and 15 per cent in 2017 | Henry et al., (2023) | | Sweden | 2020 | As per the survey of the payment behaviour, 9 per cent of respondents informed to use cash to make payments in 2020 in their most recent purchase. | SR (2020) | CIC to GDP is frequently used to measure cash demand (Amromin and Chakravorti, 2007). Drawing attention to the situation of a high stock of cash, Amromin and Chakravorti (2009) stated that if more merchants and consumers accepted cash alternatives, payment objectives were not the sole use of cash. They focussed on the ratio of coin and low-value currency denominations (small CIC) to GDP, as most cash was used for low-value purchases. A key feature of their method was the disentanglement of dual roles of cash as a store of value and medium of payment and isolating the transactional role of cash by focusing on small-denomination class, which they defined as currency and coin that were lower in value than that commonly dispensed by ATMs. They segregated the ratio of outstanding cash to GDP into large, medium, and small denominations. Medium denomination banknotes were defined as those prevalently distributed by ATMs based on their survey of thirteen central banks. Banknotes of small and large denominations were defined as those above and below this threshold. According to Khiaonarong and Humphrey (2019), there was more information on payment instruments that substituted for cash than on cash itself and suggested three alternative measures for cash use in a country as explained below. (i) Method based on residual household consumption (HC): This method estimates the use of cash in consumption as a residual, on the argument that, if information on cash use in a country is not sufficient, the same may be approximated by subtracting the value of all non-cash payment instruments used in consumption from total value of HC. It is thus based on the share of residual HC to total HC in the national accounts as shown below: where ‘Card’ is the value of all debit/ credit card payments, and ‘E money’ is the value of privately stored value cards or mobile phones with the value stored on a chip. (ii) Method based on the share of cash withdrawals in HC: It assumes that cash withdrawn from ATMs and over-the-counter (OTC) at banks (referred to as ATM cash and OTC cash respectively henceforth) in a country is almost all spent on HC items and defines the following measure: (iii) Method based on the share of cash withdrawals in total cash and cash-like payments: It is based on the value of cash withdrawals as a percent of the value of transactions made using these withdrawals plus cash substitutes viz. ‘Card’ and ‘E money’. The measure is defined as follows: Summarising the results of their three methods presented above, Khiaonarong and Humphrey (2019) observed that the cash share levels were mismeasured to differing degrees due to missing data. The use of the value of cash withdrawn from ATMs to measure the use of cash would provide more accuracy and would be a more timely measure (Khiaonarong and Humphrey, 2023). They stated that cash withdrawn at ATMs is of medium value denominations of currency notes commonly used for legal payment transactions and thus would exclude other uses (hoarding and illegal use). IV. Methodology The methods discussed in section III were evaluated for their applicability in estimating cash use in India. Measuring the usage of cash through surveys may be difficult for challenges as alluded to before. The ratio of CIC to GDP, although popular, does not distinguish between the demand for currency and the usage of cash for transaction purposes. Although transactions and precautionary motives were the original causes for holding currency, other motives however appeared with the progress of the financial system (Nachane et al., 2013). Awasthy et al. (2022) found precautionary and store-of-value motives influenced the sustained growth in currency demand. Methods popularly used to measure the demand for cash, viz. cash holdings per capita and cash outstanding to GDP do not distinguish between store of value and payment functions of cash (Amromin and Chakravorti, 2007). Khiaonarong and Humphrey (2019) stated that the ratio of CIC to consumption component of GDP could be more useful as cash is commonly used for consumption purpose. They further stated that CIC to GDP was frequently used to measure cash use as data on CIC and GDP were easily available. In the same vein, this paper suggests that CIC to GDP ratio may not be a good indicator for cash use. The second measure by Khiaonarong and Humphrey (2019) assumes that cash withdrawn from ATMs and OTC at banks is almost all spent on household consumption. Cash withdrawn could also be used as a store of value, and hence entire amount (almost) may not be spent for consumption. For example, the high rise in CIC during the COVID-19 pandemic was partly motivated by the precautionary response. Moreover, although data on ATM cash withdrawal is available in India in public, the same for OTC cash is not available. It is therefore not possible to know the share of ATM cash in total cash withdrawal in India. Therefore, the methods based on small CIC to GDP (Amromin and Chakravorti, 2007) and that on residual measure (Khiaonarong and Humphrey, 2019) are used India to estimate the use of cash for financial transactions in the country. Amromin and Chakravorti (2007, 2009) used the ratio of denominations lower to ATM dispensed notes to define small CIC. This paper however also adds some denominations dispensed by ATMs in India to small CICs, as explained later. The residual measure is suggested if there is not sufficient information in a country on cash use (Khiaonarong and Humphrey, 2019). Although an indirect approach, it is applicable for measuring the use of cash in India, and also, datasets required for this method are broadly available. Cash usage (CU) in India is therefore estimated based on the following in this article. (i) CIC of small and medium denominations (CICsm) (ii) CIC of small, medium, and high denominations (CICsmh) (iii) Residual HC. The methodologies proposed are explained below. Based on the analysis of CU derived, the paper proposes a cash usage indicator for India. IV.1 CU based on CICsm Consequent upon commencement of withdrawal of ₹2000 banknotes from circulation [although continues to remain legal tender (RBI, 2023)], ₹500 banknote is practically the highest denomination in circulation in the country. Hence, this paper considers denominations up to ₹200 banknotes as small and medium and defines small and medium CIC in India as follows: CIC of small and medium denominations at period t, where coins are of all denominations and banknotes are of denominations up to ₹200 at period t. Accordingly, the following formulae are used to measure the usage of cash based on CICsm at period t. GDPt and HCt are values of GDP and HC respectively at period t (at current prices). For HC, data on private final consumption expenditure were used (discussed later). CU based on CICsm could help to know the usage of cash in the form of small and medium denominations. IV.2 CU based on CICsmh The high denomination considered for this paper is taken as ₹500. Inclusion of denominations above ₹500 will mean that CICsmh is same as total CIC and cash outstanding to GDP do not distinguish between store of value and payment functions of cash (Amromin and Chakravorti, 2007). Definition used for CICsmh is as shown below: CIC of small, medium, and high denominations at period t, where coins include all denominations, and banknotes include denominations up to ₹500 at period t. The formulae used to measure the usage of cash based on CICsmh at period t are as follows. CU based on CICsmh could help to know the usage of cash including higher denominations. IV.3 CU based on Residual HC HC in the national accounts and non-cash payment instruments are the inputs used for this method (Khiaonarong and Humphrey, 2019). Private final consumption expenditure (PFCE) as part of national accounts statistics published by the Ministry of Statistics and Programme Implementation (MoSPI) which is made up of expenses by households on goods/ services acquired for consumption is taken as the measure of HC. PFCE also includes the final consumption of non-profit institutions serving households (NPISH). PFCE accounts for around 60 per cent of GDP in India. The residual method subtracts the value of all non-cash payment instruments used in HC and estimates cash use as the residual. Total PFCE minus the value of retail payments to merchants to purchase goods and services through digital mode used for PFCE (i.e., PFCEdigital) can be used as an estimate for the residual HC, which is the value of cash payments for PFCE (i.e., PFCEcash). PFCEdigital is estimated using data on retail digital payments to merchants by consumers to purchase goods and services as shown below. Regarding credit and debit cards, disaggregated data on payments are available for ‘PoS based’ and ‘Others’. For prepaid instruments, such data through ‘wallet’, ‘PoS based’ and ‘Others’ are available. PoS based payments are payments to merchants. However, payments to merchants through cards also happen outside ‘PoS’ and hence would be part of ‘Others’. At the same time, card payments on ‘Others’ could also possibly cover payments other than to merchants e.g. transfer of funds to bank accounts, other card accounts etc. Unlike cards, data on ‘PoS based’ are not available separately for wallet. The entire data on ‘wallet’ are therefore assumed to be for payments to merchants. P2M of UPI, BHIM Aadhaar pay, national electronic toll collection (NETC) are instruments used for payments to merchants. The components of RDP and their usability as non-cash payments to estimate payments to merchants is discussed in Annex A. PFCEdigital at period t is therefore estimated at two levels, lower and upper, as shown below: 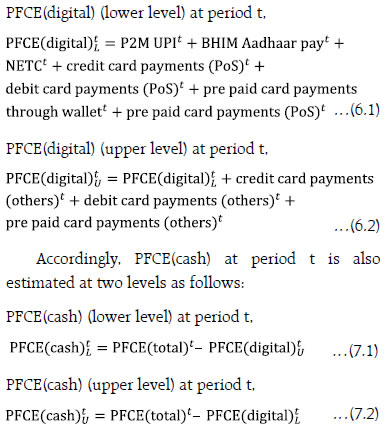 All the items considered for PFCE(digitalL represent payments to merchants. PFCE(digital)U includes, in addition to these items, ‘Others’ also on card payments. This item may not entirely represent payments to merchants as discussed above and some amount under this item may be for payments to merchants. Disaggregated data for it are however not available. Hence, PFCE(digital)L and PFCE(digital)U at period t are taken respectively as likely lower (excludes ‘Others’) and upper levels (includes ‘Others’) of PFCE(digital) at period t. PFCE(digital)L and PFCE(digital)U respectively can then be assumed as minimum and maximum possible values of digital modes of payments by consumers. Similarly, PFCE(cash)L and PFCE(cash)U at period t are respectively taken as probable lower and upper levels of PFCE(cash) at period t. Accordingly, use of digital payments (DP) in PFCE at period t is thus defined between two bounds, lower and upper as presented below.
V. Results The CICsm to GDP ratio declined in pre-demonetisation period (i.e., from 2011-12 to 2015-16) (Table 5). The ratio increased in the year 2016-17 mainly due to higher infusion of banknotes of lower denominations following demonetisation (RBI, 2017). The ratio started declining again after 2016-17 until 2020-21, the COVID-19 induced lockdown year (the ratio remained at same level in 2018-19 and 2019-20). In 2020-21 the ratio increased due to a fall in GDP and also higher precautionary holding of cash. The ratio however started declining again after 2020-21. Overall, although it increased marginally in 2023-24, the ratio was lower than that in 2020-21. Regarding CICsmh to GDP, the ratio remained in the range of 7 to 8 per cent during the period from 2011-12 to 2018-19 except in 2016-17 and 2017-18 (the ratio sharply fell in 2016-17 due to demonetisation and then increased in 2017-18 for remonetisation). The ratio increased noticeably from 2018-19 to 2020-21, probably due to higher holding of cash (arising from heightened uncertainty caused by COVID-19) but declined in 2021-22 and 2022-23. There was some increase in the ratio in 2023-24, due to rise in the share of ₹100, ₹200 and ₹500 banknotes in value terms as that of ₹2000 banknotes declined sharply reflecting the withdrawal of the latter denomination from circulation [RBI (2024)]. The ratio however remained in the range of 11 to 12 per cent in the last four years under reference. The share of CICsmh in total CIC however continuously increased from 2016-17 in volume and from 2017-18 in value. | Table 5. CU based on the ratios of CICsm and CICsmh to GDP | | Years | CICsm to GDP | CICsmh to GDP | Shares in CIC (Volume) | Shares in CIC (Value) | | CICsm | CICsmh | CICsm | CICsmh | | 2011-12 | 2.4 | 8.2 | 90.7 | 97.6 | 19.4 | 67.5 | | 2012-13 | 2.2 | 7.5 | 90.5 | 97.3 | 18.2 | 63.6 | | 2013-14 | 2.0 | 7.1 | 90.2 | 97.0 | 17.1 | 60.9 | | 2014-15 | 1.9 | 7.1 | 89.7 | 96.9 | 15.9 | 61.3 | | 2015-16 | 1.8 | 7.5 | 88.8 | 96.8 | 14.7 | 62.0 | | 2016-17 | 2.4 | 4.3 | 95.7 | 98.4 | 28.1 | 50.1 | | 2017-18 | 2.2 | 6.7 | 91.5 | 98.5 | 20.6 | 62.9 | | 2018-19 | 2.1 | 7.8 | 89.2 | 98.6 | 18.8 | 69.2 | | 2019-20 | 2.1 | 9.4 | 86.5 | 98.8 | 17.4 | 77.6 | | 2020-21 | 2.2 | 11.9 | 83.4 | 99.0 | 15.1 | 82.8 | | 2021-22 | 1.8 | 11.5 | 81.3 | 99.2 | 13.7 | 86.3 | | 2022-23 | 1.6 | 11.2 | 79.8 | 99.3 | 12.9 | 89.3 | | 2023-24 | 1.7 | 11.9 | 78.4 | 99.9 | 14.1 | 99.8 | Note: Data are in per cent.
Source: Author’s calculations based on Annual Reports of RBI (various years) and (GoI, 2024). | V.1 CU based on the ratios of CICsm and CICsmh to PFCE Values of the ratios are presented in Table 6. Observations are almost similar in nature to those observed in the corresponding ratios to GDP and suggest declining use of CIC by households. | Table 6: CU based on the ratios of CICsm and CICsmh to PFCE | | Years | CIC sm to PFCE | CICsmh to PFCE | | 2011-12 | 4.2 | 14.6 | | 2012-13 | 3.8 | 13.4 | | 2013-14 | 3.4 | 12.2 | | 2014-15 | 3.2 | 12.2 | | 2015-16 | 3.0 | 12.7 | | 2016-17 | 4.1 | 7.3 | | 2017-18 | 3.8 | 11.5 | | 2018-19 | 3.6 | 13.2 | | 2019-20 | 3.5 | 15.5 | | 2020-21 | 3.5 | 19.5 | | 2021-22 | 3.0 | 18.8 | | 2022-23 | 2.6 | 18.4 | | 2023-24 | 2.8 | 19.7 | Note: Data are in per cent.
Source: Author’s calculations. | V.2 Issues on use of CU based on CICsm and CICsmh It is found that the ratios CICsm to GDP, CICsm to PFCE, CICsmh to GDP and CICsmh to PFCE were broadly unchanged during the period under study. On the other hand, the ratios of RDP to GDP increased from around 70 per cent in 2015-16 to nearly 244 per cent in 2023-24 (Chart 2). In the absence of comprehensive data on the use CICsm and CICsmh for financial transactions, the direct use of their values alone will not help to measure appropriately use of cash in India in the light of fast adoption of digital modes of payments in the country. V.3 CU based on Residual HC Following the approach stated in section IV3, the estimated values of PFCE(digital)L, PFCE(digital)U, PFCE(cash)L and PFCE(cash)U are presented in Table 7. The y-o-y growth in cash payments by households [PFCE(cash)L and PFCE(cash)U] was positive in the quarters ending with March, June, and September in the year 2022; the growth was negative in the subsequent quarters. The growth in digital payments by households on the other hand was significantly higher. The distribution of PFCE(digital) is presented in Annex B. P2M of UPI accounted for the highest share in PFCE(digital). The estimated shares of cash and digital payments in PFCE are presented in Table 8. It may be observed that the use of cash was dominant in PFCE during the period under study but with a declining share. 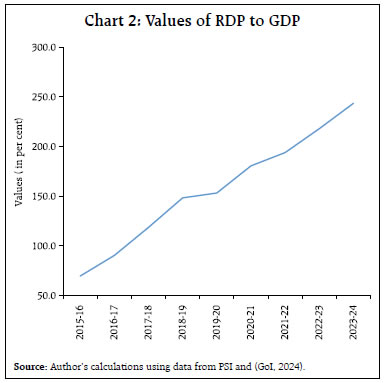
| Table 7: Estimated Values of PFCE(digital) and PFCE(cash) | | Years | Quarters | PFCE (total) | PFCE (digital)L | PFCE (digital)U | PFCE (cash)L | PFCE (cash)U | | 2021 | Jan-Mar | 34.5 | 4.8 | 6.7 | 27.8 | 29.7 | | April-Jun | 29.6 | 4.7 | 6.6 | 23.0 | 24.8 | | Jul-Sep | 34.5 | 6.3 | 8.5 | 26.0 | 28.2 | | Oct-Dec | 40.5 | 7.8 | 10.3 | 30.2 | 32.7 | | 2022 | Jan-Mar | 39.3 | 8.0 | 10.5 | 28.8 | 31.3 | | (14.1) | (66.6) | (56.7) | (3.8) | (5.6) | | Apr-Jun | 38.4 | 9.2 | 12.0 | 26.4 | 29.2 | | (30.0) | (94.7) | (83.5) | (14.8) | (17.7) | | Jul-Sep | 40.5 | 10.4 | 13.4 | 27.1 | 30.1 | | (17.5) | (64.1) | (57.3) | (4.5) | (7.0) | | Oct-Dec | 43.8 | 11.7 | 14.7 | 29.1 | 32.1 | | (8.2) | (50.6) | (42.2) | -(3.4) | -(1.9) | | 2023 | Jan-Mar | 41.5 | 12.1 | 15.1 | 26.3 | 29.4 | | (5.5) | (52.1) | (44.5) | -(8.7) | -(6.3) | | Apr-Jun | 41.5 | 13.4 | 16.6 | 25.0 | 28.2 | | (8.1) | (45.1) | (37.6) | -(5.4) | -(3.6) | | Jul-Sep | 43.3 | 14.9 | 18.4 | 24.9 | 28.4 | | (6.9) | (44.0) | (37.4) | -(8.2) | -(5.9) | | Oct-Dec | 48.0 | 17.1 | 21.0 | 27.1 | 31.0 | | (9.7) | (46.2) | (43.0) | -(7.0) | -(3.5) | | 2024 | Jan-Mar | 45.3 | 18.2 | 21.8 | 23.5 | 27.1 | | (9.3) | (49.9) | (43.8) | -(10.6) | -(7.5) | | Financial Years | | | | | | | 2021-22 | 143.8 | 26.8 | 35.9 | 108.0 | 117.1 | | 2022-23 | 164.2 | 43.4 | 55.2 | 109.0 | 120.8 | | (14.2) | (62.1) | (54.0) | (1.0) | (3.2) | | 2023-24 | 178.2 | 63.6 | 77.7 | 100.5 | 114.7 | | (8.5) | (46.5) | (40.7) | -(7.8) | -(5.1) | Notes: 1. PFCE(total) = ‘PFCE(digital)L + PFCE(cash)U’ or ‘PFCE(digital)U + PFCE(cash)L’.
2. Values are in ₹ lakh crore.
3. Figures in brackets are y-o-y growths in per cent.
Source: Author’s estimates. | V.4. Construction of Cash Usage Indicator (CUI) for India CICsm and CICsmh are based on CIC and are more appropriate for measuring demand for cash, but they may not properly reflect the usage of cash. They do not discriminate between cash holdings for payment vis-à-vis that for store of value purposes (Amromin and Chakravorti, 2007). The residual method, on the other hand, could reflect better the actual usage of cash in retail payments by the households. This paper, therefore, proposes an interval-based cash usage indicator (CUI) using the residual measure as shown below: | Table 8: Use of Cash and Digital Payments in PFCE | | Years | Quarters | Use of cash in PFCE | Use of digital modes in PFCE | | CUL | CUU | DPL | DPU | | 2021 | Jan-Mar | 80.6 | 86.1 | 13.9 | 19.4 | | Apr-Jun | 77.8 | 84.0 | 16.0 | 22.2 | | Jul-Sep | 75.3 | 81.7 | 18.3 | 24.7 | | Oct-Dec | 74.5 | 80.8 | 19.2 | 25.5 | | 2022 | Jan-Mar | 73.3 | 79.7 | 20.3 | 26.7 | | Apr-Jun | 68.7 | 76.0 | 24.0 | 31.3 | | Jul-Sep | 66.9 | 74.4 | 25.6 | 33.1 | | Oct-Dec | 66.5 | 73.3 | 26.7 | 33.5 | | 2023 | Jan-Mar | 63.5 | 70.8 | 29.2 | 36.5 | | Apr-Jun | 60.1 | 67.8 | 32.2 | 39.9 | | Jul-Sep | 57.5 | 65.5 | 34.5 | 42.5 | | Oct-Dec | 56.4 | 64.5 | 35.5 | 43.6 | | 2024 | Jan-Mar | 51.9 | 59.9 | 40.1 | 48.1 | | Financial Years | | 2021-22 | 75.1 | 81.4 | 18.6 | 24.9 | | 2022-23 | 66.4 | 73.6 | 26.4 | 33.6 | | 2023-24 | 56.4 | 64.3 | 35.7 | 43.6 | Notes: 1. Data are in per cent.
2. Total = CUL + DPU (or CUU + DPL)
Source: Author’s estimates. | VI. Conclusion This article attempts to measures the usage of cash in India as a mode of payment using different methods and the analysis suggests that the residual household consumption expenditure-based approach could be more appropriate. A cash usage indicator (CUI) constructed in the article taking into account both physical and digital modes of payments indicates that the cash usage remains significant but has been declining during the period under study. CUI developed in the article is a quarterly indicator and can facilitate currency management. | Table 9: Estimated Values of CUI for India | | Years | Quarters | Values of CUI | | 2021 | Jan-Mar | 80.6 | - | 86.1 | | Apr-Jun | 77.8 | - | 84.0 | | Jul-Sep | 75.3 | - | 81.7 | | Oct-Dec | 74.5 | - | 80.8 | | 2022 | Jan-Mar | 73.3 | - | 79.7 | | Apr-Jun | 68.7 | - | 76.0 | | Jul-Sep | 66.9 | - | 74.4 | | Oct-Dec | 66.5 | - | 73.3 | | 2023 | Jan-Mar | 63.5 | - | 70.8 | | Apr-Jun | 60.1 | - | 67.8 | | Jul-Sep | 57.5 | - | 65.5 | | Oct-Dec | 56.4 | - | 64.5 | | 2024 | Jan-Mar | 51.9 | - | 59.9 | | Financial Years | | 2021-22 | 75.1 | - | 81.4 | | 2022-23 | 66.4 | - | 73.6 | | 2023-24 | 56.4 | - | 64.3 | Note: Data are in per cent.
Source: Author’s estimates. | References Amromin, G., & Chakravorti, S. (2007). Debit Card and Cash Usage. A Cross-Country Analysis, Federal Reserve Bank of Chicago, Working Papers, No. 4. Amromin, G., & Chakravorti, S. (2009). Whither Loose Change? The Diminishing Demand for Small- Denomination Currency, Journal of Money, Credit and Banking, Vol 41(2/3), 315-335. Awasthy, S., Misra, R., & Dhal, S. (2022). Cash versus Digital Payment Transactions in India: Decoding the Currency Demand Paradox, Reserve Bank of India Occasional Papers, Vol. 43(2), 1-45. Benchmarking Currency (2023a). Central Banks Report – Executive Summary, Benchmarking Currency 2023, November, Central Banking, www.centralbanking.com. Benchmarking Currency (2023b). Central Banks Report Continued Fall in Cash Usage, Benchmarking Currency 2023, Central Banking, November, www.centralbanking.com. BoE (2021). Update on the future of Wholesale Cash Distribution in the UK. December, Bank of England. https://www.bankofengland.co.uk/paper/2021/update-on-the-future-of-wholesale-cash-distributionin-the-uk. Caddy, J., Delaney, L., & Fisher, C. (2020). Consumer Payment Behaviour in Australia: Evidence from the 2019 Consumer Payments Survey, RBA Research Discussion Paper No. 2020-06. Central Banking (2023). Chile’s Cash Use Has Rebounded Since Pandemic, Survey Finds. Central Banking, https://www.centralbanking.com. Cubides, E., & O’Brien, S. (2023). 2023 Findings from the Diary of Consumer Payment Choice. The Federal Reserve Financial Services. https://www.frbsf.org/cash/wp-content/uploads/sites/7/2023-Findings-from-the-Diary-of-Consumer-Payment-Choice.pdf. ECB (2022). Study on the Payment Attitudes of Consumers in the Euro Area (SPACE). December, European Central Bank. https://www.ecb.europa.eu/stats/ecb_surveys/space/html/ecb.spacereport202212~783ffdf46e.en.html. GoI (2024). Statement 12, Annual Estimates of GDP at Current Prices, 2011-12 Series. https://www.mospi.gov.in/publication/national-accounts-statistics-2024. Henry, C., Shimoda, M., & Zhu, J. (2023). 2021 Methods-of-Payment Survey Report. February, Bank of Canada. https://www.bankofcanada.ca/wp-content/uploads/2022/12/sdp2022-23.pdf. Khiaonarong, T., & Humphrey, D. (2019). Cash Use Across Countries and the Demand for Central Bank Digital Currency. IMF Working Paper, No. 19/46, www.imf.org. Khiaonarong, T., & Humphrey, D. (2023). Measurement and Use of Cash by Half the World’s Population. IMF Working Paper, No. 23/62, www.imf.org. Nachane, D. M., Chakraborty, A. B., Mitra, A. K., & Bordoloi, S. (2013). Modelling Currency Demand in India: An Empirical Study”, DRG Study No. 39, RBI. Raj, J., Bhattacharyya, I., Behera, S. R., John, J., & Talwar, B. A. (2020). Modelling and Forecasting Currency Demand in India: A Heterodox Approach, Reserve Bank of India Occasional Papers, Vol. 41(1), 1-45. RBI (2017). Currency Management. Annual Report, Chapter VIII. www.rbi.org.in. RBI (2021). Economic Review. Annual Report, Chapter II. www.rbi.org.in. RBI (2023). ₹2000 Denomination Banknotes – Withdrawal from Circulation; Will continue as Legal Tender. Press Release, May, www.rbi.org.in. RBI (2024). Currency Management. Annual Report, Chapter VIII. www.rbi.org.in. RBNZ (2021). Cash and Payments Data Update: COVID-19 Special. June, Reserve Bank of New Zealand. https://www.rbnz.govt.nz SR (2020). Payments in Sweden. Sveriges Riksbank. https://www.riksbank.se/globalassets/media/rapporter/betalningsrapport/2020/engelska/payments-in-sweden-2020.pdf. Worldline (2021). India Digital Payments Report, Q3 2021. https://worldline.com › dam › india › documents.
Annex A Components of RDP and their usability as non-cash payments to estimate payments to merchants I. Components of RDP (i) Unified Payments Interface (UPI) @ (ii) BHIM Aadhaar Pay (iii) Aadhaar Enabled Payment System (AePS) @ (iv) National Electronic Toll Collection (NETC) (v) Credit Cards (vi) PoS based $ (vii) Others $ (viii) Debit Cards (ix) PoS based $ (x) Others $ (xi) Prepaid Payment Instruments (xii) Wallets (xiii) Cards (PoS based) $ (xiv) Others $ (xv) National Electronic Funds Transfer (NEFT) (xvi) Immediate Payment Service (IMPS) (xvii) National Automated Clearing House (NACH) (xviii) Aadhaar Payment Bridge System (APBS) $ @: New inclusion w.e.f. November 2019; $: Inclusion separately initiated from November 2019 - would have been part of other items hitherto. Source: PSI in DBIE in www.rbi.org.in. II. Usability of RDP components as non-cash payments to estimate payments to merchants (i) Usage of UPI UPI is used for payments to merchants as well as for fund transfer. NPCI started publishing data on payments done through UPI, segregating them into P2M and P2P payments from April 2021 onwards. P2M payments are by a person to a merchant, identified as peer to merchant payments. P2P payments are by a person to a person, known as peer to peer payments. NPCI classifies the merchants into three broad categories viz., ‘High Transacting Categories’, ‘Medium Transacting Categories’ and ‘All Other Categories’ covering wide varieties of merchants as shown below (Table A). | Table A: Category wise Classification of Merchants | | High Transacting Categories | Groceries and supermarkets
Eating places and restaurants
Telecommunication services, including local and long distance calls, credit card calls, calls through use of magnetic stripe reading telephones and faxes
Fast food restaurants
Department stores
Service stations (with or without ancillary services)
Digital Goods: Games
Bakeries
Drug stores and pharmacies
Debit card to wallet credit (Wallet top up) | | Medium Transacting Categories | Dairies
Utilities electric, gas, water and sanitary
Drinking places (alcoholic beverages) bars, taverns, night-clubs, cocktail lounges and discothques
Miscellaneous personal services not elsewhere classified
Debt collection agencies
Variety stores
Financial institutions merchandise and services
Freezer and locker meat provisioners
Miscellaneous general merchandise
Men’s, women’s and children’s uniforms and commercial clothing | | All Other Categories | Electronics shops
Candy, nut and confectionery shops
Securities brokers and dealers
Beauty and barber shops
Online Marketplaces
Government services not elsewhere classified
Cable and other pay television services
Stationery, office and school supply shops
Taxi-cabs and limousines
Others | | Source: NPCI (https://www.npci.org.in/what-we-do/upi/upi-ecosystem-statistics). | (ii) Usage of BHIM Aadhaar pay, AePS and NETC BHIM Aadhaar pay enables merchants to receive digital payments from customers over the counter through Aadhaar authentication. AePS also offers BHIM Aadhaar pay. NETC enables customers to use their FASTag as payment modes at any of the toll plazas. (iii) Usage of Cards (debit, credit and PPI) Cards are used for payments to merchants as well as for funds transfer. Cards and PPIs can also be used for cash withdrawal. For transactions through cards, disaggregated data are available on payments and also on cash withdrawal in RBI website. Regarding data on payments through cards (credit as well debit), further disaggregation is available in terms of ‘PoS based’ and ‘Others’. For PPI, disaggregated data on payments through ‘wallet’, ‘PoS based’ and ‘Others’ are available. Further disaggregation on data under ‘Others’ are not available for payments through cards (credit/debit/PPI). (iv) Usage of funds transfer (NEFT, IMPS, NACH) and paper-based instruments National electronic funds transfer (NEFT), immediate payment service (IMPS), national automated clearing house (NACH) and paper-based instruments are also non-cash modes of payments. Disaggregated data, however, are not available in public in respect of these instruments to identify payments done for the purpose of purchase of goods and services for consumption and for other purposes. Hence, payments through these instruments are excluded to estimate non-cash payments. (v) Aadhar Based Payment System (ABPS) Pertains to the transfer of benefits and subsidies under Direct Benefit Transfer scheme launched by GoI. Hence not included to estimate non-cash payments by consumers.
Annex B | Table B: Distribution of Digital Payment for PFCE | | Components | Vol and Val | 2020-21 | 2021-22 | 2022-23 | 2023-24 | | Jan-Mar | April-June | Jul-Sept | Oct-Dec | Jan-Mar | April-June | Jul-Sept | Oct-Dec | Jan-Mar | April-June | Jul-Sept | Oct-Dec | Jan-Mar | | UPI_P2M | Vol | 51.6 | 57.4 | 59.8 | 58.2 | 63.8 | 67.0 | 73.7 | 77.5 | 80.0 | 82.0 | 84.3 | 85.2 | 87.0 | | Val | 33.2 | 40.9 | 42.4 | 44.4 | 48.7 | 50.3 | 54.1 | 57.5 | 59.6 | 61.3 | 64.1 | 65.1 | 68.8 | | BHIM Aadhaar | Vol | 0.1 | 0.1 | 0.1 | 0.1 | 0.1 | 0.1 | 0.0 | 0.0 | 0.0 | 0.0 | 0.0 | 0.0 | 0.0 | | Pay | Val | 0.1 | 0.2 | 0.2 | 0.2 | 0.2 | 0.2 | 0.1 | 0.1 | 0.1 | 0.1 | 0.1 | 0.1 | 0.1 | | NETC | Vol | 0.4 | 0.4 | 0.4 | 0.4 | 0.4 | 0.4 | 0.3 | 0.3 | 0.3 | 0.2 | 0.2 | 0.2 | 0.2 | | Val | 0.1 | 0.1 | 0.1 | 0.0 | 0.1 | 0.1 | 0.1 | 0.1 | 0.1 | 0.0 | 0.0 | 0.0 | 0.0 | | Credit Card PoS based | Vol | 4.5 | 3.2 | 3.6 | 3.7 | 3.3 | 3.3 | 2.9 | 2.6 | 2.4 | 2.2 | 2.0 | 2.0 | 1.9 | | Val | 13.5 | 10.5 | 11.2 | 10.9 | 9.9 | 10.2 | 9.8 | 9.8 | 9.5 | 9.1 | 8.3 | 8.4 | 8.0 | | Credit Card | Vol | 3.9 | 4.0 | 3.4 | 3.5 | 3.2 | 3.0 | 2.5 | 2.2 | 2.1 | 2.0 | 1.9 | 1.9 | 1.8 | | Others | Val | 16.0 | 16.0 | 16.2 | 16.6 | 16.9 | 17.1 | 16.3 | 15.5 | 15.8 | 15.7 | 15.4 | 15.7 | 14.1 | | Debit Card PoS based | Vol | 10.1 | 7.1 | 7.7 | 7.6 | 6.3 | 5.7 | 4.5 | 3.7 | 3.0 | 2.5 | 2.0 | 1.7 | 1.3 | | Val | 17.9 | 13.2 | 13.7 | 13.0 | 10.9 | 10.6 | 9.0 | 8.4 | 7.0 | 6.5 | 5.4 | 4.8 | 4.0 | | Debit Cards | Vol | 7.2 | 6.9 | 5.6 | 4.7 | 3.8 | 3.1 | 2.3 | 1.7 | 1.3 | 1.0 | 0.8 | 0.6 | 0.5 | | Others | Val | 10.5 | 9.7 | 8.5 | 7.4 | 6.4 | 5.3 | 5.1 | 4.0 | 3.5 | 3.1 | 3.0 | 2.3 | 2.0 | | PPI Wallets | Vol | 18.0 | 17.6 | 15.8 | 17.6 | 15.0 | 13.8 | 10.8 | 9.4 | 8.9 | 8.4 | 7.0 | 6.9 | 5.8 | | Val | 6.1 | 6.8 | 6.4 | 6.2 | 5.5 | 4.8 | 4.1 | 3.7 | 3.6 | 3.6 | 3.2 | 3.0 | 2.5 | | PPI PoS based | Vol | 0.2 | 0.2 | 0.4 | 0.3 | 0.4 | 0.3 | 0.2 | 0.1 | 0.1 | 1.1 | 1.0 | 0.9 | 0.8 | | Val | 0.7 | 0.6 | 0.4 | 0.4 | 0.8 | 0.5 | 0.3 | 0.2 | 0.2 | 0.2 | 0.1 | 0.1 | 0.1 | | PPI Others | Vol | 4.1 | 3.2 | 3.3 | 4.1 | 3.7 | 3.3 | 2.8 | 2.4 | 2.0 | 0.8 | 0.8 | 0.7 | 0.7 | | Val | 2.0 | 2.1 | 1.2 | 0.8 | 0.7 | 1.0 | 1.1 | 0.9 | 0.7 | 0.5 | 0.5 | 0.5 | 0.5 | | HH digital | Vol | 100 | 100 | 100 | 100 | 100 | 100 | 100 | 100 | 100 | 100 | 100 | 100 | 100 | | payments | Val | 100 | 100 | 100 | 100 | 100 | 100 | 100 | 100 | 100 | 100 | 100 | 100 | 100 | Notes: 1. Data are in per cent.
2. Disaggregated data on UPI in terms of P2P and P2M payments are available only from April 2021 onwards in NPCI. The same for the quarter ending March 2021 were estimated as follows. In Worldline (2021), data on the share (not data on amount) of P2P and P2M payments in UPI are available. In the RBI site, aggregate data on UPI are available. Based on these, disaggregated data on P2P and P2M payments were estimated for the quarter ending March 2021. The author could not find any other source publishing data on P2P and P2M payments for period earlier to the quarter end March 2021.
3. ‘Vol’ and ‘Val’ represent volume and value respectively.
Source: Author’s calculations based on data from RBI, NPCI and Worldline (2021). |
|