The economic outlook for 2025 is divergent across countries with some loss of speed in the US; weak to modest recoveries in Europe and Japan; more moderate growth profiles in emerging and developing countries alongside a more gradual disinflation relative to advanced economies. In India, there is a conducive quickening of high frequency indicators of economic activity in the second half of 2024-25, bearing out the implicit pick up in real GDP growth for this period in the annual first advance estimates of the NSO. Headline inflation eased for the second successive month in December, although the stickiness in food inflation warrants careful monitoring of second order effects. Introduction The world turns a page and looks to the promises that 2025 holds, but perhaps through the humbling lens of the experiences of an eventful 2024. It is the season of forecasting again, and the United Nations (UN) has been first off the block with a ‘stable but subdued’ outlook for global growth – broadly in line with the outcome for 2023 and the most recent estimates for 2024 (please see Section II). Disinflation can be expected to continue unevenly, opening up some more albeit limited space for monetary policy easing. This would bring welcome relief for households and individuals whose finances and spending power has been severely stretched as they reel under credit card defaults, and also for lenders who are facing the highest levels of write-offs in 14 years. Together with technological advancements, these developments could lift incomes and boost aggregate demand. The battle against inflation is, however, entering a new phase with fresh upside threats on the horizon – the weaponisation of uncertainty - and the future path of interest rates is becoming hazy. On the other hand, lack of fiscal space and the enormous debt overhang could clearly keep borrowing costs high as developments in the first half of January 2025 revealed. This could dent investment in new capacities even as supply conditions remain hostage to geopolitical disruptions that seem to be unending (a separate article in this volume of the Bulletin examines geopolitical risks and spillovers). Slowing productivity growth, ageing pressures and grappling with green transition continue to tilt down the balance of risks over the medium-term for the global economy. A stark carryover from 2024 is going to be the increasing divergence across countries – some loss of speed in the US; weak to modest recoveries in Europe and Japan; more moderate growth profiles in emerging and developing countries alongside a more gradual disinflation relative to advanced economies. Another contending carryover will be the degree of disruption in the global financial architecture. Labour market conditions remain resilient, but youth unemployment poses a challenge, especially among developing countries. On the climate front, record sea temperatures are scrambling weather patterns globally. Besides the naturally occurring El Nino and La Nina in the Pacific Ocean, the warming of tropical oceans around the world needs to be taken into consideration in climate modelling and forecasting. Weather patterns in 2025 are expected to be out of sync with the anticipated La Nina that should set in during the early months of the year. Hence, sea surface temperatures could decline below the La Nina threshold, given neutral El Nino Southern Oscillation (ENSO) and Indian Ocean Dipole (IOD) conditions. All in all, the global economy is shaping up to be anything but ordinary in 2025.1 Global trade is expected to improve, with volume expansion somewhat higher in 2025 than in the year gone by, although the persistence of geopolitical risks and the looming threats of a more protectionist environment overcast these expectations with high uncertainty. The prospects for financial flows are risk-laden, with the outlook for foreign direct investment (FDI) still subdued and with portfolio flows displaying ‘home bias’ and high volatility. In some developing countries, domestic drivers are keeping fixed capital formation from sagging under the weight of the global retrenchment of portfolio flows. The response to the better than anticipated signs of strength in the US labour market in December that was released on January 10 may have brought relief to households and businesses, but it has rattled financial markets worldwide with persisting effects – bond markets across the US, Europe and Asia were hit by volatility, with the biggest sell-off in the UK. The possibility of the shutting out or slowing of further monetary policy easing sent bond yields to 12-month highs, serving as a reminder that borrowing costs will punish the most highly indebted governments. Stocks traded lower after outperforming through 2024. Ahead of the US non-farm payrolls global spillovers, the US dollar had halted briefly on the path of its unrelenting rise that has been undermining currencies across the world. The trigger was the possibility of a watering down of sweeping tariffs threatened on the campaign trail. Following the jobs data, however, the US dollar pared losses and regained strength on its march to a technical resistance level of 110 for the DXY. As it rallies to go beyond, more pain lies in store for other currencies. The Chinese yuan has tumbled to a 14-month low, providing the other end of the tightrope that emerging market currencies have to teeter on. The euro’s losses are being accelerated by technical factors, and US dollar-euro parity is looking more plausible than ever before. Perhaps, the only place that can dethrone the US dollar is the US itself from self-inflicted wounds. Global corporate debt sales have soared to a record US $8 trillion on demand from investors to take advantage of the compression in spreads. A steady stream of issuances is expected through 2025, with analysts looking at significant, large scale mergers and acquisitions financed by debt. In another development, the phenomenon of private markets dominating financial activity is drawing worldwide attention.2 Estimated as growing by close to 20 per cent from a size of US$ 13 trillion in mid-2023, these markets are seen as offering better exposure to innovation. Yet, private markets depend substantially on the ability to free-ride on the transparency of information and prices in public markets. The opacity of private markets, illiquid nature of loans and potential maturity mismatches could also lead to a misallocation of resources – in fact, much of the impetus to these markets stems from stricter regulatory requirements on capital and liquidity for banks. Hence, it is believed that private funds pose a potential systemic risk to the broader financial system because of their interrelationship with the regulated segments. The International Monetary Fund (IMF) has argued that there could be inherent deterioration in pricing and non-pricing standards, erosion in underwriting standards and weakened covenants – the recipe for the next financial crisis.3 This is echoed by the Organization for Economic Co-operation and Development (OECD) which fears that in the event of a severe shock, a rapid loss of confidence could trigger margin calls on derivatives used by private credit funds, adding further to liquidity pressures from redemptions, carrying risks that distressed funds default with losses for end-investors. Many liquidity management tools by private credit funds have yet to be fully tested in severe scenarios. Close monitoring is hence needed, given significant data gaps about the sector and its often limited prudential or conduct oversight. Greater transparency in regulatory reporting would close data opacities and enable better assessment of and management of risks by end-investors.4 The first advance estimates for 2024-25 released by the National Statistics Office (NSO) on January 7 confirmed that India continues to be the fastest growing major economy, although gross domestic product (GDP) growth has moderated to 6.4 per cent from three consecutive years of above 7 per cent growth. This slowdown reflects the effect of a host of unfavourable factors in H1:2024-25, such as the impact of localised excess rainfall on non-farm activity. Private capex is yet to show visible signs of pick-up and with growth in general government capital expenditure moderating too, gross fixed investment in GDP and manufacturing in gross value added (GVA) emerged as the biggest drags on growth. With agriculture and allied activities turning in a reasonable performance on the back of a record kharif harvest, and with higher rabi sowing, the fortunes of the rural economy have improved. Headline inflation eased for the second successive month in December, driven by winter easing of prices when the earth offers up a rich bounty of fruits and vegetables. Despite the sequential easing, the level of food inflation continues to remain high, with select key products experiencing high double digits inflation.5 The stickiness in high food inflation, in an environment of firming rural wages and corporate salary outgoes, warrants careful monitoring of second order effects. The time is apposite to rekindle the animal spirits, create mass consumer demand and trigger a boom in investment. There is a conducive quickening of high frequency indicators of economic activity in the second half of 2024-25, bearing out the implicit pick up in real GDP growth for this period in the annual first advance estimates of the NSO. There are early indications that corporate India may post a much better revenue and earnings growth in the third quarter vis-à-vis that in the first half of 2024-25. According to estimates by various brokerages, the combined net profit of Nifty 50 companies may grow at its fastest rate in three quarters. Banking, finance and insurance companies are again expected to report better earnings. It is also believed that unlisted companies are likely to outpace their listed counterparts with faster revenue growth. Private final consumption is the brightening spot in the economy, driven by e-commerce and q-commerce among which it is important to foster competition rather than being restrictive. One way to revive the animal spirts may be to provide a consumption boost. The demand for household staples has seen a modest rise in the October-December quarter. The middle class is pinning hopes on relief from food inflation and hence higher disposable incomes, especially the urban segment. The rural segment is likely to continue to record strong volume growth. In the housing space, the mid-income segment and premiumisation are fuelling demand and leading to overall improvement in market health metrics – another growth gear. An area where animal spirits in India are alive and well is green energy. India’s ambitious green bond programme reflects a commitment to mobilise green capital in a larger vision of positioning India as a global climate leader. The renewable energy sector will cross milestones in 2025. Solar power capacity will go past the 100 gigawatt (GW) mark. Wind power capacity will exceed 50 GW. India’s nuclear power generation is growing twice as fast as the rest of the world on the trajectory of tripling capacity by 2031-32 from the current level of 8180 MW. Till December 2024, the total renewable energy capacity in India – wind; solar; hybrid; biomass; small hydro; and nuclear – stood at 209.4 GW. The ethanol blending target of 20 per cent blending 10.16 bn/ltr for 2025-26 is within reach, having averaged 14.6 per cent so far. With all these positives, India can look forward to accelerating growth in an environment of price stability in a greener, cleaner 2025, putting behind us 2024, the warmest year in India since record keeping began. It is in our hands. The time to act is now. Set against this backdrop, the remainder of the article is structured into four sections. Section II covers the rapidly evolving developments in the global economy. An assessment of domestic macroeconomic conditions is set out in Section III. Section IV encapsulates financial conditions in India, while the last Section sets out concluding remarks. II. Global Setting At the close of 2024 and going into 2025 the global economy is being driven by a strong US economy, offsetting the weak Euro area and China. The easing of global inflation is turning out to be uneven; along with trade policy uncertainty and geopolitical risks. Considerable uncertainty is being imparted to the global economic outlook. Our model-based nowcast of global GDP indicates an acceleration in global growth momentum in Q4:2024 in spite of formidable headwinds (Chart II.1). Global supply chain pressures recorded an uptick in December, inching towards historical average levels (Chart II.2a). Our geopolitical risk indicator recorded a 29-month high in December, driven by escalating tensions in the Middle East (Chart II.2b). Shipping costs, which had moderated during August - October 2024, have started rising again since November 2024, albeit a slight decline in mid-December 2024 (Chart II.2c). Consumer sentiments improved in the US and the UK, but worsened in Japan, the Euro area and in EMEs in December 2024 (Chart II.3a and II.3b). Financial conditions generally eased in AEs but among EMEs, they tightened in China and Brazil (Chart II.3c and II.3d). The global composite purchasing managers’ index (PMI) rose to a four-month high in December. An acceleration in services sector activity particularly in financial, business and consumer services offset the weakness in manufacturing on account of the fall in production of intermediate and investment goods (Chart II.4a). Across regions, solid expansions in India and the US contrasted with the contraction in the Euro area (Chart II.4b). The composite PMI for export orders declined further in December 2024. It has remained in contractionary territory since June 2024, with both manufacturing and services export orders recording a sequential decline (Chart II.5).  Global commodity prices softened in December amidst volatile conditions (Chart II.6a). Food prices measured by the Food and Agriculture Organization’s (FAO) food price index declined by 0.5 per cent in December, primarily driven by decline in the prices of sugar (5.1 per cent), dairy products, vegetable oil, and cereals (Chart II.6b). Crude oil prices fell by 0.8 per cent (m-o-m) in December, reflecting weak Chinese demand and rising global supplies offsetting OPEC plus efforts to shore up the market (Chart II.6c). Oil prices increased by 6.1 per cent in January so far (up to 14th), reaching a four-month high following announcement of fresh US sanctions on Russian oil and expectations of stronger economic stimulus by China and higher demand from Europe and the US due to colder weather gained momentum. Metal prices softened in December, driven by sluggish industrial activity in China, the world’s largest consumer of base metals although the trend reversed in January, driven by China’s latest efforts to stimulate growth. Gold prices increased in early December, but declined thereafter as rising treasury yields and a strengthening US dollar increased the opportunity cost of gold holdings. In January so far, gold prices have rebounded, supported by a safe-haven and inflation hedge demand (Chart II.6d).  Headline inflation declined over much of 2024 to reach close to targets in most major economies. The pace of its decline has slowed down in recent months, along with uptick in the US to 2.9 per cent (y-o-y) in December from 2.7 per cent in November. Inflation in terms of the personal consumption expenditure (PCE) deflator also increased to 2.4 per cent in November from 2.3 per cent in October. In the Euro area, headline inflation edged up to 2.4 per cent in December6 from 2.2 per cent in November whereas, in the UK, it moderated to 2.5 per cent in December from 2.6 per cent in November. Inflation in Japan increased to 2.7 per cent in November from 2.3 per cent in October (Chart II.7a). Among EMEs, CPI inflation in China weakened further to 0.1 per cent in December, its lowest level since March, and in Brazil, it moderated to 4.8 per cent. Inflation, however, increased in Russia in December and South Africa in November (Chart II.7b). Core inflation moderated in the US and UK in December but remained steady in the Euro area (Chart II.7c). While services inflation slowed down in the US and UK in December, it recorded a marginal acceleration in the Euro area (Chart II.7d).  The Morgan Stanley Capital International (MSCI) world equity index fell by 2.5 per cent (m-o-m) in December, mostly on account of declines in equity markets across AEs, particularly the US (Chart II.8a). The decline was primarily driven by the outcome of US Fed’s December FOMC meeting, in which a slower than earlier indicated policy rate easing was signalled. The MSCI Emerging Markets Index also retracted by 0.3 per cent in December as fears of potential trade tensions weighed on investor sentiment. In January, the MSCI World Index declined by 0.8 per cent (up to January 14), primarily driven by decline in the US stock market. Yields on US government securities hardened in December, with the 10-year and 2-year bond yields rising by 40 bps and 9 bps, respectively (Chart II.8b). The increase was driven by the uptick in inflation, as well as strong labour markets in the US. Yields continued to rise in January, supported by incoming data indicating resilience in the US economy.  The US dollar strengthened by 2.6 per cent (m-o-m) in December as a stronger than expected US economy and higher than earlier anticipated policy rates by the end of 2025 boosted demand. In January (up to 14th), it strengthened further by 0.7 per cent. Concomitantly, the MSCI currency index for EMEs declined by around 1.2 per cent in December, mainly due to capital outflows in the equity segment (Chart II.8c and II.8d). Among AE central banks, Sweden cut its policy rate in December by 25 bps whereas Israel, the Czech Republic, South Korea and Norway kept their policy rates unchanged (Chart II.9a). Among EME central banks, Peru and Indonesia lowered their policy rates by 25 bps each in January 2025 and Colombia, Mexico and Philippines lowered their benchmark rates by the same magnitude in December 2024 (Chart II.9b). III. Domestic Developments Recent movements in high-frequency indicators point towards a recovery in H2:2024-25 from the slowdown in H1. Supply chain pressures remained below historical average levels, inspite of a marginal uptick in December (Chart III.1a). Based on the economic activity index (EAI)7, seasonally adjusted GDP growth nowcast for Q3:2024-25 is placed at 6.2 per cent (Chart III.1b and 1c). Aggregate Demand The first advance estimates (FAE) of national income released on January 7, 2025 placed real GDP growth for 2024-25 at 6.4 per cent as compared with 8.2 per cent a year ago. While private and government consumption expenditure hiked up, and net exports contributed positively, investment growth moderated (Chart III.2). In fact, gross fixed capital formation (GFCF) slowed to 6.4 per cent in 2024-25 from 9.0 per cent growth in 2023-24. A decisive factor in this investment slowdown was lower capital expenditure by both the Union8 and State Governments. On the external front, India’s exports grew by 5.9 per cent in 2024-25 primarily on account of a steady growth in services exports. Imports contracted by 1.3 per cent, and enabled net exports to contribute positively to GDP growth by 1.7 percentage points.  High frequency indicators suggest that aggregate demand firmed up in Q3:2024-25. E-way bills rose on a y-o-y basis in volume terms in December (Chart III.3a), and toll collections recorded strong growth both in volume and value terms (Chart III.3b). While overall automobile sales declined in December 2024, passenger vehicle sales recorded sound growth (Chart III.4a). Domestic tractor sales showed robust growth in December. Among two-wheelers, scooter sales expanded by 3.2 per cent while motorcycle sales contracted (Chart III.4b). Vehicle registrations recorded a contraction in December owing to declines in non-transport and transport vehicles segments (Chart III.4c). Petroleum consumption expanded by 2.1 per cent (y-o-y) in December, as petrol, aviation turbine fuel (ATF) and diesel recorded strong growth of 10.8 per cent, 8.7 per cent and 6.0 per cent, respectively9 (Chart III.4d). India’s investments in renewable energy is rising faster than other countries (Chart III.5). According to the International Energy Agency (IEA), India’s annual renewable capacity additions are expected to quadruple from 15 GW in 2023 to 62 GW in 2030. 
 In November 2024, several policy decisions have been undertaken at COP29 held in Baku, Azerbaijan to help countries deliver their climate plans more quickly and cheaply so that faster progress in reducing global emissions takes place in this decade. It was also agreed to secure efforts to scale up finance to developing countries to US$1.3 trillion annually from both public and private sources by 2035. India submitted its 4th Biennial Update Report (BUR-4) to the United Nations Framework Convention on Climate Change on 30th December 2024, emphasising initiatives such as the development of a trading mechanism for carbon credits, increased renewable energy capacity, expansion of forest and tree cover and the consequent creation of natural carbon sinks. Progress so being made towards the Nationally Determined Contributions (NDCs) target of reducing emission intensity of GDP by 45 per cent by 2030 from 2005 levels. Employment in the organised manufacturing sector expanded to a four-month high in December. The rate of job creation in the services sector witnessed a marginal moderation from a record high registered in November10 (Chart III.6). The demand for work under the Mahatma Gandhi National Rural Employment Guarantee Act (MGNREGA) rose in December 2024, in line with the trend observed in previous years, as a significant part of rabi sowing was completed (Chart III.7). The demand for work, however, is expected to fall with the start of rabi harvesting season. India’s merchandise exports at US$ 38.0 billion contracted by 1.0 per cent (y-o-y) in December 2024 (Chart III.8). Exports of 6 out of 30 major commodities (accounting for 35.1 per cent of export basket) contracted on y-o-y basis in December. Petroleum products, gems and jewellery, iron ore, chemicals, and oil meals contributed negatively to export growth in the month, while electronic goods, engineering goods, rice, ready-made garments (RMG) of all textiles, and cotton yarn/fabrics contributed positively (Chart III.9). During April-December 2024, India’s merchandise exports expanded by 1.6 per cent to US$ 321.7 billion, primarily led by engineering goods, electronic goods, rice, drugs and pharmaceuticals, and RMG of all textiles, while petroleum products, gems and jewellery, iron ore, ceramic products and glassware, and other cereals dragged exports down. Exports to 9 out of 20 major destinations contracted in December. During April-December 2024, however, exports to 14 out of 20 major destinations expanded, with the US, the UAE and the Netherlands being the top three export destinations. Merchandise imports at US$ 59.9 billion increased by 4.9 per cent (y-o-y) in December (Chart III.10). Out of 30 major commodities, 20 commodities (accounting for 69.9 per cent of import basket) registered an expansion on a y-o-y basis. Gold, electronic goods, machinery, metalliferous ores and other minerals, and POL contributed positively to import growth, while coal, coke and briquettes, pearl, precious and semi-precious stones, iron and steel, artificial resins and plastic materials, and transport equipment contributed negatively (Chart III.11). During April-December 2024, India’s merchandise imports at US$ 532.5 billion increased by 5.2 per cent (y-o-y), mainly led by POL, electronic goods, gold, machinery, and non-ferrous metals, while coal, coke and briquettes, pearls, precious and semi-precious stones, chemical material and products, iron and steel, and fertilisers contributed negatively. Imports from 14 out of 20 major source countries expanded in December, while imports from 13 major countries expanded during April-December 2024. The merchandise trade deficit widened to US$ 21.9 billion in December 2024 from US$ 18.8 billion in December 2023. Both oil and non-oil deficit widened in December 2024 from the levels recorded a year ago (Chart III.12). With a larger increase in oil deficit, the share of oil in overall trade deficit increased to 47.2 per cent in December 2024 from 42.9 per cent a year ago. During April-December 2024, India’s merchandise trade deficit widened to US$ 210.8 billion from US$ 189.7 billion a year ago. Petroleum products were the largest source of the deficit, followed by electronic goods (Chart III.13). During November 2024, services exports grew by 13.9 per cent (y-o-y) to US$ 32.0 billion while services imports expanded by 26.0 per cent (y-o-y) to US$ 17.2 billion (Chart III.14). As a result, net services export earnings increased by 2.5 per cent (y-o-y) to US$ 14.8 billion during the month. According to the Controller General of Accounts (CGA), the gross fiscal deficit (GFD) and revenue deficit [as per cent of the budget estimates (BE)] of the Central government were higher than during the corresponding period of the previous year but the gross primary deficit remained lower (Chart III.15a and b).  Revenue expenditure (RE) recorded a y-o-y growth of 7.8 per cent in April-November 2024 in comparison to 3.6 per cent during the corresponding period of the previous year. Interest payments (IP) registered a growth of 8.3 per cent vis-à-vis 11.5 per cent in the corresponding period of the previous year. Driven by food and petroleum subsidies, the expenditure outgo on major subsidies (MS) also recorded a growth of 15.0 per cent, in comparison to a contraction of 19.4 per cent during the corresponding period of the previous year. Capital expenditure, on the other hand, moderated during April-November 2024 (Chart III.16a). For the month of November, however, capital expenditure recorded a growth of 21.3 per cent y-o-y (Chart III.16b). Overall, the growth in total expenditure stood at 3.3 per cent during April-November 2024. Gross tax revenues of the Central Government grew by 10.7 per cent (y-o-y) in April-November 2024, primarily driven by robust growth in income tax (23.5 per cent), goods and services tax (GST) [9.8 per cent], and custom duties (8.7 per cent) [Chart III.17a]. Corporation tax, however, recorded a marginal decline of 0.5 per cent due to the subdued corporate earnings. Non-tax revenue attained 78.3 per cent of BE, attributable to the surplus transfer of ₹2.11 lakh crore from the Reserve Bank (Chart III.17b). On the other hand, non-debt capital receipts contracted by 5.9 per cent due to decline in recovery of loans (9.8 per cent) while disinvestment receipts recorded a marginal increase of 1.4 per cent. Attributable to higher assignments to States by the Centre11, net tax revenue recorded a marginal increase of 0.5 per cent during April-November 2024. Overall, the total receipts expanded by 8.5 per cent over the corresponding period of the previous year.  GST collections (Centre plus States) climbed to ₹1.77 lakh crore in December 2024, taking the cumulative GST collection for April-December 2024 to ₹16.34 lakh crore (registering a growth of 9.1 per cent over April-December 2023) [Chart III.18]. As per provisional accounts, States’ GFD stood at 47.4 per cent of the BE during April-November 2024, lower than last year’s level (Table III.1). States’ revenue receipts increased by 13.3 per cent, primarily driven by higher tax revenues, even as non-tax revenue and grants contracted (Chart III.19a). The growth in tax revenue can be attributed to higher devolution from the Centre, growth in States’ GST and excise collections, and a turnaround in sales tax/value added tax (VAT). On the expenditure side, growth in revenue expenditure picked up during April-November 2024, while capital expenditure remained lower than last year’s level (Chart III.19b).
| Table III.1: States’ Fiscal Indicators (April-November) | | (per cent of BE) | | Deficit Indicators | 2022-23 | 2023-24 | 2024-25 | | Revenue deficit | 21.5 | 125.9 | 71.8 | | Gross fiscal deficit | 37.4 | 55.5 | 47.4 | | Primary deficit | 19.1 | 56.3 | 37.3 | Note: Data pertains to 23 States. BE: Budget Estimates.
Source: Comptroller and Auditor General of India. | Aggregate Supply Aggregate supply, measured by real GVA at basic prices, grew by 6.4 per cent in 2024-25, lower than 7.2 per cent in the preceding year. While agriculture and services remained resilient, industrial sector disappointed (Chart III.20). The growth in agriculture, forestry and fishing increased to 3.8 per cent in 2024-25 from 1.4 per cent a year ago, owing to a higher kharif foodgrains production and rabi sowing. Industrial GVA growth subsided to 5.2 per cent, with manufacturing slackening to 5.3 per cent in 2024-25. Increases in input cost pressures and weakening of sales growth weighed on profitability. Growth in mining and quarrying activity decelerated to 2.9 per cent growth due to a contraction in production of crude oil along with a moderation in coal and natural gas production. Growth in electricity, gas water supply and other utility services moderated to 6.8 per cent growth in 2024-25 as the demand was dampened by heavy rainfall and relatively warmer winter along with slowdown in industrial activity. Services sector growth remained resilient at 7.4 per cent in 2024-25. Construction GVA growth remained upbeat at 8.6 per cent but with a moderation over the high base of last year. Reflecting the slowdown in domestic cargo traffic and commercial vehicle sales, trade, hotels, transport, and communication services growth moderated to 5.8 per cent from 6.4 per cent in the preceding year. Financial, real estate and professional services softened to 7.3 per cent in 2024-25. Public administration, defence and other services (PADO) remained buoyant, aided by expenditure by the Union and the State Governments as well as resilience in other services activity, such as education and health. 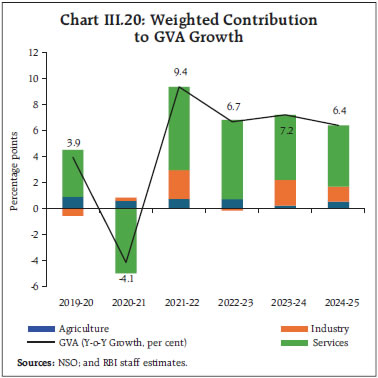 The Northeast monsoon (NEM) season (October 01-December 31, 2024) ended with a total rainfall 3 per cent below the long period average (LPA) as compared with 9 per cent below LPA last year. The Southern peninsula region received above normal rainfall (16 per cent above LPA) while all other regions received rainfall lower than LPA. Also, the number of sub-divisions receiving deficient/large deficient rainfall was higher in 2024 than a year ago (Chart III.21a). As of January 09, 2025, the all-India reservoir level (based on 155 major reservoirs) was at 71 per cent of total reservoir capacity, which was higher than in the previous year (57 per cent) as well as the decadal average (59 per cent) [Chart III.21b]. The total rabi sown area was 0.1 per cent higher than the level a year ago as of January 10, 2025.12 Acreage among all major crop groups, except oilseeds, was higher than the previous year’s levels. The area sown under wheat, which accounts for around half of the full season rabi area, was 1.4 per cent higher than in the previous year, with more than 100 per cent of sowing accomplished (Chart III.21c). Measures have been taken by the government to augment wheat supply this year.13 As of January 13, 2025 the cumulative rice procurement for the kharif marketing season (KMS) 2024-25 was 1.2 per cent higher than in the corresponding period of the previous year (Chart III.22). The buffer stock of rice at 610 lakh tonnes14 stood at 8.0 times the norm as on January 1, 2025. The wheat stock stood at 184 lakh tonnes, which is marginally higher than the buffer norm. India’s manufacturing PMI experienced a sequential moderation but stayed in expansionary territory in December, supported by external demand (Chart III.23a). The services PMI continued to record robust expansion, driven by strong demand and new business growth (Chart III.23b). Business expectations for both manufacturing and services remained optimistic, as indicated by future output assessments.
Port traffic increased by 3.4 per cent in December 2024, driven by containerised cargo, other miscellaneous cargo, and petroleum, oil and lubricants (POL) [Chart III.24]. In the construction sector, steel consumption growth moderated to 3.3 per cent (y-o-y) in December. Cement production grew by 13.0 per cent in November (Chart III.25). Available high frequency indicators reflect resilient services sector activity in November/December, with most indicators showing improvement in y-o-y growth (Table III.2).
Inflation Headline inflation, as measured by y-o-y changes in the all-India consumer price index (CPI)15, eased to a four-month low of 5.2 per cent in December 2024 from 5.5 per cent in November 2024 (Chart III.26). The 30 basis points (bps) decline in inflation was driven by a negative momentum of around 60 bps, which was partially offset by an adverse base effect of around 30 bps. The CPI food recorded a negative momentum of around 120 basis points during the month while the CPI fuel group recorded a positive momentum of 60 bps. The CPI core (excluding food and fuel) index remained unchanged in December. Food inflation decelerated to 7.7 per cent in December from 8.2 per cent in November. In terms of sub-groups, a moderation in inflation was observed in respect of cereals, milk, vegetables, pulses and sugar, whereas inflation in respect of meat and fish, eggs, oils and fats, fruits, prepared meals, and non-alcoholic beverages picked up. Deflation in prices of spices persisted (Chart III.27). Fuel and light deflation narrowed to (-)1.4 per cent in December from (-) 1.8 per cent in November on account of a lower rate of deflation in kerosene and LPG prices and a higher rate of inflation in electricity prices. Core inflation remained steady at 3.7 per cent in December 2024, the same as in November. Among the sub-groups, inflation moderated in case of housing, transport and communication, and personal care and effects sub-groups; it remained steady in respect of clothing and footwear, household goods and services, health, and education. Inflation in respect of pan, tobacco and intoxicants, and recreation and amusement, however, registered an increase in inflation (Chart III.28). In terms of regional distribution, rural inflation stood at 5.76 per cent higher than urban inflation (4.58 per cent) in December 2024. Majority of the states faced inflation less than 6 per cent (Chart III.29). High frequency food price data for January so far (up to 14th) show a moderation in rice prices, while wheat prices continued to edge up. Edible oil prices continued to witness a broad-based hardening albeit at a slower pace, than a month ago. Pulses prices, on the other hand, continued to moderate. Vegetables prices, especially of potato, onion and tomato witnessed a sharp correction (Chart III.30). Retail selling prices of petrol, diesel and LPG remained unchanged in January thus far (up to 14th) while subsidised kerosene prices decreased (Table III.3). As per the PMIs, input costs across both manufacturing and services firms increased at a slower pace in December after a sharp rise in November. Selling price pressures also moderated across manufacturing and services firms in December (Chart III.31).
| Table III.3: Petroleum Products Prices | | Item | Unit | Domestic Prices | Month-over-month (per cent) | | Jan-24 | Dec-24 | Jan-25^ | Dec-24 | Jan-25^ | | Petrol | ₹/litre | 102.92 | 101.02 | 101.02 | 0.0 | 0.0 | | Diesel | ₹/litre | 92.72 | 90.48 | 90.48 | 0.0 | 0.0 | | Kerosene (subsidised) | ₹/litre | 50.50 | 44.75 | 43.93 | 1.8 | -1.8 | | LPG (non-subsidised) | ₹/cylinder | 913.25 | 813.25 | 813.25 | 0.0 | 0.0 | Notes: 1. ^: For the period January 1-14, 2025.
2. Other than kerosene, prices represent the average Indian Oil Corporation Limited (IOCL) prices in four major metros (Delhi, Kolkata, Mumbai and Chennai). For kerosene, prices denote the average of the subsidised prices in Kolkata, Mumbai and Chennai.
Sources: IOCL; Petroleum Planning and Analysis Cell (PPAC); and RBI staff estimates. |
IV. Financial Conditions System liquidity turned into deficit since mid-December due to build-up in government cash balances driven by the usual quarter-end advance tax outflows and monthly GST payments. The culmination of the last tranche of the unconventional monetary policy measures16 announced by the Reserve Bank in 2021 to address COVID-19 related disruptions resulted in withdrawal of liquidity by about ₹2,530 crore from the banking system. To address the liquidity tightness, the Reserve Bank cumulatively injected ₹12.55 lakh crore to the banking system via two main and sixteen fine-tuning variable rate repo (VRR) operations of 1-7 days maturity during December 16, 2024 to January 16, 2025. Further, on a review of current and evolving liquidity conditions, it was also decided to conduct VRR auctions on all working days in Mumbai with reversal taking place on the next working day until further notice.17  Overall, the average daily net injection under the liquidity adjustment facility (LAF) stood at ₹1.55 lakh crore during this period in contrast to the average net absorption of ₹0.62 lakh crore recorded during November 16 to December 15, 2024 (Chart IV.1). The pick up in government spending alleviated liquidity tightness towards the end of December and early January. Despite tighter liquidity conditions, banks’ placement of funds under the standing deposit facility (SDF) averaged ₹0.83 lakh crore during December 16, 2024 to January 14, 2025, same as during the previous month. The co-existence of deficit liquidity conditions and funds deployed in the SDF is indicative of skewed distribution of liquidity in the banking system. Furthermore, banks appear to be availing liquidity from the RBI but not onlending to money markets. Banks’ daily average recourse to the MSF at ₹0.10 lakh crore during this period included a nearly three-month high access at ₹44,652 crore on a single day (January 8, 2025). The weighted average call rate (WACR) – the operating target of monetary policy – hovered close to the ceiling of the LAF corridor (MSF rate) during the second half of December and early January with occasional breaches. This is partly attributed to lower lending volumes in the call money market on account of the unwillingness of banks to onlend in uncollateralised lending at the quarter end. In early January, the WACR reverted closer to the policy repo rate as liquidity conditions eased before firming up again in the second week. Overall, the spread of the WACR over the policy repo rate averaged 20 bps during December 16 and January 14, 2025, as compared with 10 bps during November 16 – December 15, 2024 (Chart IV.2a). Across the term money market segment, rates remained elevated, with yields on 3-month treasury bills (T-bills), certificates of deposit (CDs) and 3-month commercial papers (CPs) issued by non-banking financial companies (NBFCs) averaging 6.54 per cent, 7.34 per cent and 7.67 per cent, respectively, during December 16, 2024 - January 14, 2025, up from 6.44 per cent, 7.18 per cent and 7.47 per cent, respectively, during November 16 - December 15, 2024 (Chart IV.2b). The average risk premia in the money market (3-month CP minus 91-day T-bill) remained high at 113 bps during the current period up from 103 bps during November 16 – December 15, 2024. On a y-o-y basis, however, the spread of 3-month CPs (NBFC) over the 91-day T-bill rate stood at 118 bps during January 2025 (up to January 14), lower than 147 bps a year ago. The spread of the 3-month CD rate over the 91-day T-bill rate stood at 81 bps (up to January 14) compared to 47 bps a year ago as system liquidity conditions turned into deficit after five months of surplus (Chart IV.2c). Although the spreads tend to rise during periods of deficit liquidity, they have declined for CPs. The weighted average discount rate (WADR) of CPs stood at 7.53 per cent in January 2025 (up to January 14), lower than 7.67 per cent during the corresponding period of the previous year (Chart IV.3). Also, the weighted average effective interest rate (WAEIR) of CDs softened to 7.60 per cent (up to January 14) from 7.63 per cent a year ago as the gap between credit and deposit growth narrowed. In the primary market, issuances of CDs grew by 47 per cent (y-o-y) to ₹8.22 lakh crore during April–December 2024, significantly higher than ₹5.61 lakh crore in the corresponding period of the previous year (Chart IV.4). Similarly, CP issuances stood at ₹11.35 lakh crore during 2024–25 (up to December), up from ₹9.96 lakh crore during the corresponding period of the previous year.
The yield on the 10-year G-sec benchmark increased to 6.86 per cent on January 14, 2025, from 6.77 per cent on December 13, 2024. This marginal uptick was driven by a surge in US treasury yields and increasing crude oil prices (Chart IV.5a). The yield curve shifted upward across the tenor. Between December 16, 2024, and January 14, 2025, the average term spread (10-year G-sec yield minus 91-day T-bills yield) narrowed to 27 bps (Chart IV.5b). The spread of the 10-year Indian G-sec yield over the 10-year US bond fell to 203 bps as on January 14, 2025 from 324 bps in mid-September and 317 bps a year ago. Domestic bond yields, which had reached a three-year low in early December, increased thereafter in line with hardening US bond yields. Foreign portfolio investment (FPI) flows to domestic debt instruments recorded outflows in January 2025 (as on January 14th). The volatility of yields in the Indian bond market remains low relative to US treasuries though uncertainty regarding the incoming US administration’s stance on tariffs, tax cuts and deregulation persists on global bond markets (Chart IV.6). Corporate bonds issuances were higher at ₹6.1 lakh crore during 2024-25 (up to November) than ₹5.0 lakh crore a year ago. Corporate bond yields and associated risk premia increased across ratings and tenor spectrums during December 16, 2024 - January 13, 2025 (Table IV.1). Reserve money (RM), excluding the first-round impact of change in the cash reserve ratio (CRR), recorded a growth of 7.2 per cent (y-o-y) as on January 10, 2025 (6.3 per cent a year ago) [Chart IV.7]. Growth in currency in circulation (CiC), the largest component of RM, stood at 5.3 per cent (y-o-y) as on January 10, 2025 as compared with 3.9 per cent a year ago. On the sources side (assets), net foreign assets (NFA) of the Reserve Bank increased by 4.9 per cent (y-o-y) as on January 10, 2025. Gold – a major component of NFA – grew by 49.0 per cent, mainly due to revaluation gains (Chart IV.8). Consequently, the share of gold in NFA increased from 8.1 per cent as at end-October 2023 to 11.2 per cent as on January 10, 2025. Money supply (M3) rose by 9.3 per cent (y-o-y) as on December 27, 2024 (11.0 per cent a year ago).18 Aggregate deposits with banks, accounting for around 86 per cent of M3, increased by 9.7 per cent (12.0 per cent a year ago). Scheduled commercial banks’ (SCBs’) credit growth moderated to 12.4 per cent as on December 27, 2024 from 15.6 per cent a year ago (Chart IV.9). | Table IV.1: Financial Markets - Rates and Spread | | | Interest Rates (per cent) | Spread (basis points) | | (Over Corresponding Risk-free Rate) | | Instrument | Nov 16, 2024 – Dec 15, 2024 | Dec 16, 2024 – Jan 13, 2025 | Variation | Nov 16, 2024 – Dec 15, 2024 | Dec 16, 2024 – Jan 13, 2025 | Variation | | 1 | 2 | 3 | (4 = 3-2) | 5 | 6 | (7 = 6-5) | | Corporate Bonds | | | | | | | | (i) AAA (1-year) | 7.82 | 7.89 | 7 | 114 | 115 | 1 | | (ii) AAA (3-year) | 7.68 | 7.75 | 7 | 88 | 93 | 5 | | (iii) AAA (5-year) | 7.60 | 7.64 | 4 | 75 | 79 | 4 | | (iv) AA (3-year) | 8.47 | 8.52 | 5 | 167 | 170 | 3 | | (v) BBB- (3-year) | 12.12 | 12.19 | 7 | 532 | 536 | 4 | Note: Yields and spreads are computed as averages for the respective periods.
Sources: FIMMDA; and Bloomberg. | SCBs’ deposit growth (excluding the impact of the merger) stood at 10.2 per cent as on December 27, 2024 (12.6 per cent a year ago) [Chart IV.10]. As on December 27, 2024 the system level incremental credit-deposit ratio stood at 94.4 per cent (Chart IV.11). With the statutory requirements for CRR and statutory liquidity ratio (SLR) at 4.25 per cent and 18 per cent, respectively, 77 per cent of deposits were available with the banking system for credit expansion as on December 27, 2024. 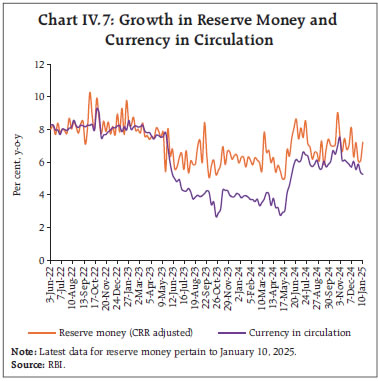 In response to the 250 basis points (bps) increase in the policy repo rate since May 2022, banks have revised their repo linked external benchmark-based lending rates (EBLRs) up by a similar magnitude. The 1-year median marginal cost of funds-based lending rate (MCLR) increased by 175 bps during May 2022 to December 2024. Consequently, the weighted average lending rates (WALRs) on fresh and outstanding rupee loans increased by 189 bps and 117 bps, respectively, during May 2022 to November 2024 (Table IV.2). On the deposit side, the weighted average domestic term deposit rates (WADTDRs) on fresh and outstanding deposits increased by 243 bps and 195 bps, respectively, during the same period. 
 Transmission across bank groups indicates that the increase in the WALR on fresh rupee loans was higher for public sector banks (PSBs) than private sector banks (PVBs). In the case of outstanding loans, however, the transmission for PSBs was lower. For deposits, transmission to WADTDRs in respect of both fresh and outstanding deposits was higher for PSBs than for PVBs during May 2022 and November 2024 (Chart IV.12).
The Government of India has kept the interest rates on small savings instruments unchanged for Q4:2024-25.19 With the moderation in average G-sec yields of corresponding maturities, the rates on most of the instruments, except for public provident fund, are above the formula-based rates. Indian equity markets faced fresh headwinds in the second half of December amidst a global selloff triggered by changes in the US Fed’s monetary policy outlook for 2025. Markets faced fresh turmoil on reports of a new virus outbreak in China. Overall, the BSE Sensex declined by 6.9 per cent since mid-December 2024 to close at 76,500 on January 14, 2025 (Chart IV.13). For the calendar year 2024 as a whole, the benchmark index recorded an annual gain of 8.2 per cent, making it the ninth consecutive year of positive returns. The benchmark index was outperformed with a wide margin as the BSE MidCap and BSE SmallCap gained 26.1 per cent and 29.3 per cent, respectively. Among sectors, healthcare and realty registered the maximum gains (Chart IV.14). | Table IV.2: Transmission to Banks’ Deposit and Lending Rates | | (Variation in basis points) | | Period | Repo Rate | Term Deposit Rates | Lending Rates | | WADTDR- Fresh Deposits | WADTDR- Outstanding Deposits | EBLR | 1-Yr. MCLR (Median) | WALR - Fresh Rupee Loans | WALR- Outstanding Rupee Loans | | Easing Phase Feb 2019 to Mar 2022 | -250 | -259 | -188 | -250 | -155 | -232 | -150 | | Tightening Period May 2022 to Nov* 2024 | +250 | 243 | 195 | 250 | 175 | 189 | 117 | Notes: Data on EBLR pertain to 32 domestic banks.
*: Data on EBLR and MCLR pertain to December 2024.
WALR: Weighted Average Lending Rate; WADTDR: Weighted Average Domestic Term Deposit Rate;
MCLR: Marginal Cost of Funds-based Lending Rate; EBLR: External Benchmark-based Lending Rate.
Source: RBI. |
Domestic capital markets deepened further in 2024, marked by a rise in turnover, size, and investor participation (Table IV.3). Primary markets closed the year strongly, with 34 firms raising ₹26,973 crore through initial public offerings (IPOs) in December 2024.20 India has claimed number one position globally in IPO volumes, listing almost twice as many IPOs as the US and more than two-and-a-half times as many as Europe.21
Gross inward FDI at US$ 55.6 billion during April-November 2024 were higher than US$ 47.2 billion from a year ago. Net FDI, however, declined to US$ 0.5 billion during April-November 2024 from US$ 8.5 billion a year ago, reflecting the rise in repatriation and net outward FDI (Chart IV.15). Gross FDI inflows remained concentrated in manufacturing, financial services, electricity and other energy, and retail and communication services sectors, which together accounted for more than 60 per cent of the flows. Source wise, Singapore, Mauritius, the UAE, the Netherlands, and the US account for more than 75 per cent of the flows during the period. FPI flows turned positive in December 2024 after two months but remained volatile on account of a higher US dollar and treasury/bond yields. Net FPI inflows of US$ 1.8 billion were recorded in December, with inflows in equity and debt segments taken together (Chart IV.16a). Global uncertainties and elevated domestic valuations resulted in net outflows of US$ 11.6 billion during Q3:2024-25, offsetting the net inflows of US$ 20.1 billion recorded during H1:2024-25. Similar trends of muted FPI performance were observed across most peer economies during the current financial year (Chart IV.16b). During January 2025 (up to January 13), FPIs recorded a net outflow of US$ 3.4 billion. | Table IV.3: Capital Markets in 2024 | | (₹ crore, except demat accounts which is in crore and retail direct accounts) | | | 2023 | 2024 | Per cent change | | Average Monthly SIP Contribution | 15,312 | 22,360 | 46.0 | | Number of Demat Accounts (end-period) | 13.9 | 18.5 | 33.0 | | Market Capitalisation of BSE (end-period) | 3,64,28,846 | 4,41,95,106 | 21.3 | | Asset under Management of Mutual Funds (end-period) | 50,77,900 | 66,93,032 | 31.8 | | Equity Derivatives Turnover | 7,23,15,81,303 | 11,56,16,28,457 | 59.9 | | Cash Market Turnover | 1,75,87,721 | 3,12,18,920 | 77.5 | | Total Accounts opened on RBI’s Retail-Direct platform (end-period) | 1,09,212# | 1,98,615 | 81.9 | Notes: Data is on calendar year basis; #: As of January 1, 2024.
Equity derivatives and cash market turnover pertain to both BSE and NSE combined.
Sources: SEBI, NSE, BSE, AMFI and RBI staff calculations. |

Net inflows under non-resident deposits (NRD) rose to US$ 12.6 billion during April-November 2024 from US$ 7.3 billion a year ago. Quarterly data for SCBs (excluding RRBs) showed that robust inflows were recorded in H1:2024-25 in all three accounts namely, Foreign Currency Non-Resident (Banks) [FCNR(B)], Non-Resident (External) Rupee Accounts [NR(E)RA] and Non-Resident Ordinary (NRO) accounts. The flow of deposits in Non-Resident External Rupee Account (NRE) was negative in the third quarter of 2024-25 (Chart IV.17).22
On a cumulative basis, external commercial borrowing (ECB) registrations (US$ 33.8 billion) as well as disbursements (US$ 30.9 billion) during April – November 2024 were higher in comparison with the corresponding period last year. Adjusting for ECB outflows on account of principal repayment of US$ 17.4 billion, net ECB inflows (US$ 13.5 billion) during the current financial year was more than double than a year ago (US$ 5.6 billion) [Chart IV.18]. Over 40 per cent of the total ECBs registered during April – November 2024 were related to capital expenditure, including on-lending and sub-lending (Chart IV.19). The overall cost of new ECBs raised during November 2024 declined by 71 bps (m-o-m) to 5.8 per cent due to decrease in both global benchmark rates such as Secured Overnight Financing Rate (SOFR) as well as weighted average interest margin (WAIM). The overall cost of ECBs registered during the current financial year so far (April- November 2024) declined by 12 bps to 6.6 per cent y-o-y (Chart IV.20). The strengthening US dollar exerted depreciating pressures on EME currencies in December 2024, leading to a depreciation of 0.7 per cent (m-o-m) in the Indian rupee (INR) during December 2024 (Chart IV.21). Nevertheless, the INR remained one of the least volatile major currencies during the month. The INR depreciated by 0.9 per cent (m-o-m) in terms of the 40-currency real effective exchange rate (REER) in December 2024, majorly on account of negative relative price differentials (Chart IV.22). India’s foreign exchange reserves stood at US$ 634.6 billion as on January 3, 2025, providing cover for about 11 months of imports or about 90 per cent of external debt outstanding at end-September 2024 (Chart IV.23a). India remains the fourth largest foreign exchange reserve holder in the world (Chart IV.23b). India’s current account deficit (CAD) declined to 1.2 per cent of GDP in Q2:2024-25 from 1.3 per cent of GDP a year ago (Q2:2023-24). Robust growth in services exports and remittance receipts cushioned the effect of a widening merchandise trade deficit on CAD during Q2:2024-25. Net capital inflows exceeded CAD, with strong flows under FPIs, ECBs and non-resident deposits, leading to net accretion of foreign exchange reserves (excluding valuation effects) to the tune of US$ 18.6 billion in Q2:2024-25 (Chart IV.24).
India’s external debt stood at 19.4 per cent of GDP at end-September 2024 as compared with 18.9 per cent of GDP at end-March 2024. Other external sustainability indicators recorded an improvement during the same period, emphasising India’s external sector resilience (Chart IV.25). India’s net international investment position (IIP) improved by US$ 19.8 billion during Q2:2024-25 and stood at US$ (-) 348.5 billion. Furthermore, the ratio of India’s international assets to international liabilities improved to 76.2 per cent in September 2024 from 74.1 per cent a quarter ago (Chart IV.26). Payment Systems Digital payments have been steadily rising in the past few years, as reflected in the ratio of the value of digital payments to nominal GDP (Chart IV.27). In December 2024, digital transactions continued to grow across payment modes, driven by end year demand (Table IV.4). The growth in transaction values of Real Time Gross Settlement (RTGS) and National Electronic Funds Transfer (NEFT) nearly doubled sequentially. The Unified Payments Interface (UPI) showcased its scalability and reliability with a 100 per cent uptime and processing of 54 crore daily average transactions in December 2024 (up from 39 crore in December 2023). The Bharat Bill Payment System (BBPS) witnessed a massive surge in transactions, predominantly driven by credit cards, direct-to-home (DTH) and electricity bill payments. The volume of credit card bill payments grew nearly 21 times in November 2024 y-o-y. In value terms, it increased by 25 times. Consequently, the share of credit card payments in overall BBPS transactions rose to 62 per cent from 9 per cent in the same period a year ago. The National Electronic Toll Collection (NETC) has shown a consistent decline in the proportion of dispute volumes under FASTags over the past year. The net chargeback ratio23 reduced to 0.16 per cent in November 2024 from 0.22 per cent in November 202324, reflecting improved customer satisfaction with the payment method. 
 The growing adoption of digital services is also reflected in a 35 per cent rise in non-financial transactions25, driven primarily by a near doubling of Aadhaar-enabled Payment System (AePS) tokenisation and an increase in BBPS bill requests.26 In December 2024, the Reserve Bank decided to enable UPI payments from/to full-KYC Prepaid Payment Instruments (PPIs) through third-party UPI applications, allowing PPI users to make/receive payments through the mobile application of third-party UPI applications.27 The introduction of the beneficiary bank account name look-up facility for RTGS and NEFT systems is expected to enhance customer experience. This feature allows customers to verify the name of the bank account before initiating a transfer, helping to avoid mistakes and prevent frauds.28 V. Conclusion The global economic outlook is one of steady growth in 2025 supported by lower but stubborn inflation which will likely taper expectations of the extent of monetary policy easing. Global financial conditions will remain constrained by public debt burdens and the unrelenting strength of the US dollar. Geopolitical tensions, volatile commodity prices, rising economic uncertainties could have a bearing on the trajectory of global growth during 2025. India’s economic growth is poised to rebound as domestic demand regains strength. Rural demand continues to gain momentum, reflecting a resilience in consumption, supported by brighter agricultural prospects. A revival in public capex on infrastructure is likely to stimulate growth in key sectors. Rising input cost pressures in the manufacturing sector, coupled with weather-related exigencies and global headwinds could, however, pose risks to this outlook. 2025 begins and the old order changes, yielding place to new. It will build loftier mansions, as the other departs, bidding adieu. The tumult and the clangour dies. The songs of spring are muted now, receding into the far distance in a morendo. The falcon’s cries get fainter as it turns again and again in widening circles away from the falconer. But winter has its music too - one last crescendo to rage against the dying of the light. This life we leave behind is like an arch through which the untraveled terrain of the future gleams to be followed like a lodestar and discovered. It shall be sought, to the utmost bounds of human thought and endeavour. “We may not be that strength that once moved earth and heaven, but that which we are, we are; strong in will to strive, to seek, to find, and not to yield.”29
|